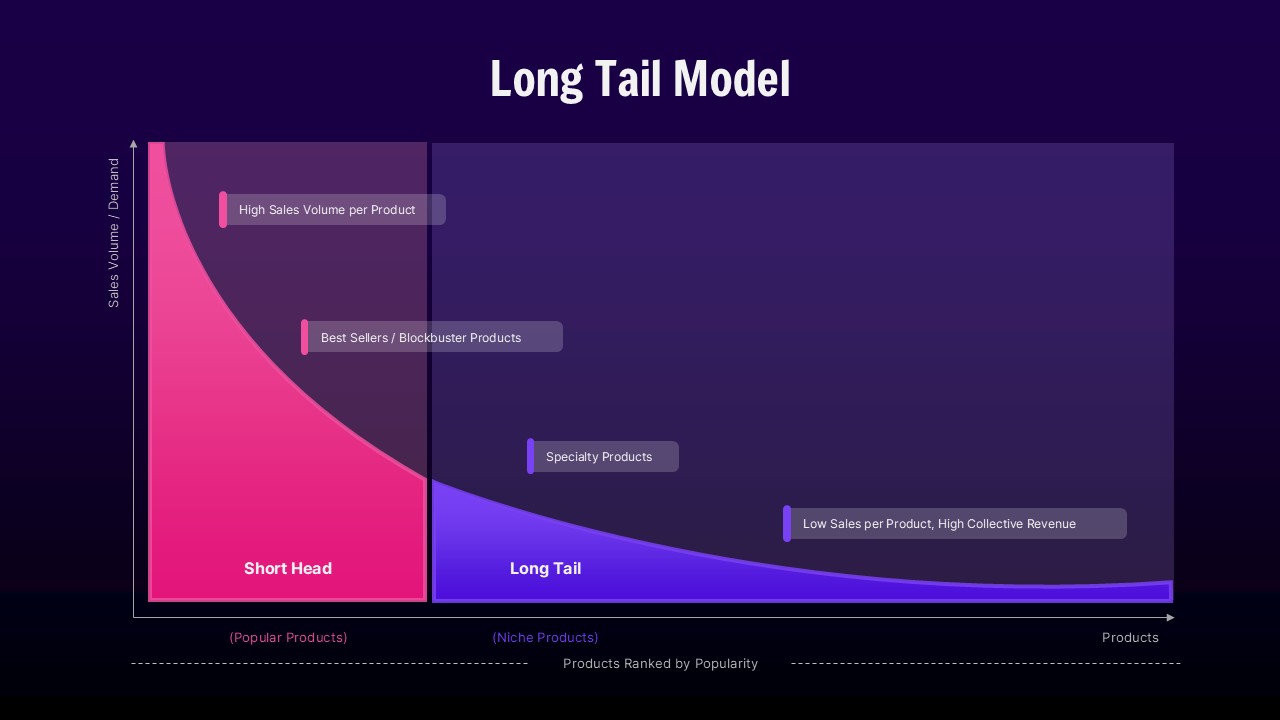
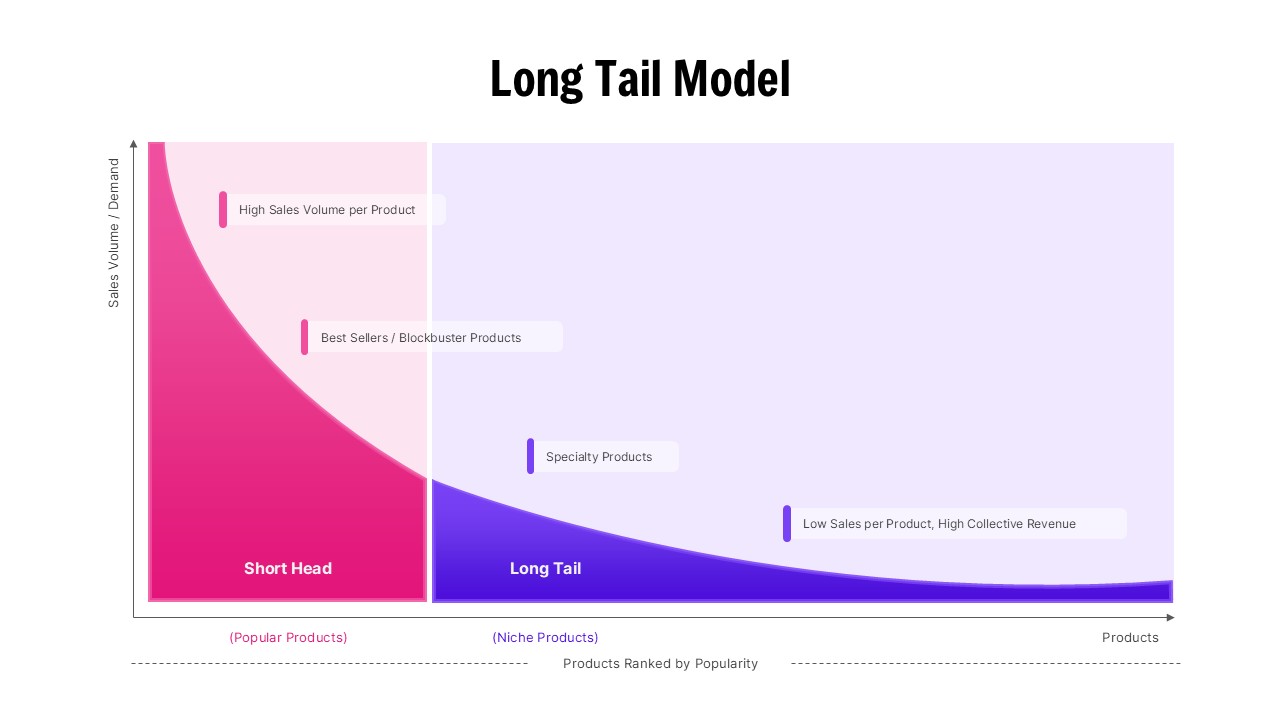
search

Essentials

Must-have decks for quick wins

By Industry

Professionally tailored slides for every sector

By Style

Minimal, modern and creative designs

By Topic

Explore slides curated by purpose and theme

TimelineTimelineRoadmapRoadmapStrategyStrategyGoalsGoalsTableTableComparisonComparisonSWOTSWOTAgendaAgendaArrowArrowWorld MapWorld MapMapsMapsProcessProcessFunnelFunnelTeamTeamOrg ChartOrg ChartPyramidPyramidCircularCircular

Business PlanBusiness PlanBusiness StrategyBusiness StrategyBusiness ProposalBusiness ProposalBusiness ModelsBusiness ModelsDigital MarketingDigital MarketingMarketing FunnelMarketing FunnelCustomer ExperienceCustomer ExperienceProject StatusProject StatusGantt ChartGantt ChartRecruitmentRecruitmentEmployee PerformanceEmployee PerformanceLeadershipLeadershipAIAIMachine LearningMachine Learning

AI Presentation Maker

Install the Windows plugin for quick access to templates and design tools.

AI Infographics Maker

Use our Office 365 add - in to access templates directly from the cloud.

Exe Version

Install the Windows plugin for quick access to templates and design tools.

Office 365

Use our Office 365 add - in to access templates directly from the cloud.

Mac Version

Get the Mac plugin to easily browse, insert, and customize templates and visuals within PowerPoint.

Long Tail Model PowerPoint Template

Long Tail Model PowerPoint Template
This template is part of a deck featuring multiple slides. To check out all slides, click on See All. See All round right arrow
Long Tail Model Business Strategy Diagram Template

Description

This long tail model diagram visually explains how products with low individual sales volumes can collectively generate significant revenue alongside best-selling items. The slide clearly separates the “short head” and “long tail” using a smooth, declining curve that maps sales volume against products ranked by popularity. High-performing blockbuster products appear on the left, while niche and specialty products extend across the long tail on the right. Subtle color transitions and labeled callouts make it easy to distinguish between popular products, specialty offerings, and cumulative revenue potential, ensuring the concept is instantly understandable even for non-technical audiences.

Designed with clarity and presentation impact in mind, this template is fully editable in PowerPoint and Google Slides. Users can customize labels, colors, and annotations to reflect their specific business model, industry, or dataset. The clean layout and balanced spacing allow presenters to explain complex revenue distribution concepts in a single, compelling visual, making it ideal for strategic discussions and executive presentations.

Who is it for

This slide is well suited for business strategists, product managers, marketers, and e-commerce professionals who need to explain revenue distribution, portfolio strategy, or demand patterns. Consultants, MBA students, and startup founders can also use it to illustrate long tail economics in pitches, lectures, or strategy workshops.

Other Uses

Beyond business strategy, this diagram can be adapted for content performance analysis, digital media catalogs, inventory planning, or platform economics. It also works well for presentations on recommendation systems, niche marketing strategies, or customer demand modeling across industries.

Login to download this file