


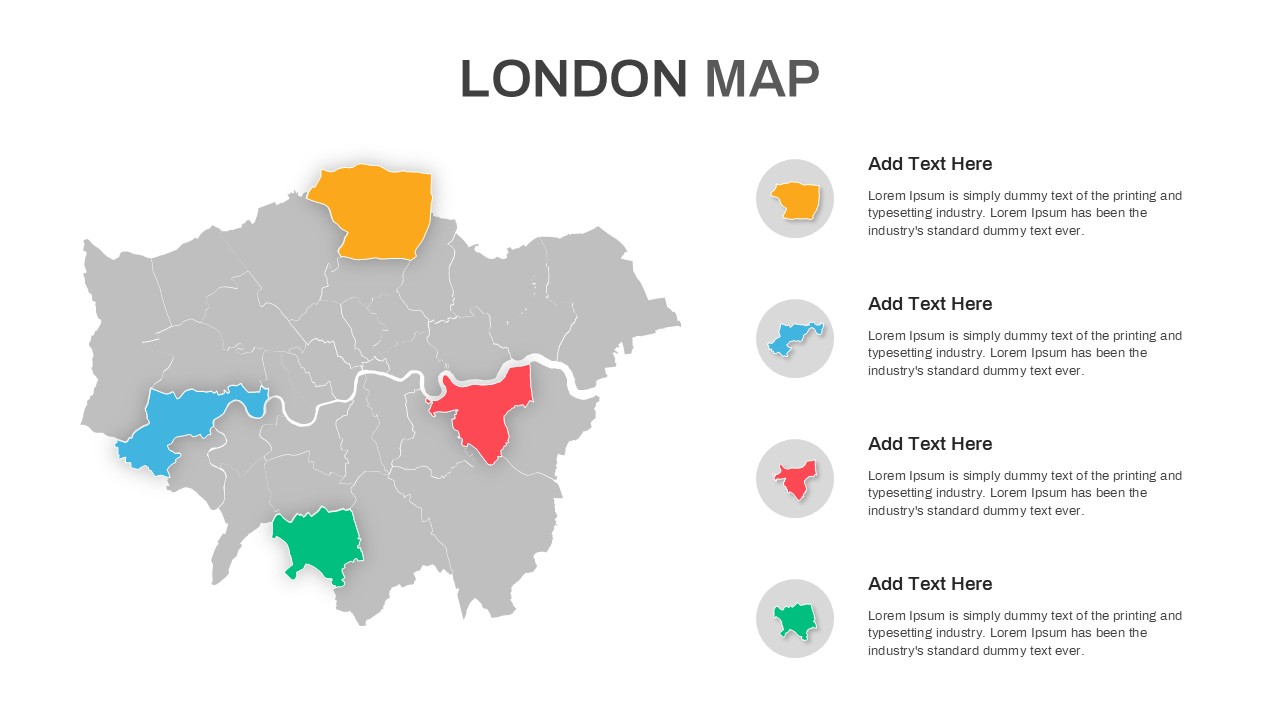
Editable London Map with Highlighted Boroughs Template
This template is part of a deck featuring multiple slides. To check out all slides, click on See All.
See All

Login to download this file
Item ID
SB05436Designed By
Athira

Login to download this file
Item ID
SB05436Designed By
Athira