Liquidity Ratios PowerPoint Template featured image

Description
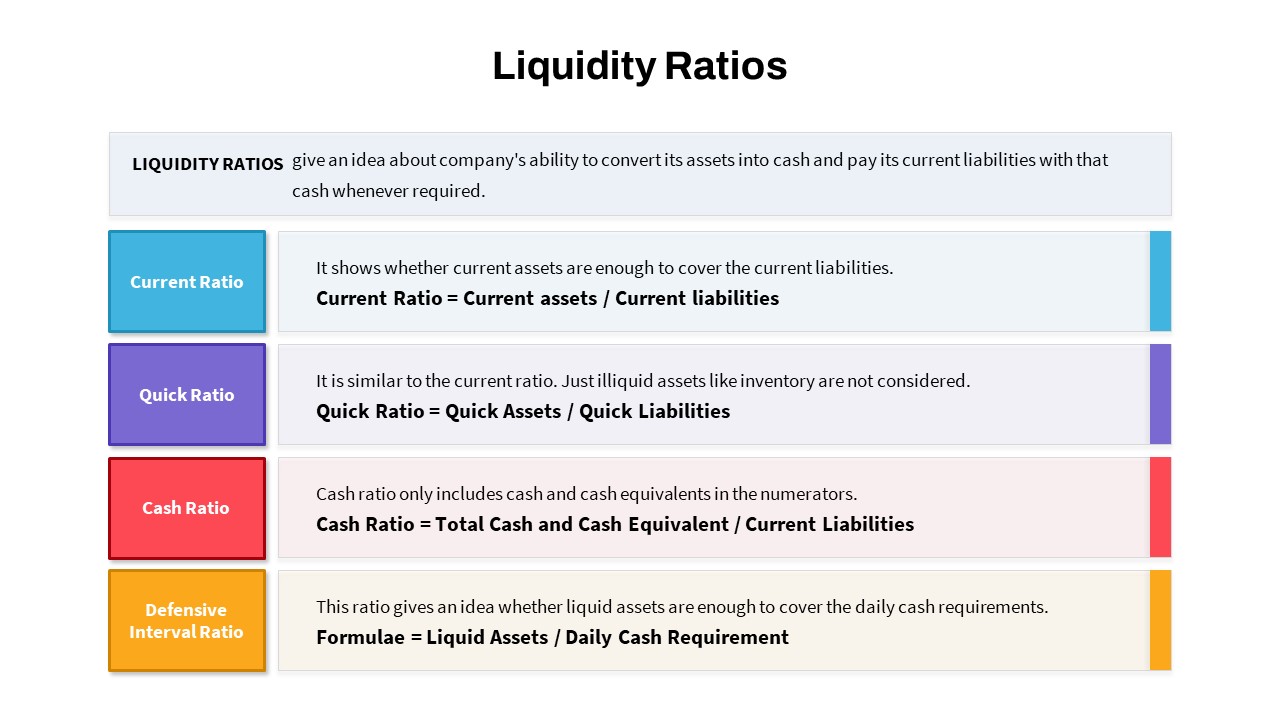
Enhance your financial presentations with this comprehensive liquidity ratios infographic slide. Designed to clarify a company’s short-term financial strength, it illustrates four key metrics—Current Ratio, Quick Ratio, Cash Ratio, and Defensive Interval Ratio—alongside concise formulas and explanations. Each ratio appears in a distinct, color-coded panel (blue, purple, red, and orange) with bold headings and clear text blocks, ensuring audiences can quickly grasp both definition and calculation. A clean title bar and introductory definition box at the top provide essential context, while the balanced alignment and generous white space deliver a polished, professional look.
This fully editable slide leverages vector shapes, custom fonts, and intuitive placeholders that let you adjust data points, swap color schemes, or reposition elements in seconds. Whether you need to match corporate branding or update formulas for specific reporting periods, this asset maintains clarity and consistency without sacrificing resolution. Optimized for both PowerPoint and Google Slides, it streamlines collaboration and eliminates formatting issues across platforms, ensuring your ratio analysis always looks its best.
Who is it for
Finance professionals, accountants, CFOs, and business analysts will benefit most from this liquidity ratios slide when presenting financial health assessments, cash-flow analyses, or credit evaluations. Investment bankers, financial consultants, and MBA students can also leverage its structured design for boardroom reports, classroom lectures, or strategic workshops.
Other Uses
Beyond traditional liquidity analysis, this versatile infographic can illustrate KPI comparisons, ratio benchmarking in industry reports, or financial dashboard summaries. It also adapts well for training sessions, investor pitches, or academic case studies, enabling presenters to convey complex financial data with clarity and impact.
Login to download this file


