Kubler Ross Change Curve for PowerPoint

Description
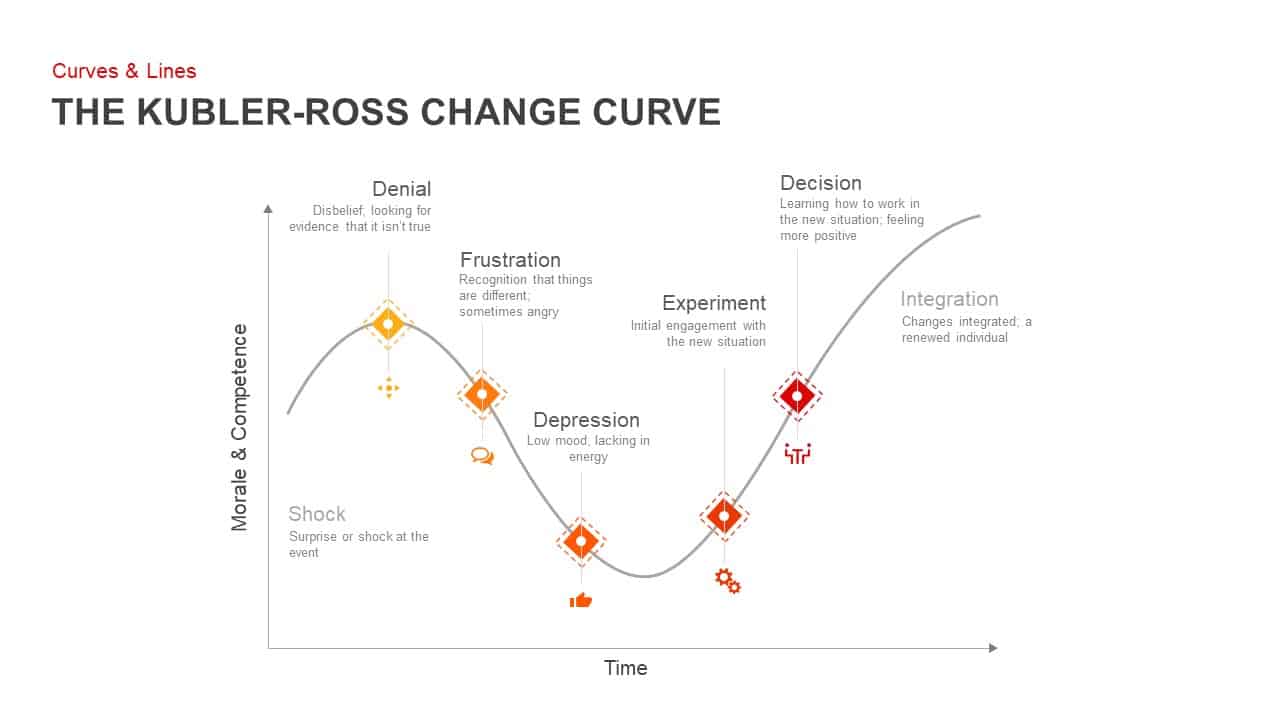
Use this Kubler-Ross Change Curve infographic slide to visualize the emotional and competence journey individuals undergo during transitions, organizational change, or new project initiatives. The template features a smooth S-shaped curve plotted against horizontal (Time) and vertical (Morale & Competence) axes, with distinct diamond markers for each of the seven transition stages—Shock, Denial, Frustration, Depression, Experiment, Decision, and Integration. Icons and color cues highlight each phase, while dashed leader lines connect to text placeholders, providing space for definitions, metrics, or behavioral insights. The clean white background and sans-serif typography ensure legibility in boardroom presentations and digital reports.
Fully built with editable vector shapes and master slide layouts, this asset enables rapid customization: swap out icons, adjust node colors, or resize the curve to fit your narrative. Use the theme panel to apply corporate color palettes or recolor individual markers to align with brand guidelines. Add sequential entrance animations to reveal each stage in order or apply fade and zoom transitions for emphasis. The modular design allows you to duplicate sections to compare historical versus projected change responses, overlay trendlines, or insert charts and KPI dashboards alongside nodes to correlate performance metrics with emotional states.
Ideal for change management workshops, executive briefings, training sessions, or stakeholder alignment meetings, this slide helps HR professionals, project managers, and organizational consultants communicate the human side of change with clarity. Beyond change initiatives, repurpose the S-curve framework to illustrate product adoption lifecycles, competency development paths, or performance improvement journeys. Duplicate and adapt the layout to showcase scenario planning, risk mitigation timelines, or learning and development roadmaps. Optimized for PowerPoint and Google Slides, the slide maintains full vector fidelity, formatting consistency, and animation integrity across platforms, ensuring a seamless presentation experience.
Who is it for
Change managers, HR leaders, and organizational development specialists will benefit from this change curve diagram when facilitating transition workshops, briefing executives, or tracking team morale. Project managers, consultants, and training facilitators can leverage the clear, stage-by-stage structure to align stakeholders and illustrate progress.
Other Uses
Repurpose this S-curve layout for product adoption lifecycles, competency growth paths, performance improvement plans, or risk response timelines. Use the diamond markers to highlight milestone achievements, training checkpoints, or scenario-based projections in any corporate, academic, or nonprofit presentation.
Login to download this file


