KPI Presentation Templates for PowerPoint and Google Slides
![]() Filter
Filter
Filter
-

Interactive Benchmarking Gauge Dashboard Template for PowerPoint & Google Slides
Pie/Donut
-

Benchmarking Metrics Comparison Slide Template for PowerPoint & Google Slides
Pie/Donut
-

Dynamic Benchmarking Comparison Chart Template for PowerPoint & Google Slides
Comparison Chart
-

Colorful Block Infographic Metrics Slide Template for PowerPoint & Google Slides
Infographics
-

Vibrant Gradient VC Pitch Deck Template for PowerPoint & Google Slides
Pitch Deck
-

KPI Dashboard Data Visualization Template for PowerPoint & Google Slides
Bar/Column
-

KPI Dashboard Data Overview Slide Template for PowerPoint & Google Slides
Bar/Column
-

KPI Dashboard Overview template for PowerPoint & Google Slides
Finance
-

KPI Dashboard template for PowerPoint & Google Slides
Business Report
-
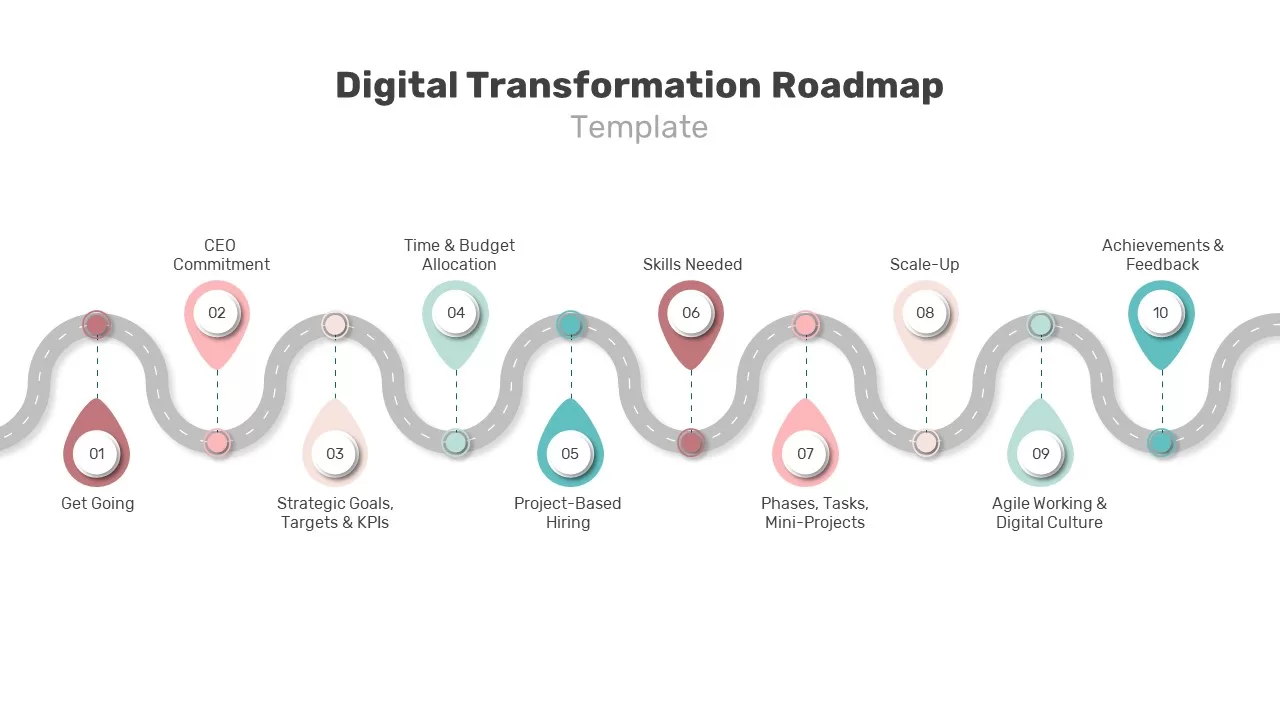
Digital Transformation Roadmap Slide Template for PowerPoint & Google Slides
Roadmap
-

North America Percentage Map Infographic Template for PowerPoint & Google Slides
World Maps
-
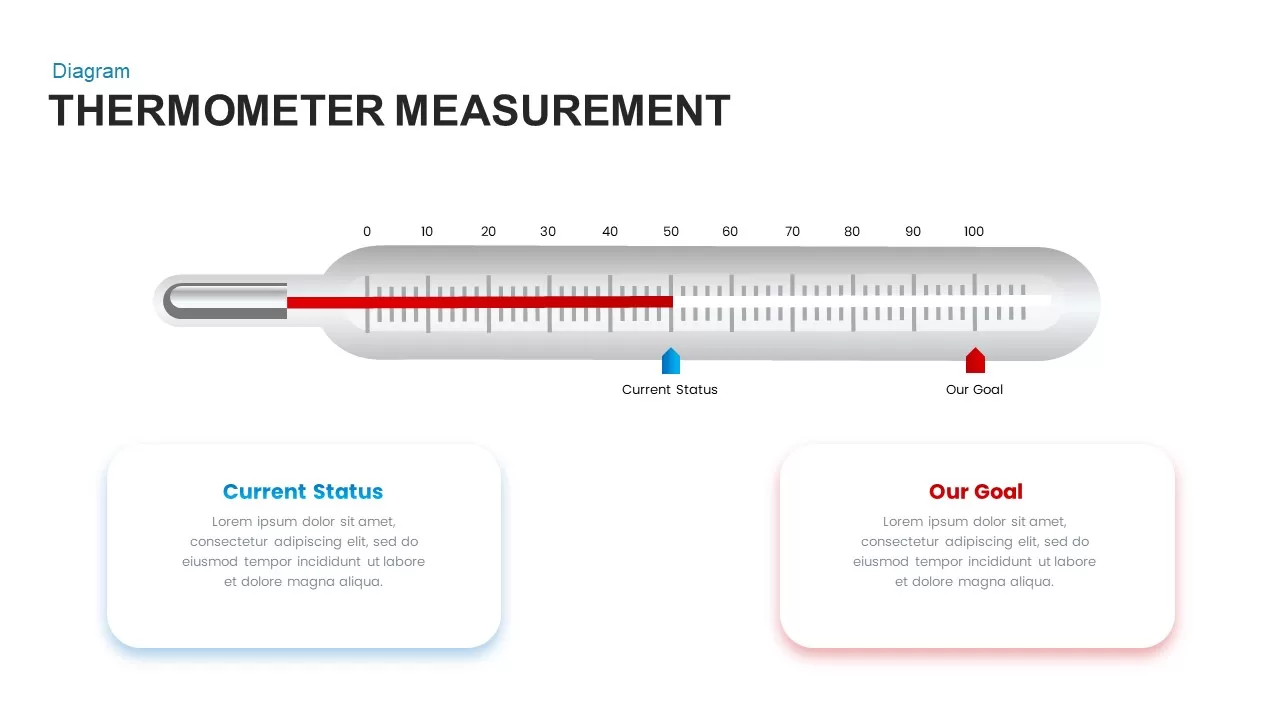
Thermometer Gauge Progress Measurement Template for PowerPoint & Google Slides
Comparison
-
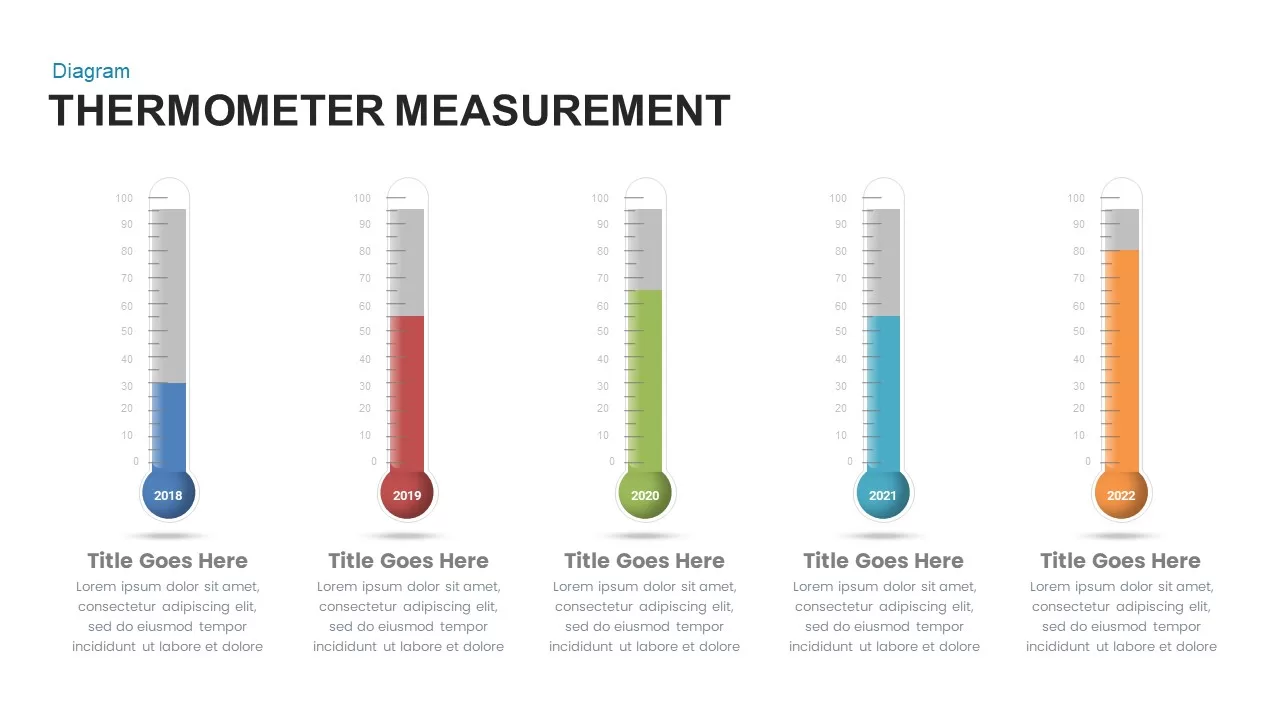
Thermometer Measurement Timeline Diagram Template for PowerPoint & Google Slides
Timeline
-
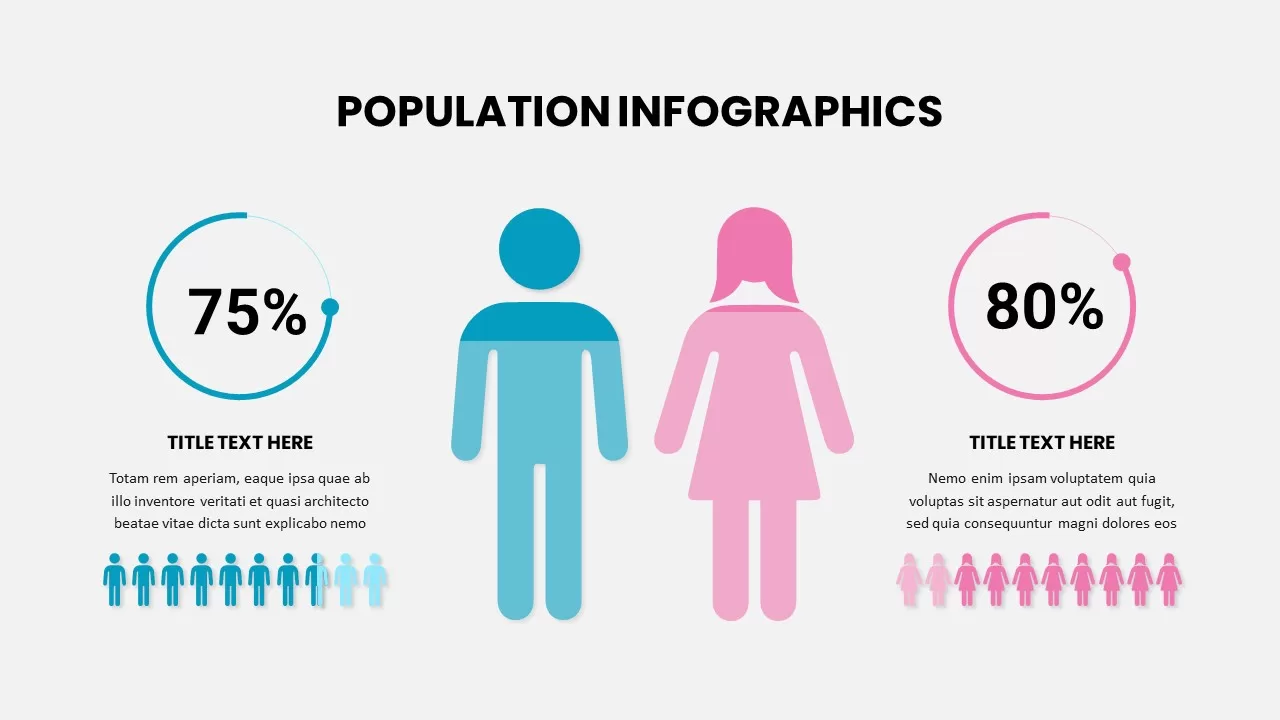
Population Infographic Template for PowerPoint & Google Slides
Comparison
-
Sales Plan Presentation Template for PowerPoint & Google Slides
Business Plan
-
Data-driven GDP Growth Infographic Pack Template for PowerPoint & Google Slides
Infographics
-
Competitive Landscape Comparison Template Pack for PowerPoint & Google Slides
Comparison
-
Performance KPI Dashboard Slide Template for PowerPoint & Google Slides
Business Report
-
Comprehensive Recruitment Metrics Report Template for PowerPoint & Google Slides
Recruitment
-
RAG Status Infographic Comparison Template for PowerPoint & Google Slides
Project
-
Corporate Performance Management Template for PowerPoint & Google Slides
Pitch Deck
-
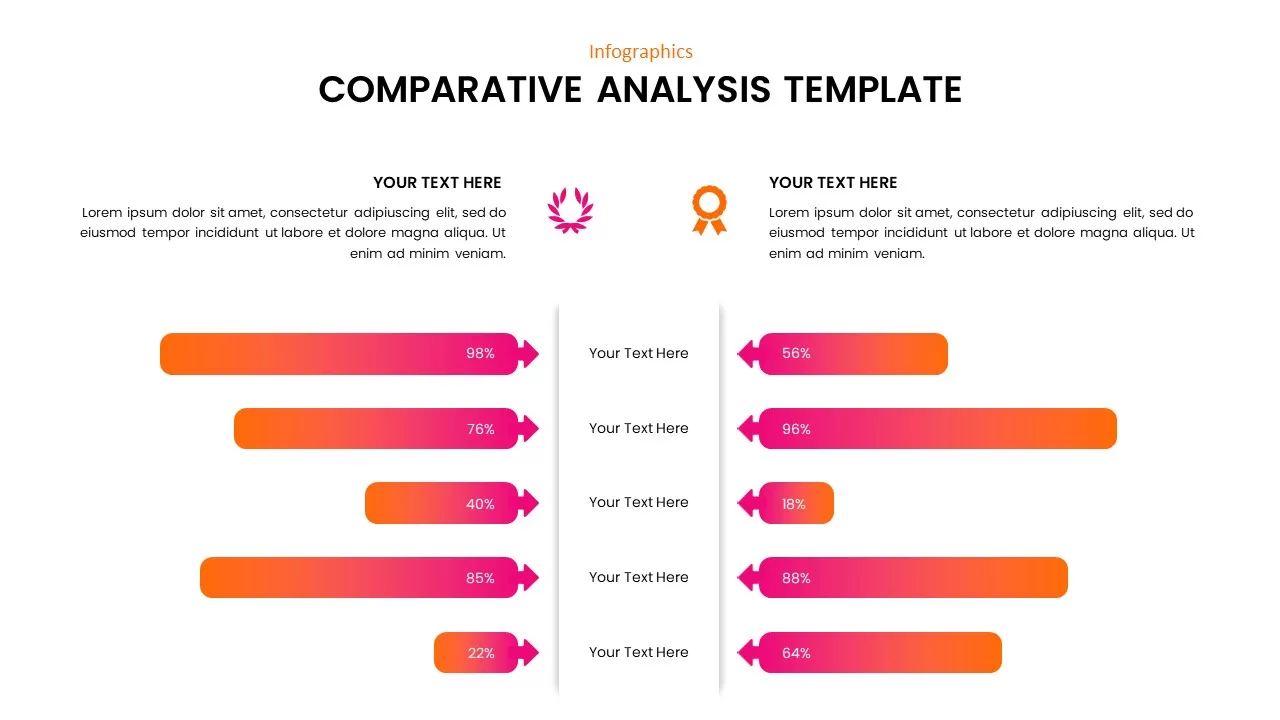
Comparative Analysis template for PowerPoint & Google Slides
Business Report
-
Financial Report Metaphor Illustration Template for PowerPoint & Google Slides
Finance
-
Business Growth Metaphor Chart Template for PowerPoint & Google Slides
Business
-
Dashboard Templates for PowerPoint & Google Slides
Bar/Column
-
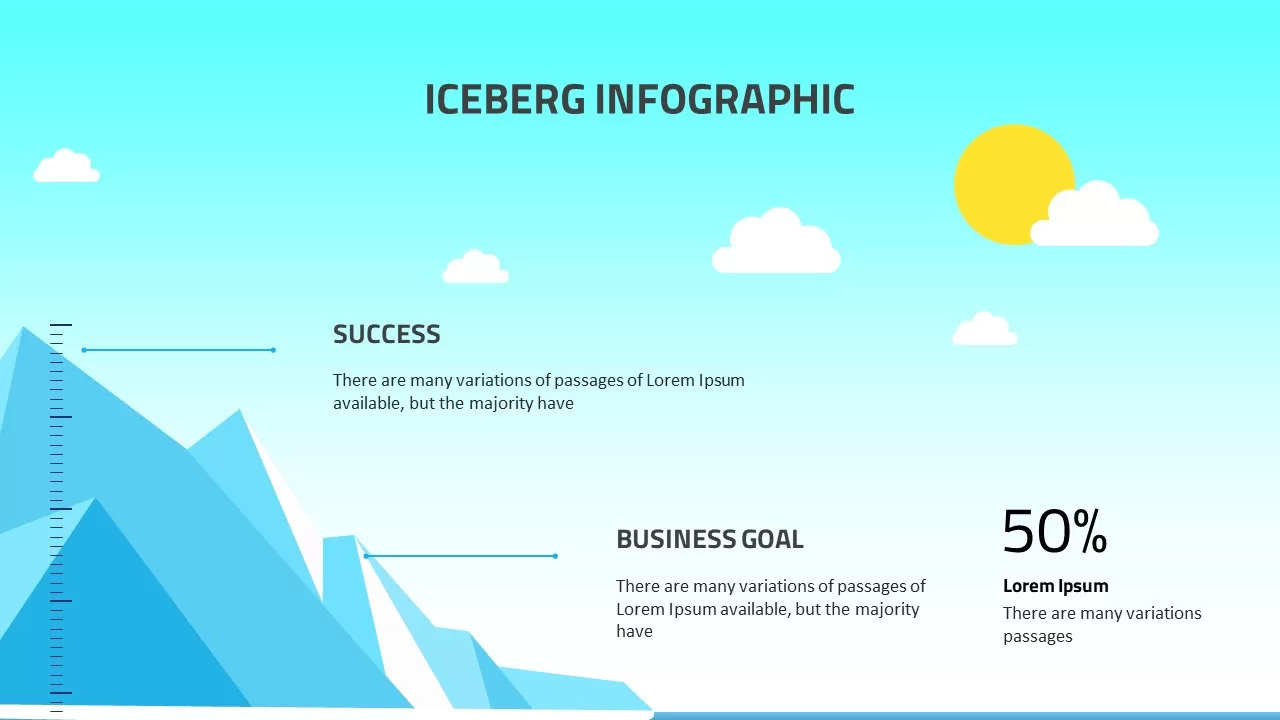
Iceberg Infographic for PowerPoint & Google Slides
Iceberg Charts
-

Dynamic Marketing Radar Chart Analytics Template for PowerPoint & Google Slides
Comparison
-
Purple Gradient Company Profile Deck Template for PowerPoint & Google Slides
Company Profile
-
Fact and Figures Comparison Slide Template for PowerPoint & Google Slides
Business Report
-
Gradient Annual Plan & Strategy Deck Template for PowerPoint & Google Slides
Decks
-
Social Media Performance Dashboard Template for PowerPoint & Google Slides
Bar/Column
-
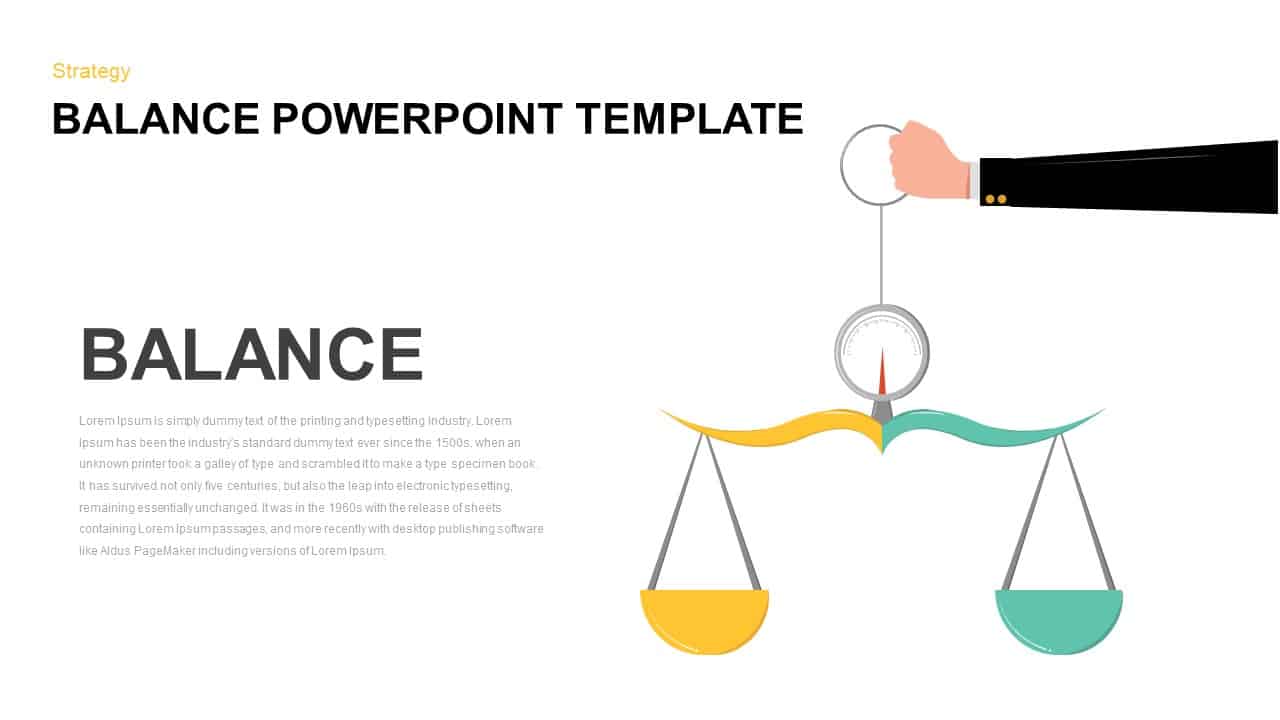
Balance Scale Visualization Infographic Template for PowerPoint & Google Slides
Comparison
-
Sales Growth Dashboard: KPI Gauge & Line Template for PowerPoint & Google Slides
Revenue
-
Car Sales Market Share Pie Chart Template for PowerPoint & Google Slides
BCG
-
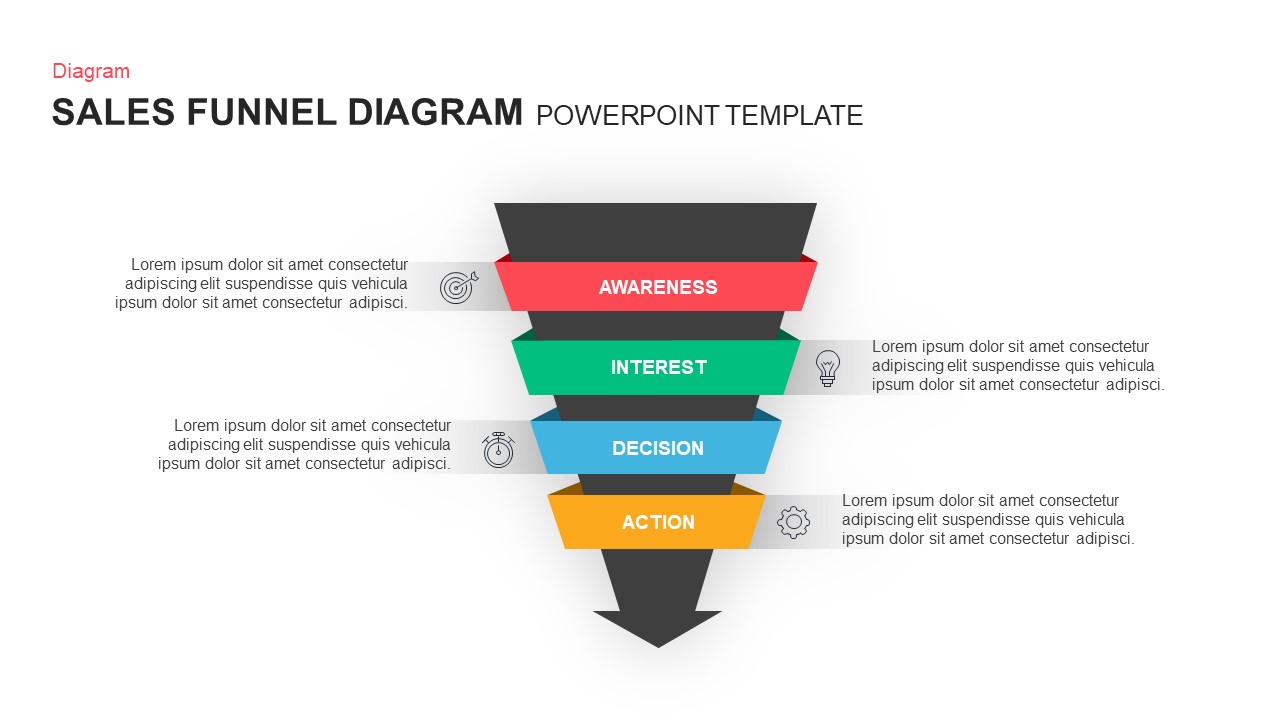
Professional Sales Funnel Diagram Template for PowerPoint & Google Slides
Funnel