KPI Presentation Templates for PowerPoint and Google Slides
Drive results and make your performance data stand out with our KPI Presentation Templates for PowerPoint and Google Slides. These templates are designed for business executives, project managers, sales and marketing teams, financial analysts, HR managers, product managers, consultants, entrepreneurs, and more who need to present key performance indicators with clarity and impact.
Take the next step. Explore our KPI Presentation Templates now, select the design that fits your goals. Start building presentations that not only inform but also inspire action and deliver measurable results for your organization.
![]() Filter
Filter
Filter
-
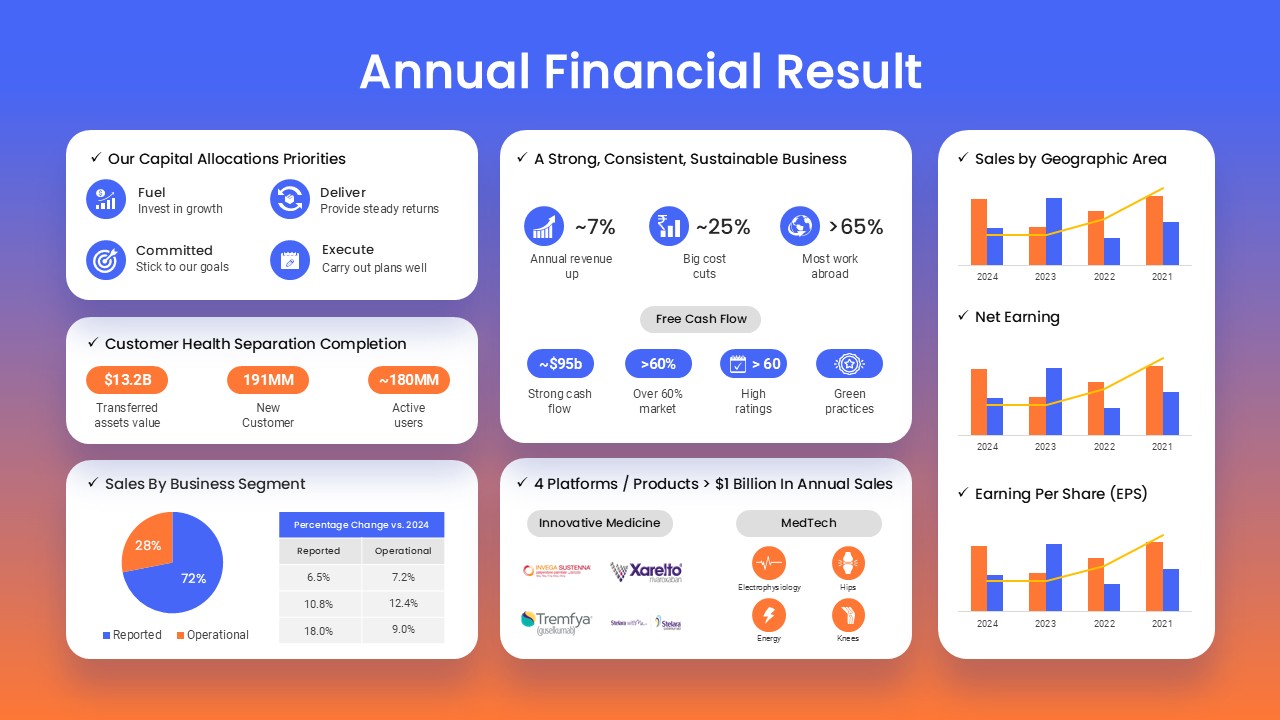
Annual Financial Results Slide Deck Template for PowerPoint & Google Slides
Finance
-
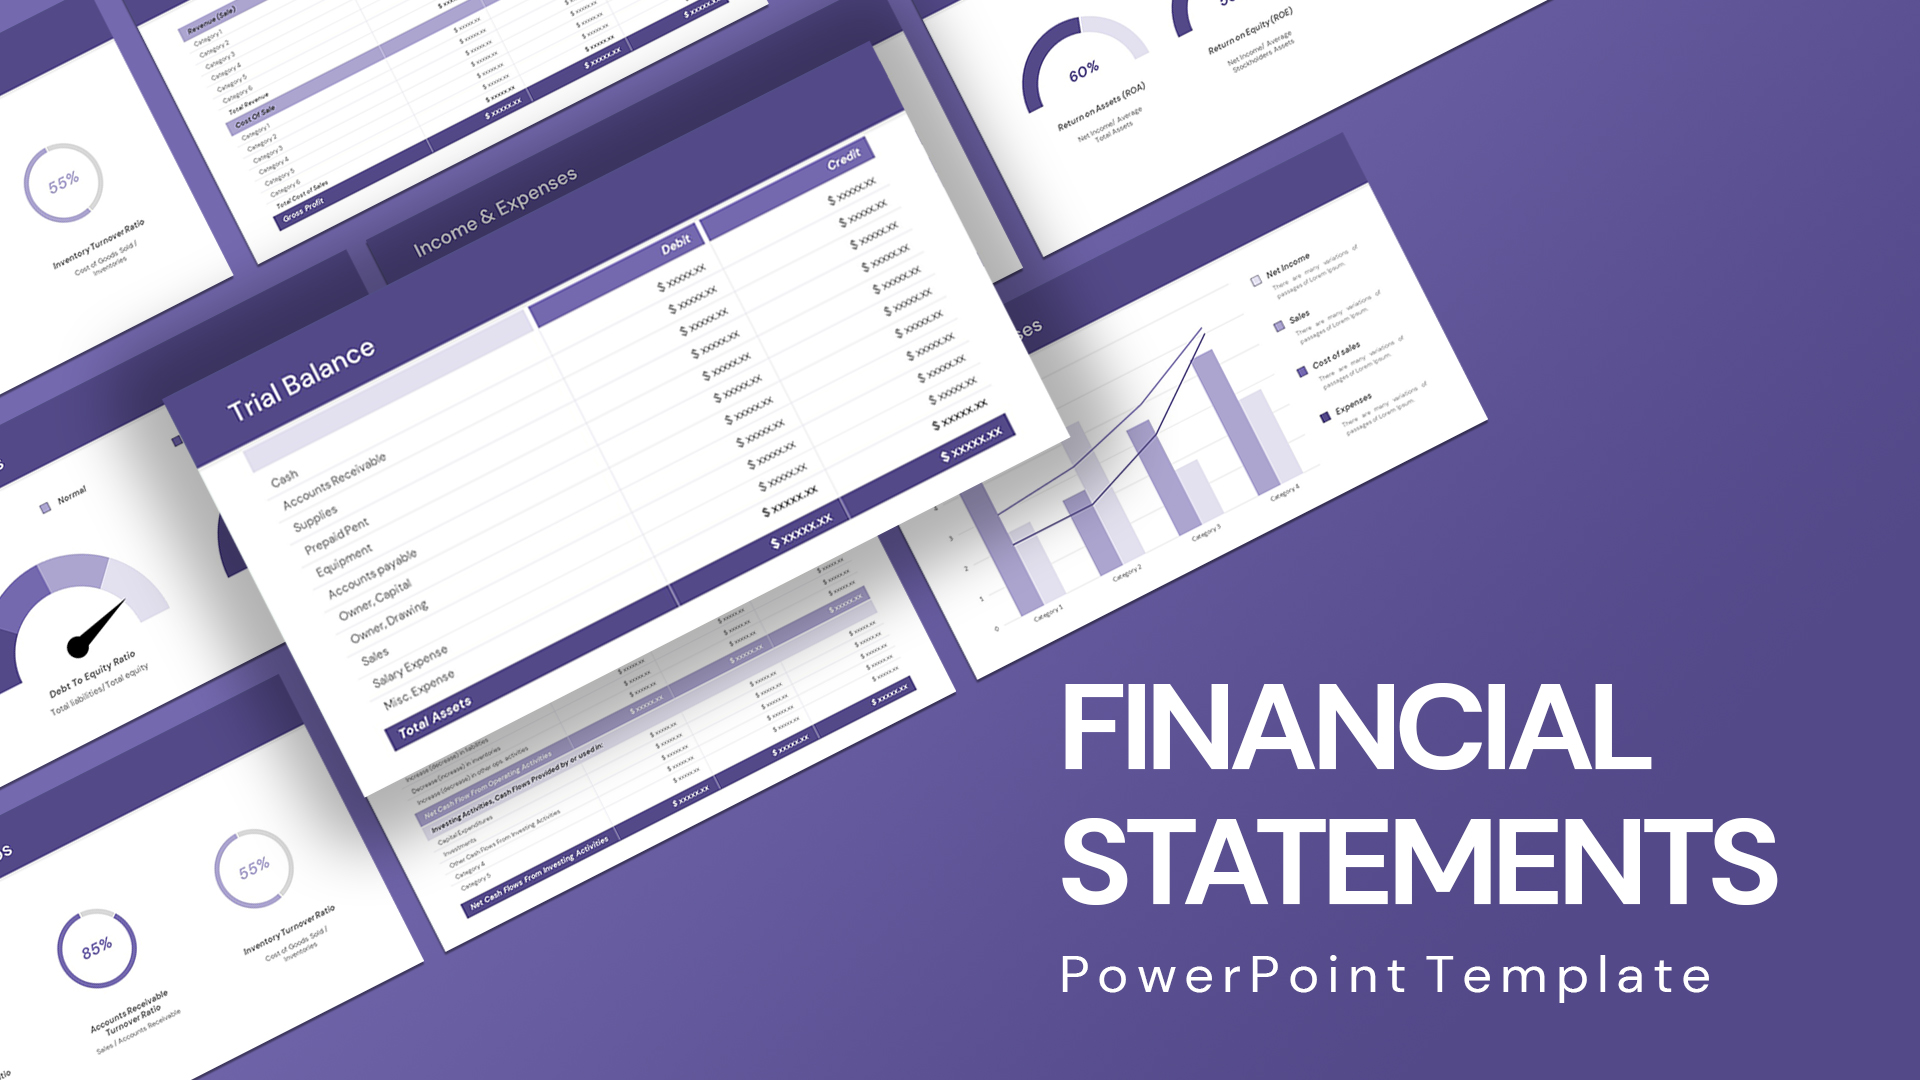
Comprehensive Financial Statements Template for PowerPoint & Google Slides
Finance
-
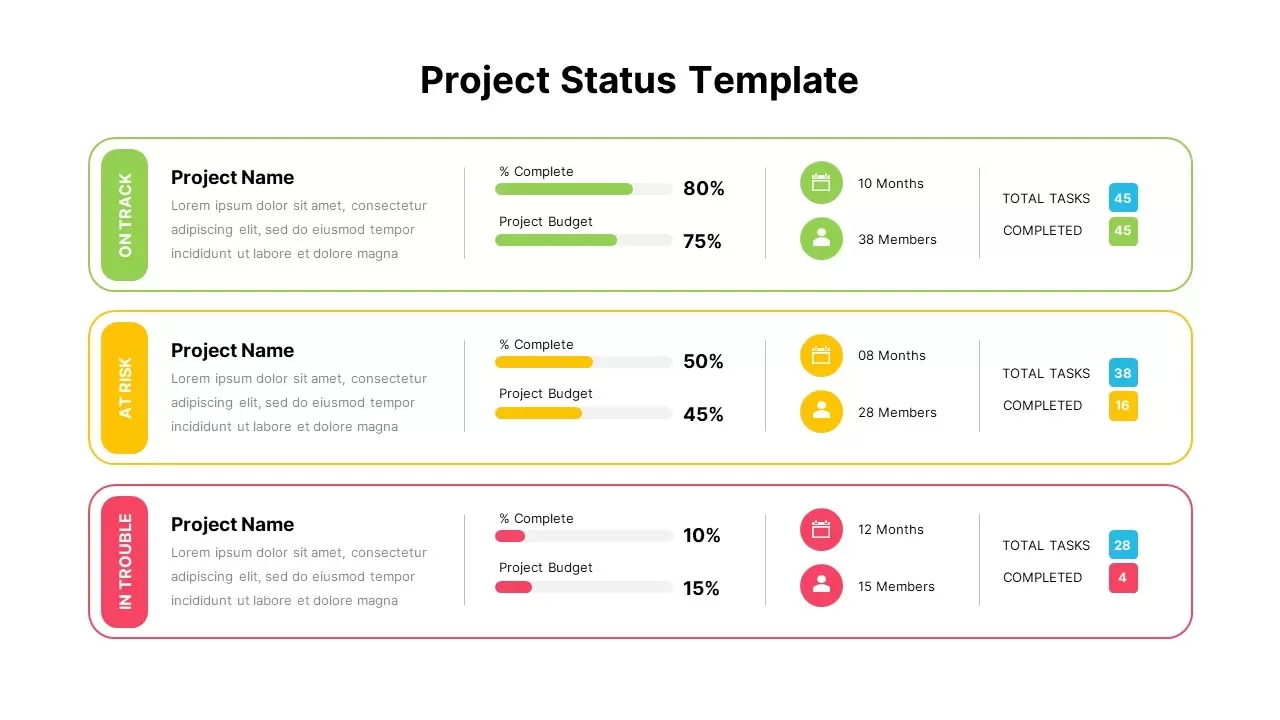
Color-Coded Project Status Template for PowerPoint & Google Slides
Project Status
-
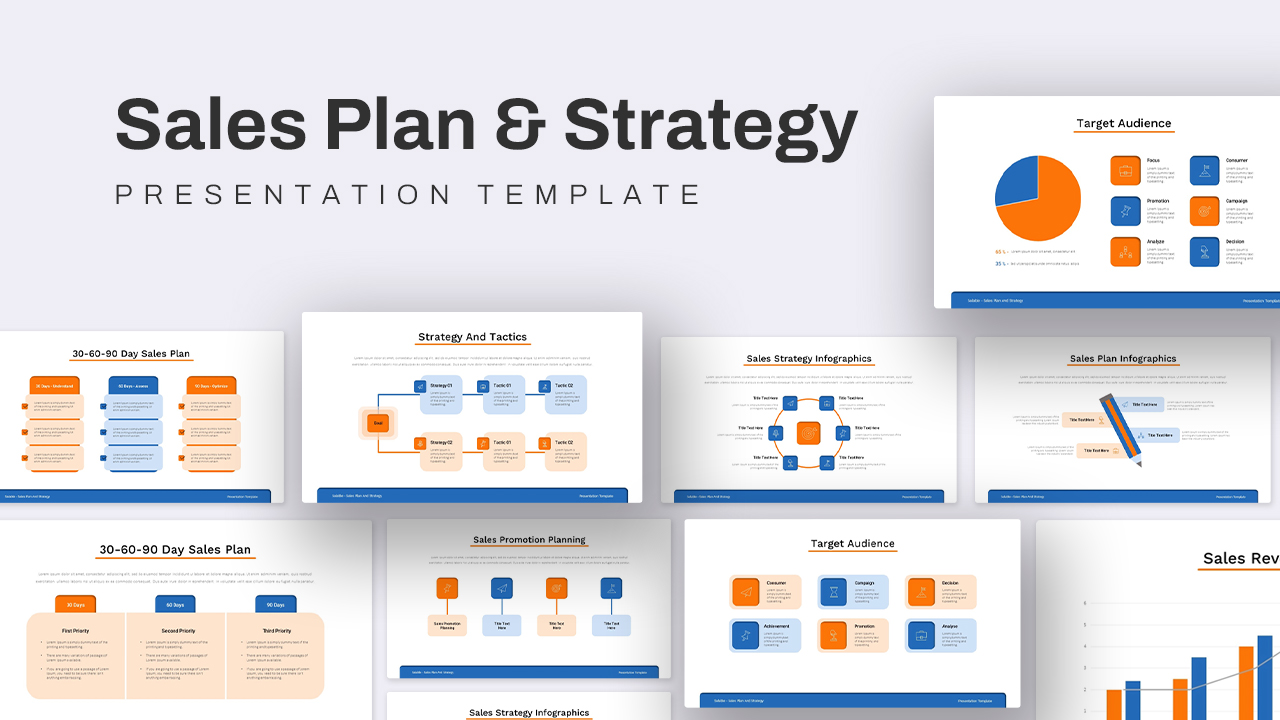
Sales Plan & Strategy Overview template for PowerPoint & Google Slides
Business Strategy
-
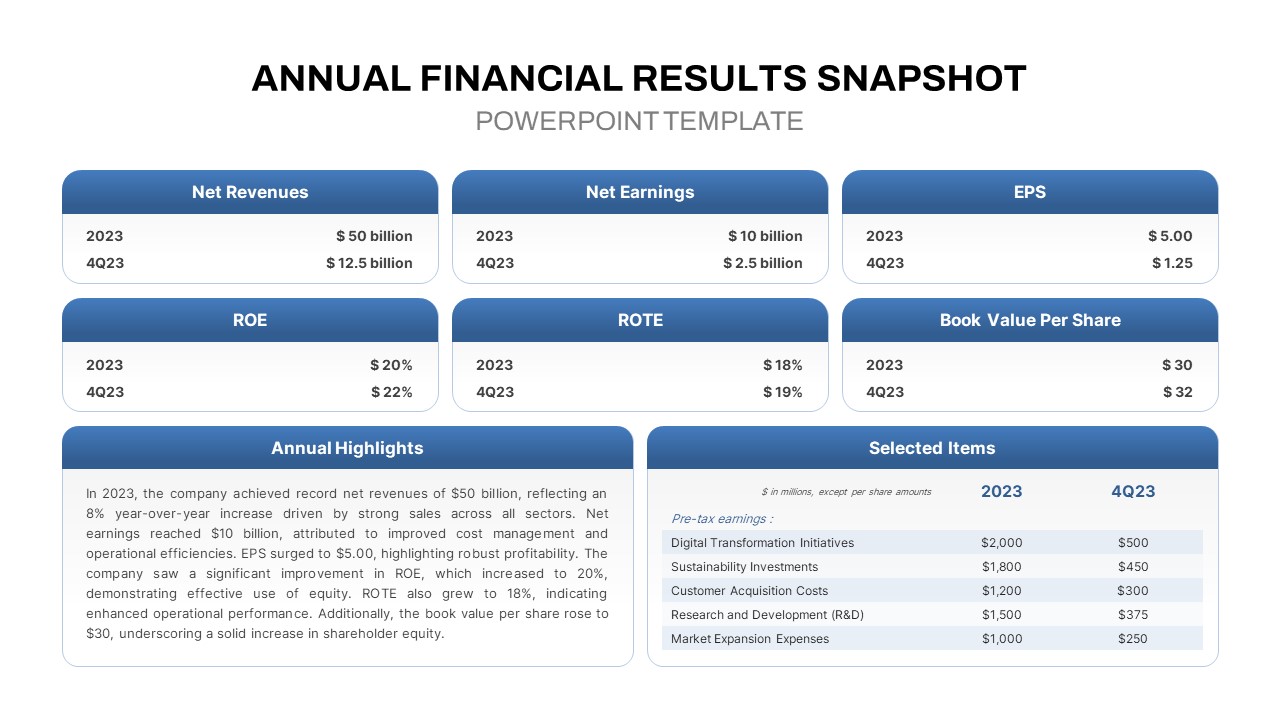
Annual Financial Results Snapshot Template for PowerPoint & Google Slide
Finance
-

Quarterly Financial Summary Dashboard Template for PowerPoint & Google Slides
Business Report
-

Sales Growth Comparison Chart & Table Template for PowerPoint & Google Slides
Bar/Column
-
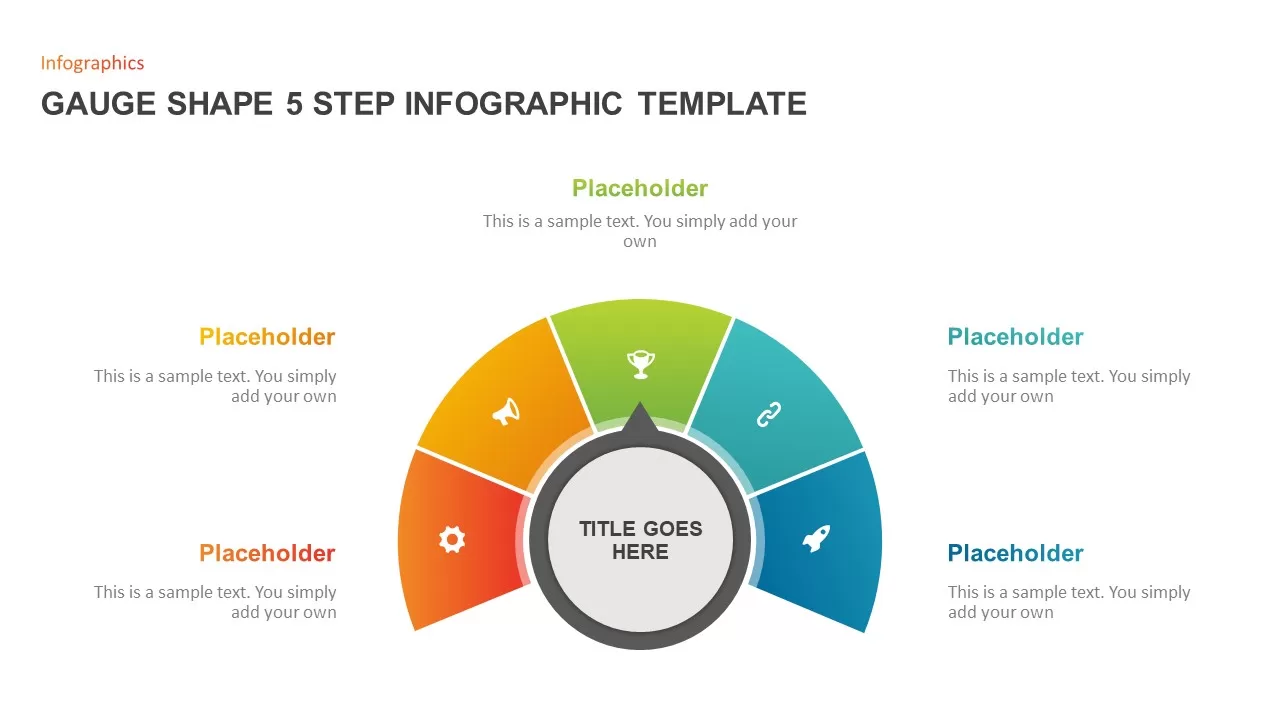
Gauge Shape 5-Step Infographic Diagram Template for PowerPoint & Google Slides
Process
-
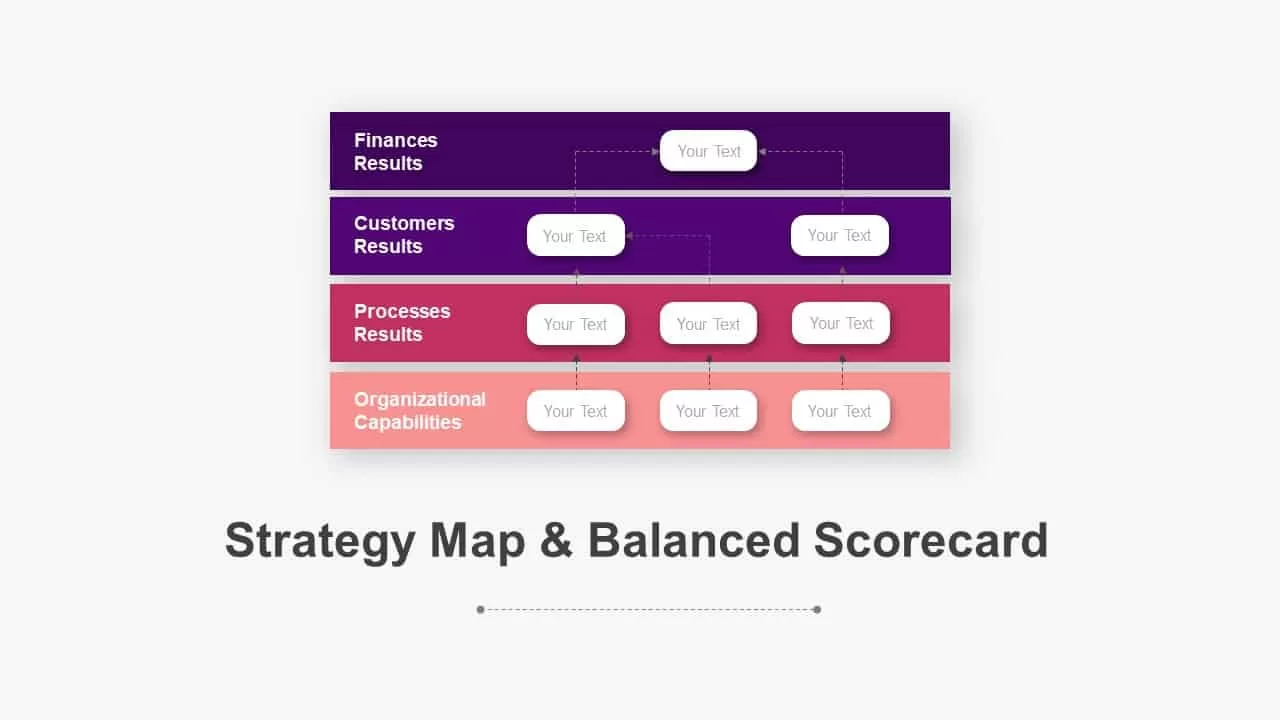
Balanced Scorecard Strategy Map Diagram Pack for PowerPoint & Google Slides
Business Strategy
-

Immigration Data Dashboard Template for PowerPoint & Google Slides
Bar/Column
-

Risk Management Heat Map Diagram Template for PowerPoint & Google Slides
Comparison Chart
-

Free Data Analytics Dashboard Template for PowerPoint
Charts
Free
-

3D Bar Graph Infographic Template for PowerPoint & Google Slides
Bar/Column
-

Professional Team Efficiency Dashboard Template for PowerPoint & Google Slides
Business Report
-
Business Dashboard Analytics & KPIs Template for PowerPoint & Google Slides
Bar/Column
-
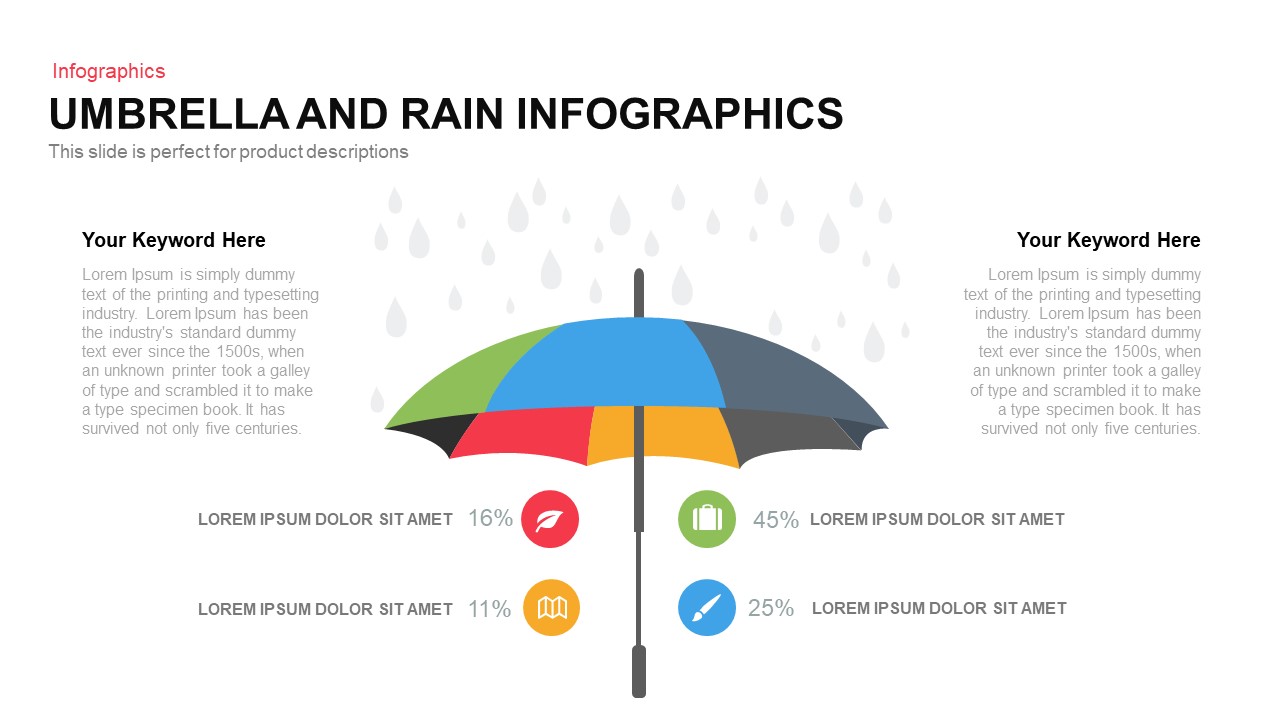
Umbrella and Rain Infographic Metrics Template for PowerPoint & Google Slides
Comparison
-
Data Analytics Dashboard Design template for PowerPoint & Google Slides
Bar/Column
-
Product Usage Analytics Dashboard Chart Template for PowerPoint & Google Slides
Bar/Column
-
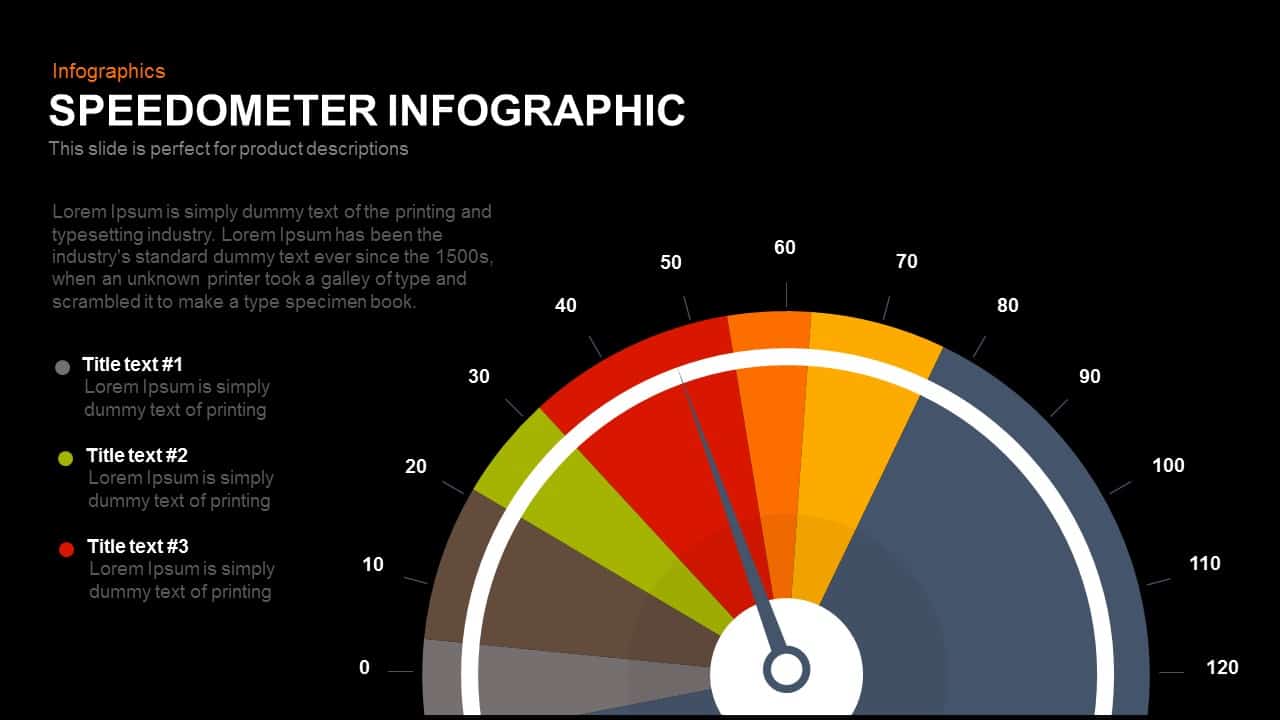
Speedometer Infographic for PowerPoint & Google Slides
Circular
-
Dynamic Data Dashboard Infographic Template for PowerPoint & Google Slides
Bar/Column
-
Speedometer Infographic Gauge Comparison Template for PowerPoint & Google Slides
Comparison
-
Asia Map with KPI Metrics and Legend Template for PowerPoint & Google Slides
World Maps
-
Profit Performance Trend Chart Template for PowerPoint & Google Slides
Finance
-
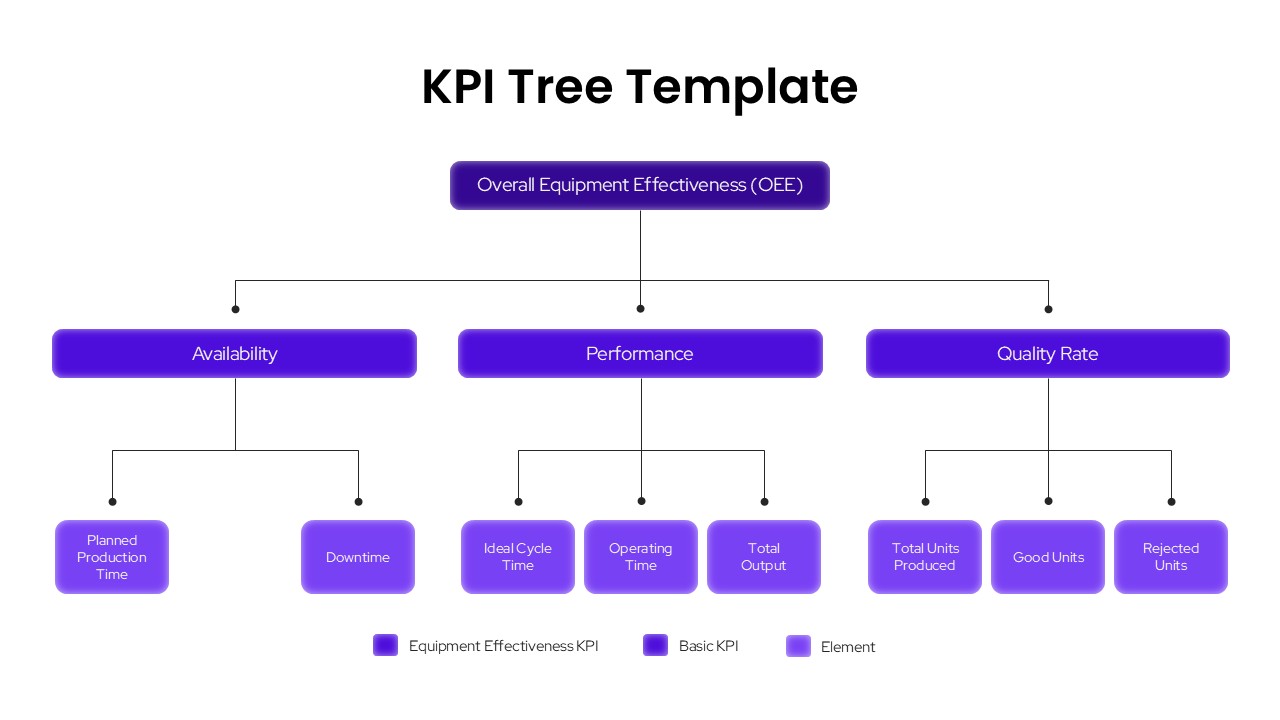
KPI Tree OEE Breakdown Template for PowerPoint & Google Slides
Infographics
-
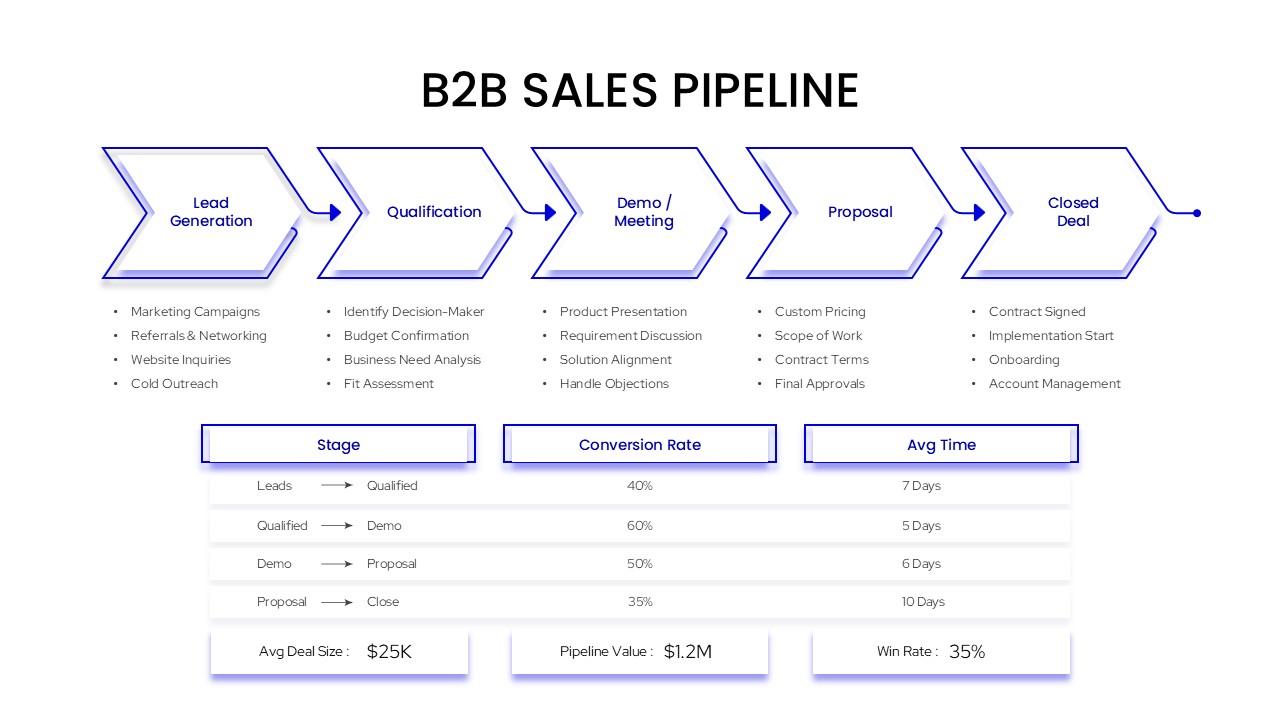
B2B Sales Pipeline Template for PowerPoint & Google Slides
Business Strategy
-
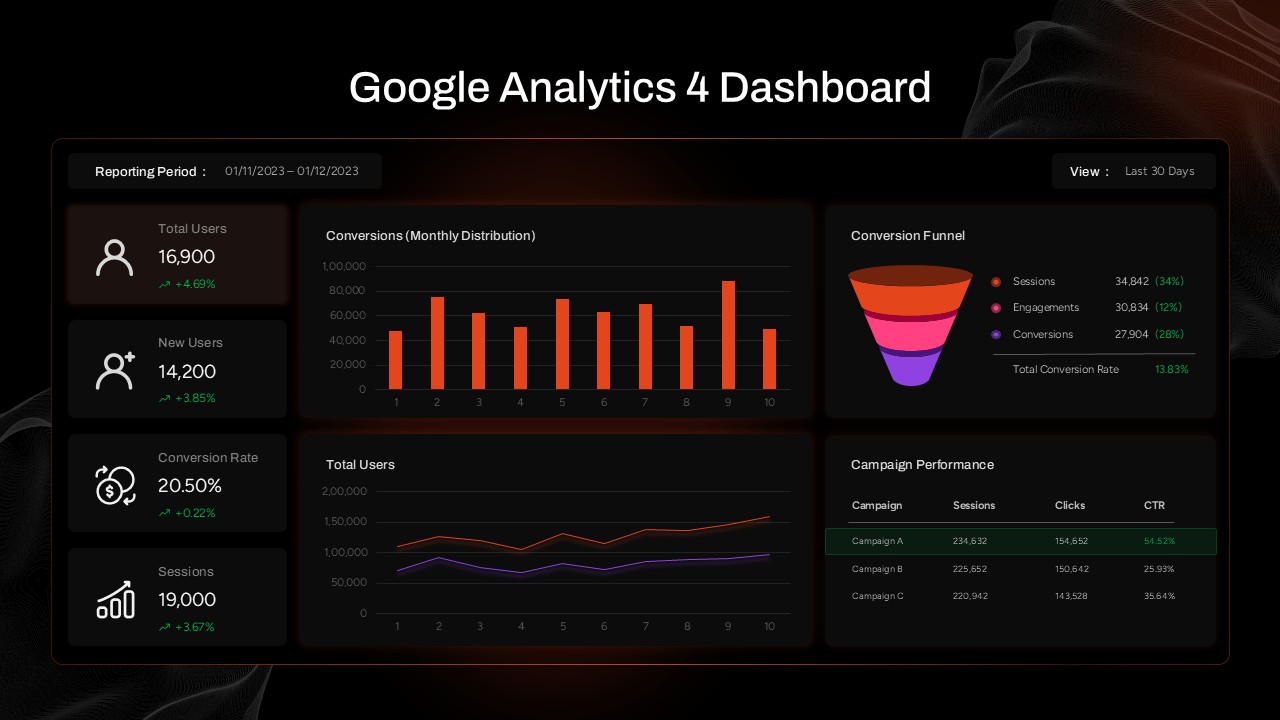
Google Analytics 4 (GA4) Dashboard Template for PowerPoint & Google Slides
Digital Marketing
-

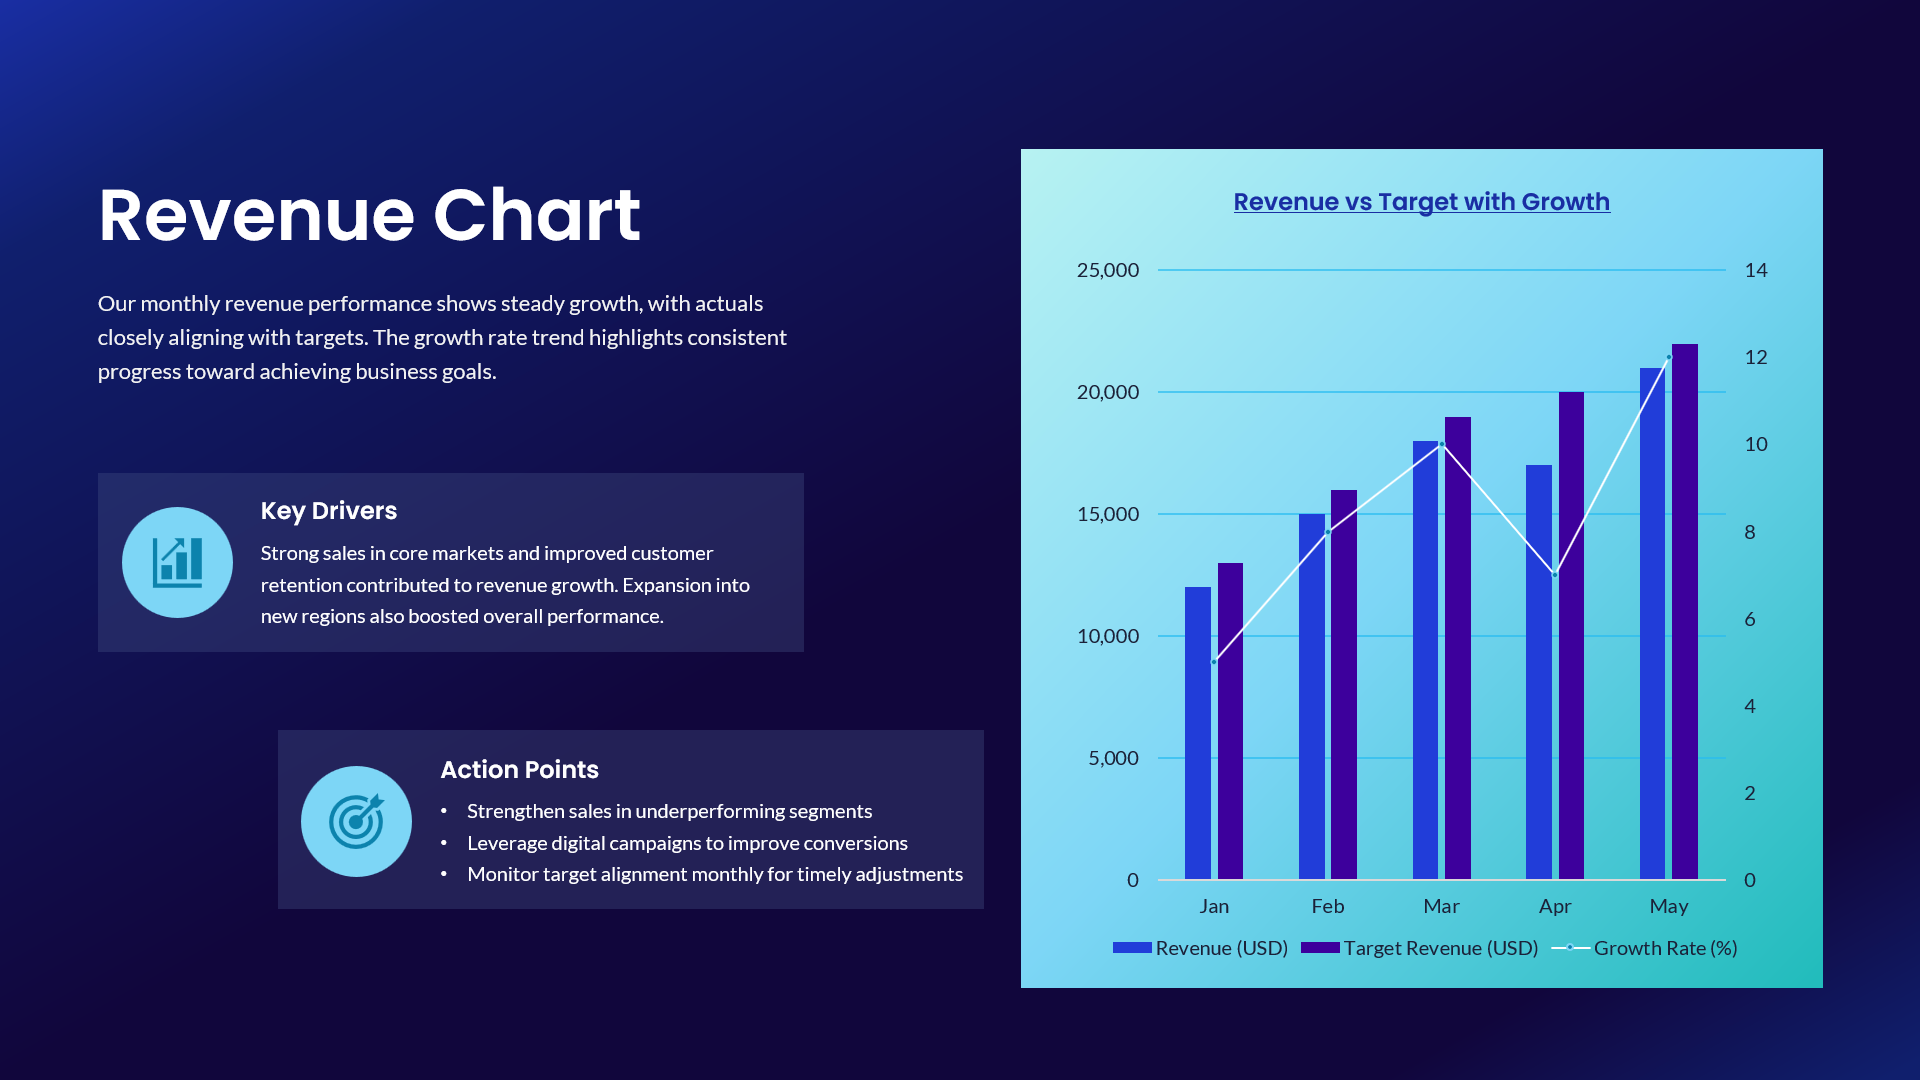
Revenue vs Target Growth Chart Template for PowerPoint & Google Slides
Revenue
-
4DX Scoreboard KPI Gauge Dashboard Template for PowerPoint & Google Slides
Business Strategy
-
Project Status Dashboard Template for PowerPoint & Google Slides
Project Status
-
End of Year Review Dashboard Template for PowerPoint & Google Slides
Business Report
-
Three Segment Donut Chart KPI Infographic Template for PowerPoint & Google Slides
Pie/Donut
-
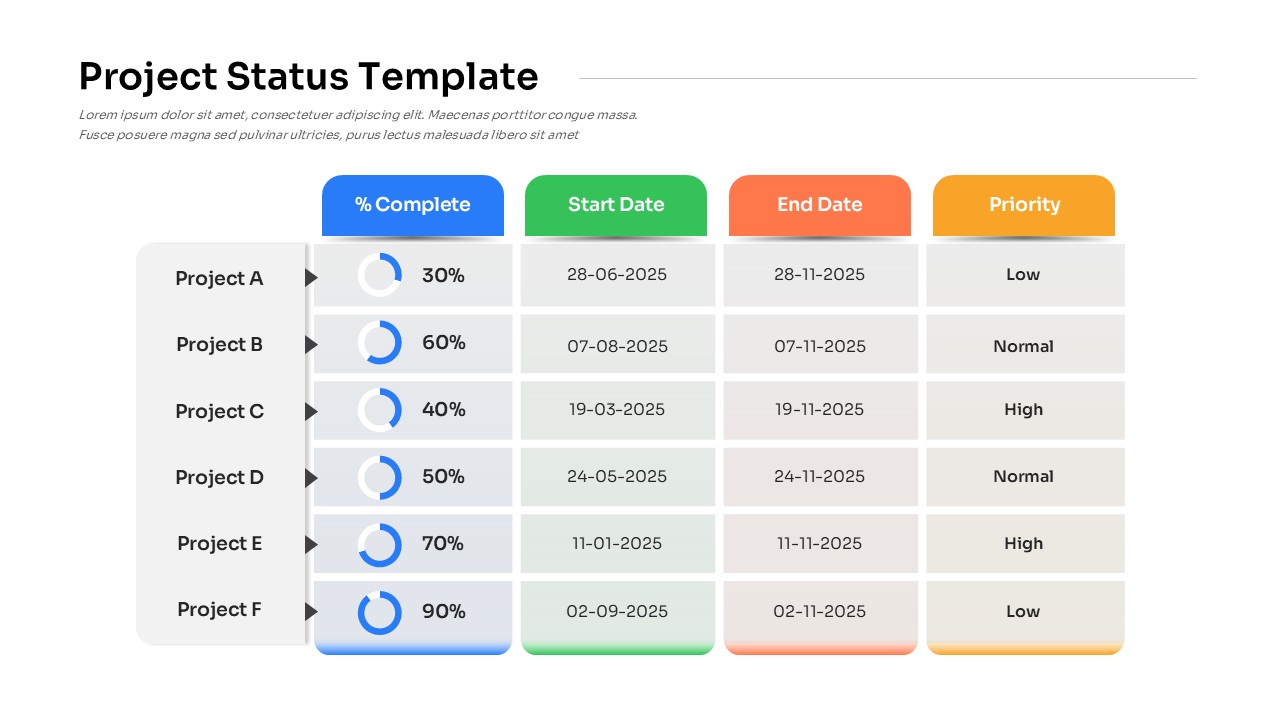
Project Status with Progress & Priority Template for PowerPoint & Google Slides
Table
-
Project Status Update Dashboard Table Template for PowerPoint & Google Slides
Project Status
-
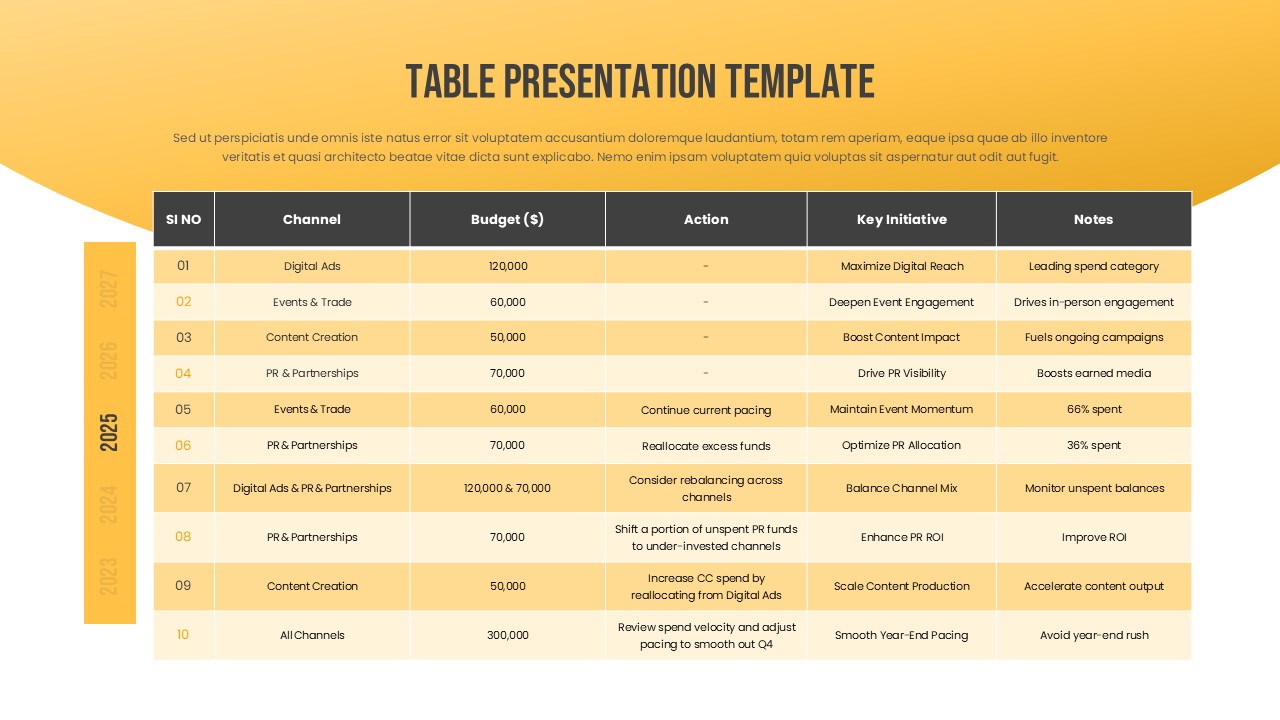
Marketing Budget Table Template for PowerPoint & Google Slides
Business
-
Team Goals Tracker Template for PowerPoint & Google Slides
Employee Performance