Kenya Map With counties Powerpoint and Keynote template


Description
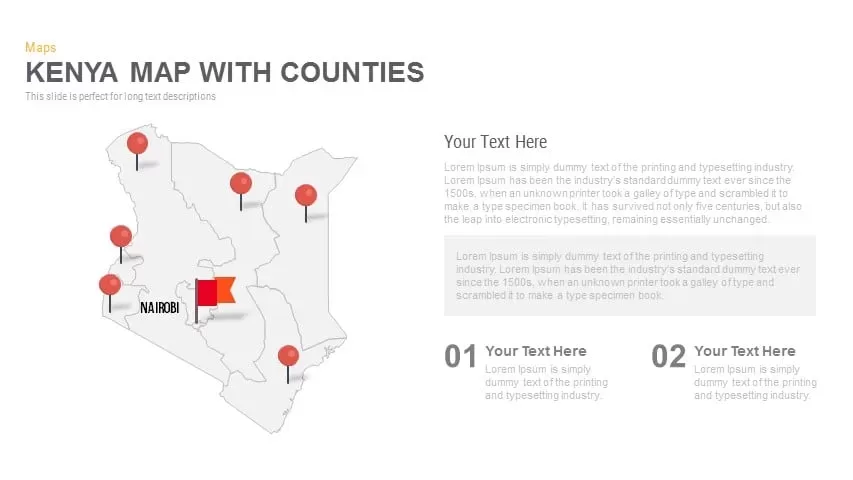
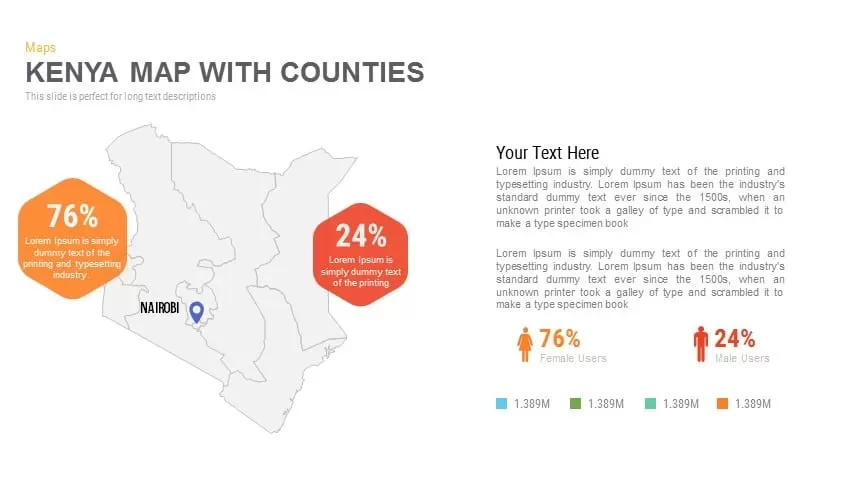
This dynamic slide set showcases a detailed map of Kenya, highlighting its counties, and is designed to present information such as demographic statistics, geographic distribution, and regional data. The map is centered around Nairobi, with clearly marked counties and customizable labels for each region. You can also integrate bar graphs, pie charts, or other relevant statistics to enrich the presentation. The minimalist design uses vibrant colors and icons to emphasize key data points, providing a professional, polished look suitable for a wide range of topics, including governmental reports, business analysis, or educational presentations.
Each slide in the pack comes with editable text boxes and placeholders, making it simple to add your specific data. The layout is optimized for both PowerPoint and Google Slides, ensuring full compatibility and smooth presentation on any device. Whether you are analyzing population data, displaying economic indicators, or presenting development statistics, this set makes presenting complex geographic data easy and engaging.
Who is it for
This template is ideal for professionals involved in regional planning, research, or business analysis in Kenya. Government officials, analysts, researchers, educators, and consultants can benefit from the map's detailed layout when discussing county-level statistics or geographical data. It is also useful for NGOs or development agencies that focus on regional assessments and planning.
Other Uses
Apart from geographic displays, this template can be adapted for market analysis, sales presentations, or socio-economic reports, particularly those focusing on Kenya. It's also useful for illustrating regional performance metrics, election results, or other region-specific statistics. This versatile slide set can be reused across various industries for data-driven storytelling.
Login to download this file


