search

Essentials

Must-have decks for quick wins

By Industry

Professionally tailored slides for every sector

By Style

Minimal, modern and creative designs

By Topic

Explore slides curated by purpose and theme

TimelineTimelineRoadmapRoadmapStrategyStrategyGoalsGoalsTableTableComparisonComparisonSWOTSWOTAgendaAgendaArrowArrowWorld MapWorld MapMapsMapsProcessProcessFunnelFunnelTeamTeamOrg ChartOrg ChartPyramidPyramidCircularCircular

Business PlanBusiness PlanBusiness StrategyBusiness StrategyBusiness ProposalBusiness ProposalBusiness ModelsBusiness ModelsDigital MarketingDigital MarketingMarketing FunnelMarketing FunnelCustomer ExperienceCustomer ExperienceProject StatusProject StatusGantt ChartGantt ChartRecruitmentRecruitmentEmployee PerformanceEmployee PerformanceLeadershipLeadershipAIAIMachine LearningMachine Learning

AI Presentation Maker

Install the Windows plugin for quick access to templates and design tools.

AI Infographics Maker

Use our Office 365 add - in to access templates directly from the cloud.

Exe Version

Install the Windows plugin for quick access to templates and design tools.

Office 365

Use our Office 365 add - in to access templates directly from the cloud.

Mac Version

Get the Mac plugin to easily browse, insert, and customize templates and visuals within PowerPoint.

Kentucky County Map PowerPoint Template
This template is part of a deck featuring multiple slides. To check out all slides, click on See All. See All round right arrow
Kentucky County Map PowerPoint Template featured image

Description

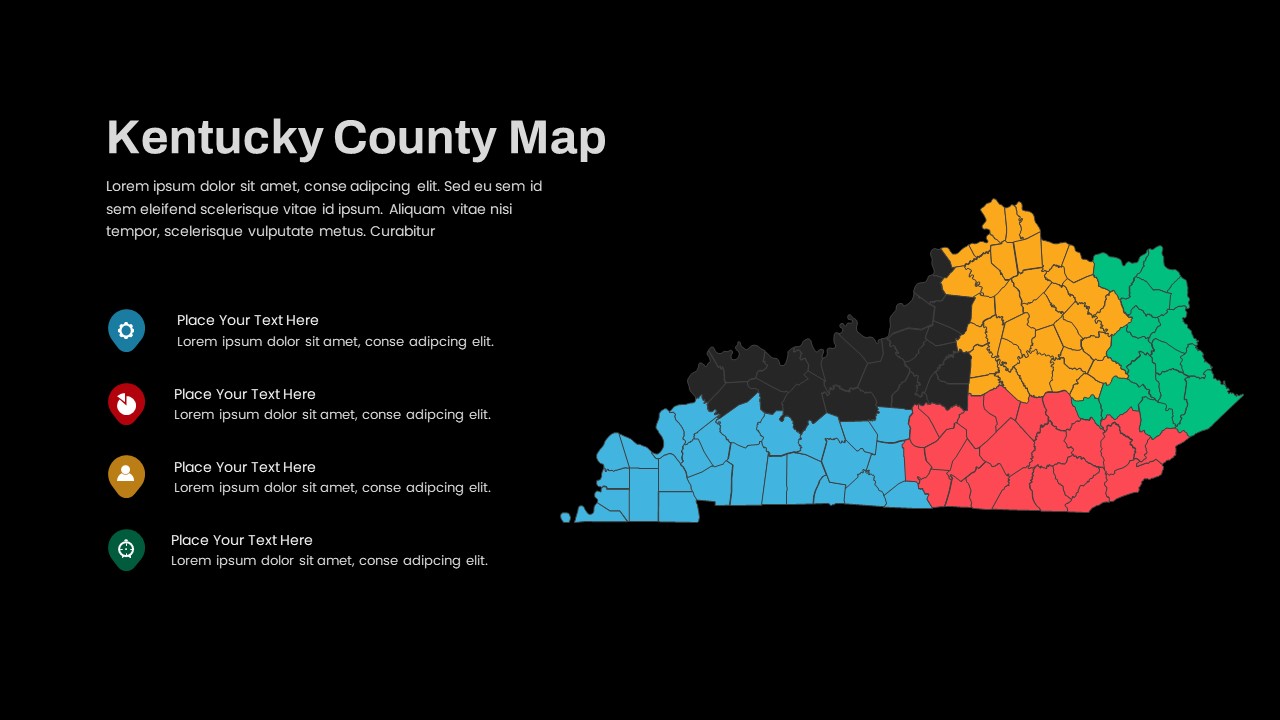
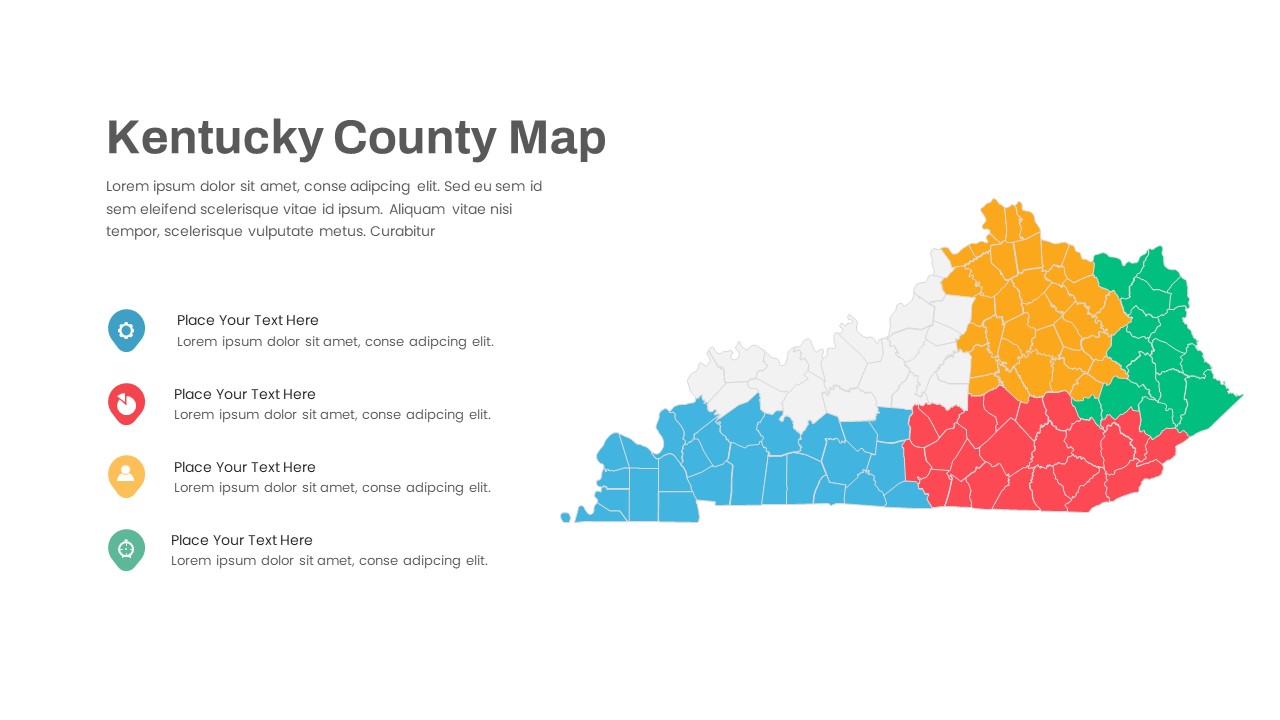
This Kentucky County Map Visualization Slide features a detailed outline of the state divided into county boundaries and color-coded into five distinct regions. Each region is filled with a bold hue—blue, red, green, yellow, and neutral gray for unhighlighted counties—creating instant visual segmentation. On the left, a vertical list of four circular icon placeholders aligned with text fields lets you call out key county-level insights, such as demographic data, resource metrics, or sales performance. Clean sans-serif headings, subtle connector lines, and generous white space ensure readability and a modern aesthetic, while an optional legend area can be toggled on or off to suit your storytelling needs.

Built on master slides for both PowerPoint and Google Slides, every element is fully editable: swap icons, adjust region colors, replace the map outline with custom shapes, modify placeholder text, and apply your brand fonts in seconds. Vector-based graphics maintain full-resolution clarity on large screens, and masked grouping preserves layout integrity when resizing. Pre-built color themes and icon sets let you align the design seamlessly with your corporate identity, while smart guides and alignment snaps guarantee pixel-perfect consistency across all slides.

Ideal for regional sales analysis, market segmentation, public policy presentations, and educational workshops, this slide accelerates your ability to communicate geographic data. Use it to highlight demographic trends, resource allocation, new branch locations, or emergency response planning. Duplicate the layout to create side-by-side comparisons of different states, export individual map sections for social media graphics, or integrate with other infographics to enrich dashboards. With customizable placeholders and coherent styling controls, you can maintain visual cohesion across an entire deck and eliminate version-control headaches between platforms.

Who is it for

Regional planners, sales managers, economic development teams, and government officials will benefit from this county map slide when presenting localized data and strategic insights. Marketing analysts, academic researchers, and nonprofit coordinators can also leverage its clear, color-coded regions for community outreach and reporting.

Other Uses

Repurpose this template to display electoral results, public health statistics, school district performance, or utility coverage. Adapt icon callouts to compare infrastructure projects, population density, tourism hotspots, or environmental impact zones, making it a versatile asset for any county-level presentation.