



















































K-Means Clustering Template
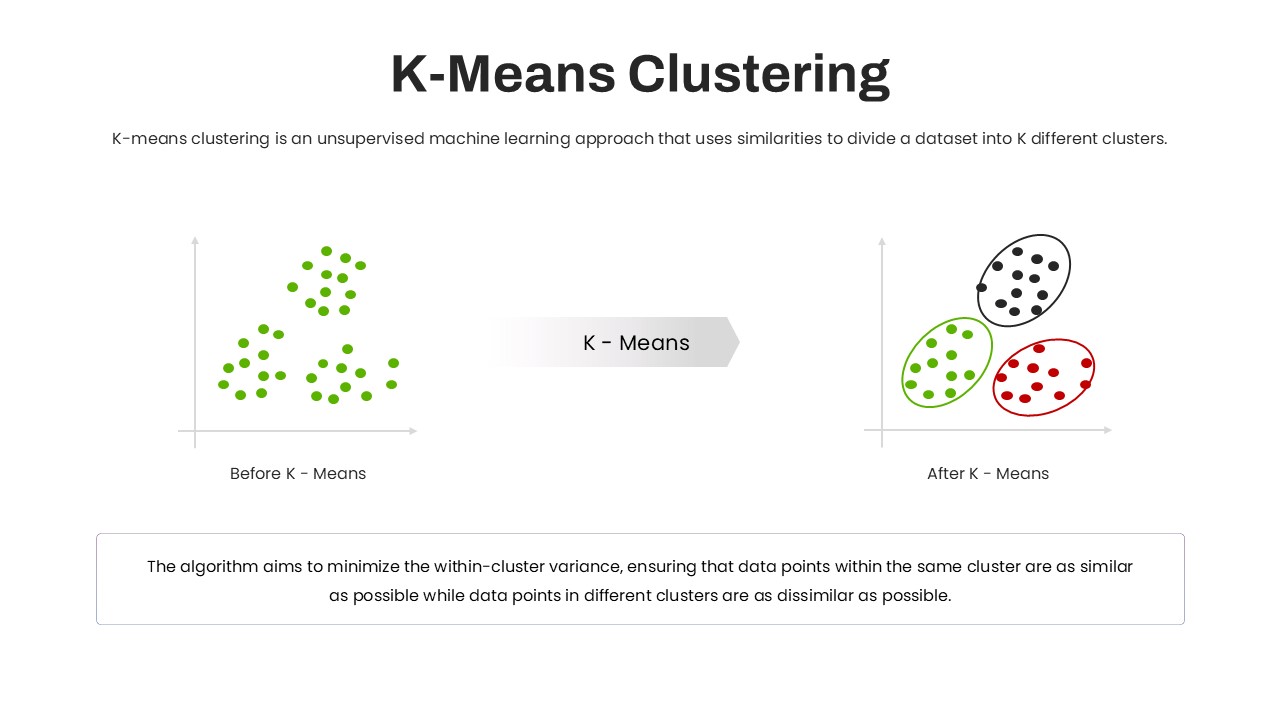
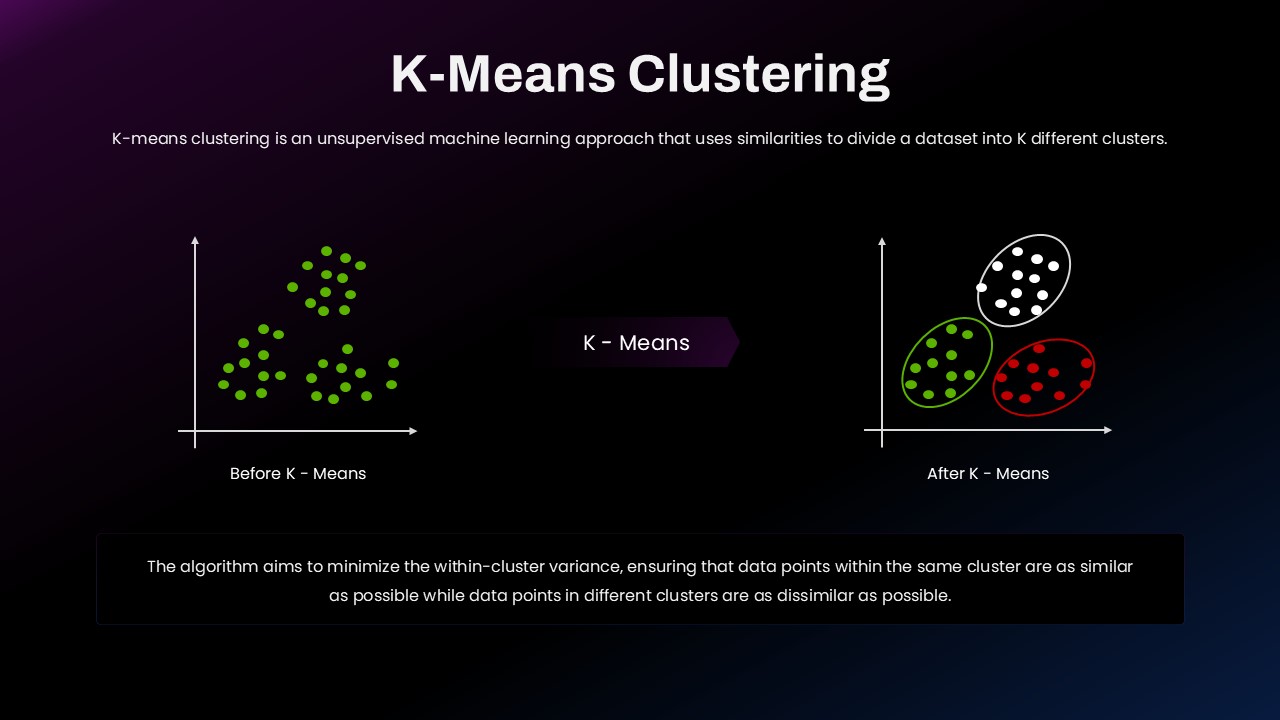
Turn complex K-Means Clustering concepts into an easy-to-follow visual story with a presentation template focused on data grouping, centroid calculation, and iterative optimization. It provides a practical way to explain how machine learning algorithms identify similarities and organize datasets into distinct clusters.
Explore the Algorithm Visually
Use the template to demonstrate the journey from an initial dataset to optimized cluster groups. Present how the algorithm selects centroids, measures distances between observations, assigns points to the closest cluster, and repeatedly updates centroid positions until the groups stabilize.
Highlight the Analytical Workflow
- Input Data – Introduce the dataset and relevant variables.
- Cluster Selection – Define the required number of groups or K value.
- Assignment – Allocate data points according to their nearest centroid.
- Centroid Update – Recalculate the center of each cluster.
- Iteration – Repeat the process to improve cluster assignments.
- Final Segmentation – Interpret the resulting groups and insights.
Turn Clustering Into Business Insights
The K-Means Clustering Template can support presentations on customer segmentation, market research, behavioral analysis, pattern discovery, recommendation systems, image analysis, and business intelligence. It is also useful for explaining unsupervised machine learning and data science workflows in academic and professional settings.
Ready for PowerPoint & Google Slides
Customize cluster labels, diagrams, data points, colors, and explanatory text to match your analysis. The editable design works well for machine learning presentations, AI projects, research reports, classroom lessons, and data-driven business presentations.
Login to download this file

Item ID
SB05012


