Japan Map With Prefectures Powerpoint and Keynote template 1


Description
This six-slide map pack of Japan provinces provides a versatile toolkit for illustrating regional data, locations, and key metrics across the archipelago. Slide variations include:
Pinpoint Overview: A clean outline map with customizable pin markers and a bold Tokyo flag icon—perfect for highlighting major cities or facilities.
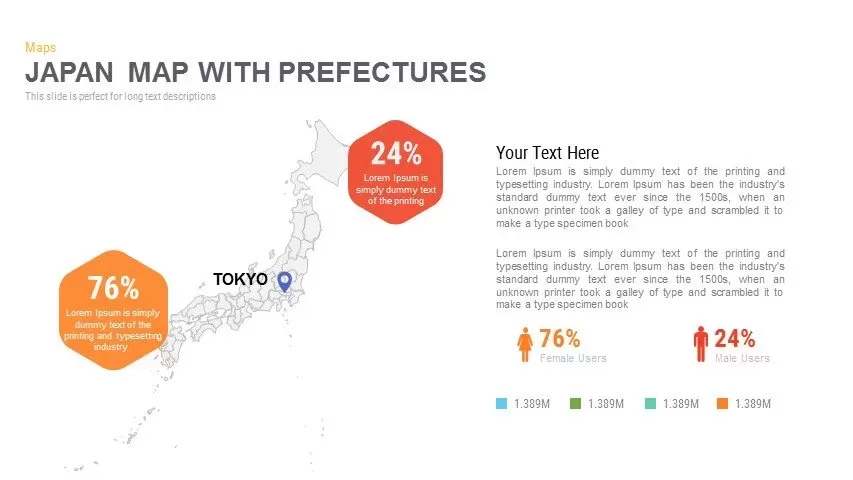
Hexagon Callouts: Dual hexagon badges (e.g., 76%/24%) anchored to Hokkaido and Kyushu for visualizing demographic splits or survey results, paired with gender icons and color-coded data legends.
Multi-Pin Map with Bar Chart: Five colored pins linked to a bar chart—ideal for monthly sales, regional KPIs, or resource allocation comparisons.
Flag & Dual Text Panels: A Jakarta-style flag marker at Tokyo with two numbered text entries for succinct bullet points or timeline notes.
Side-By-Side Chart View: A horizontal map with a left-side bar graph and a large Tokyo pin—enabling side-by-side narrative and data visualization.
Magnified Callout Panel: Colorful pin markers around the map and a large magnifier-style callout box for in-depth commentary, charts, or infographics.
All slides use fully editable vector shapes on master layouts. Swap pin icons, adjust callout shapes and colors, update chart data, and edit text in seconds. The minimalist grey map outline and generous white space ensure your markers and data shine through. Modern sans-serif typography and consistent color accents deliver professional polish, while pre-built reveal animations guide audiences step by step. Fully compatible with PowerPoint and Google Slides, this pack scales flawlessly for screens or printed reports.
Who is it for
Sales directors, regional managers, market analysts, and logistics planners will benefit from these slides when presenting territory performance, expansion strategies, or demographic research in Japan.
Other Uses
Repurpose for supply-chain mapping, tourism highlights, site-selection analyses, or public-health resource distribution by simply swapping icons, recoloring pins, or switching chart types.
Login to download this file


