search

Essentials

Must-have decks for quick wins

By Industry

Professionally tailored slides for every sector

By Style

Minimal, modern and creative designs

By Topic

Explore slides curated by purpose and theme

TimelineTimelineRoadmapRoadmapStrategyStrategyGoalsGoalsTableTableComparisonComparisonSWOTSWOTAgendaAgendaArrowArrowWorld MapWorld MapMapsMapsProcessProcessFunnelFunnelTeamTeamOrg ChartOrg ChartPyramidPyramidCircularCircular

Business PlanBusiness PlanBusiness StrategyBusiness StrategyBusiness ProposalBusiness ProposalBusiness ModelsBusiness ModelsDigital MarketingDigital MarketingMarketing FunnelMarketing FunnelCustomer ExperienceCustomer ExperienceProject StatusProject StatusGantt ChartGantt ChartRecruitmentRecruitmentEmployee PerformanceEmployee PerformanceLeadershipLeadershipAIAIMachine LearningMachine Learning

AI Presentation Maker

Install the Windows plugin for quick access to templates and design tools.

AI Infographics Maker

Use our Office 365 add - in to access templates directly from the cloud.

Exe Version

Install the Windows plugin for quick access to templates and design tools.

Office 365

Use our Office 365 add - in to access templates directly from the cloud.

Mac Version

Get the Mac plugin to easily browse, insert, and customize templates and visuals within PowerPoint.

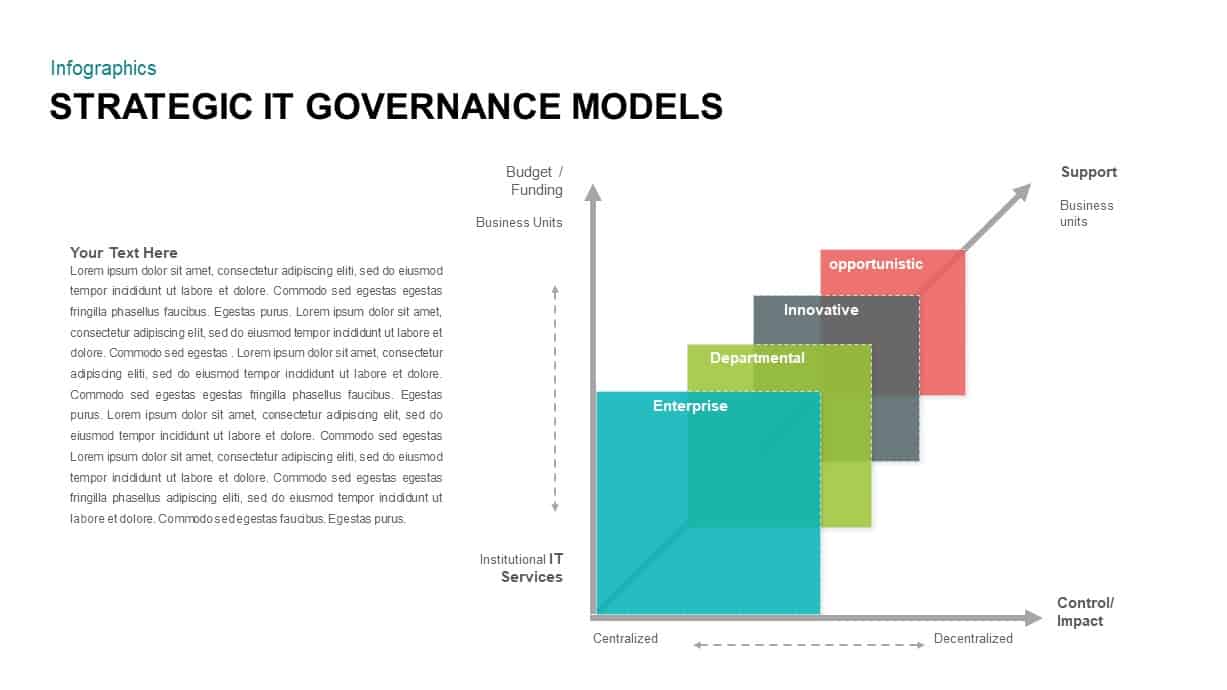
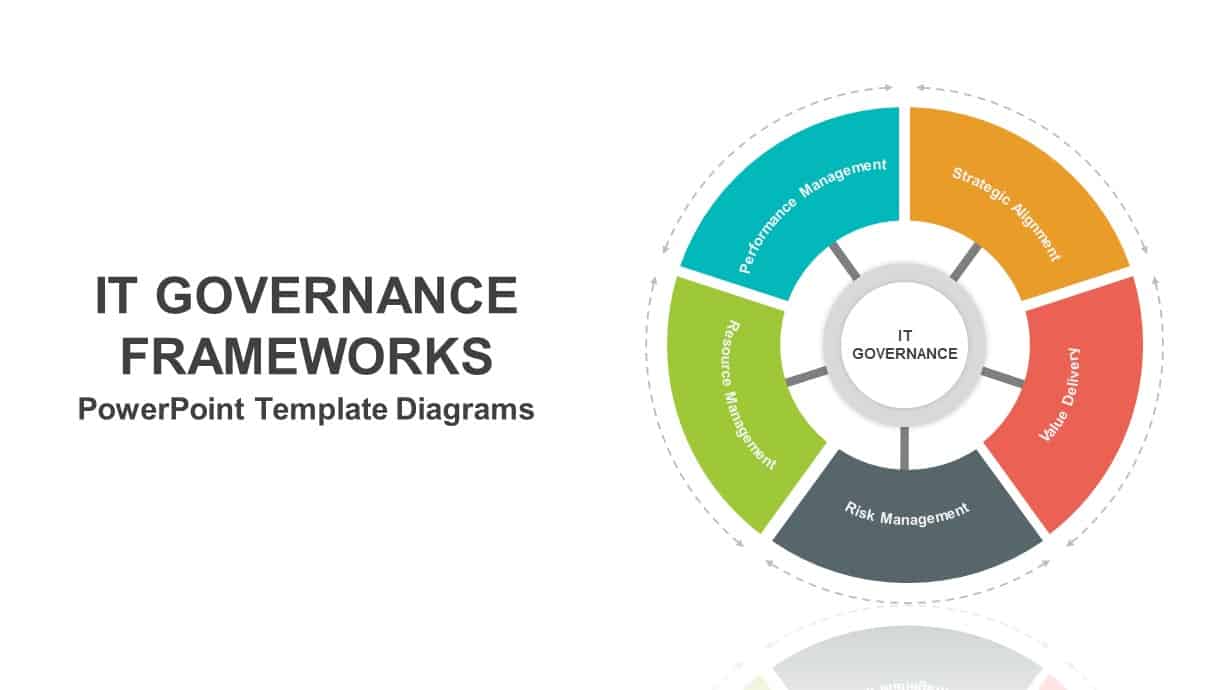
Strategic IT Governance Framework Models PowerPoint Template 7

This template is part of a deck featuring multiple slides. To check out all slides, click on See All. See All round right arrow
IT Governance Frameworks PowerPoint Template

Description

Leverage this all-in-one IT Governance Frameworks deck to present modern governance models with clarity and visual impact. The master slide includes:

  • A five-segment circular diagram for core domains—Strategic Alignment (gold), Value Delivery (coral), Risk Management (charcoal), Resource Management (lime), and Performance Management (teal)—with dashed outer arrows to show continuous improvement.

  • A three-ring COBIT cycle highlighting Program Management (red), Change Enablement (gray), and Continual Improvement (green), complete with callouts and a full-width text panel.

  • A 3D staircase chart comparing Enterprise (cyan), Departmental (lime), Innovative (slate), and Opportunistic (salmon) governance models along Control/Impact and Funding axes.

  • A layered ITIL cycle with concentric service strategy, design, transition, operation, and continual improvement rings in dark gray, green, and blue gradients.

  • A five-level CMMI bar chart in ascending cyan, lime, slate, red, and orange columns, mapping maturity from Initial to Optimizing.

  • A FAIR risk-analysis tree diagram showing Risk broken into Loss Event Frequency and Loss Magnitude—each with nested nodes for Threat Event Frequency, Vulnerability, Primary Loss, and Secondary Risk.

  • A COSO cube with eight horizontal layers (Monitoring, Information & Communication, Control Activities, Risk Response, Risk Assessment, Event Identification, Objective Setting, Internal Environment) intersecting four vertical perspectives (Strategic, Operations, Reporting, Compliance).

Built on smart guides and theme-color integration, every shape, color, and icon is fully editable in PowerPoint and Google Slides. Swap gradients, adjust segment counts, or update text blocks without rebuilding shapes. Use progressive animations to reveal each framework step-by-step or display the full diagram at once. Export individual slides as standalone infographics, duplicate layouts to compare scenarios side-by-side, and customize axis labels to suit any governance discussion.

Who is it for

IT directors, CIOs, risk managers, compliance officers, enterprise architects, and consultants who need to illustrate and compare multiple governance frameworks—COBIT, ITIL, CMMI, FAIR, and COSO—in executive briefings, workshops, or board presentations.

Other Uses

Repurpose these layouts for audit roadmaps, maturity assessments, risk-management workshops, compliance training, service-management reviews, or any context requiring side-by-side framework comparisons.