Block Diagram Template Dark


Description
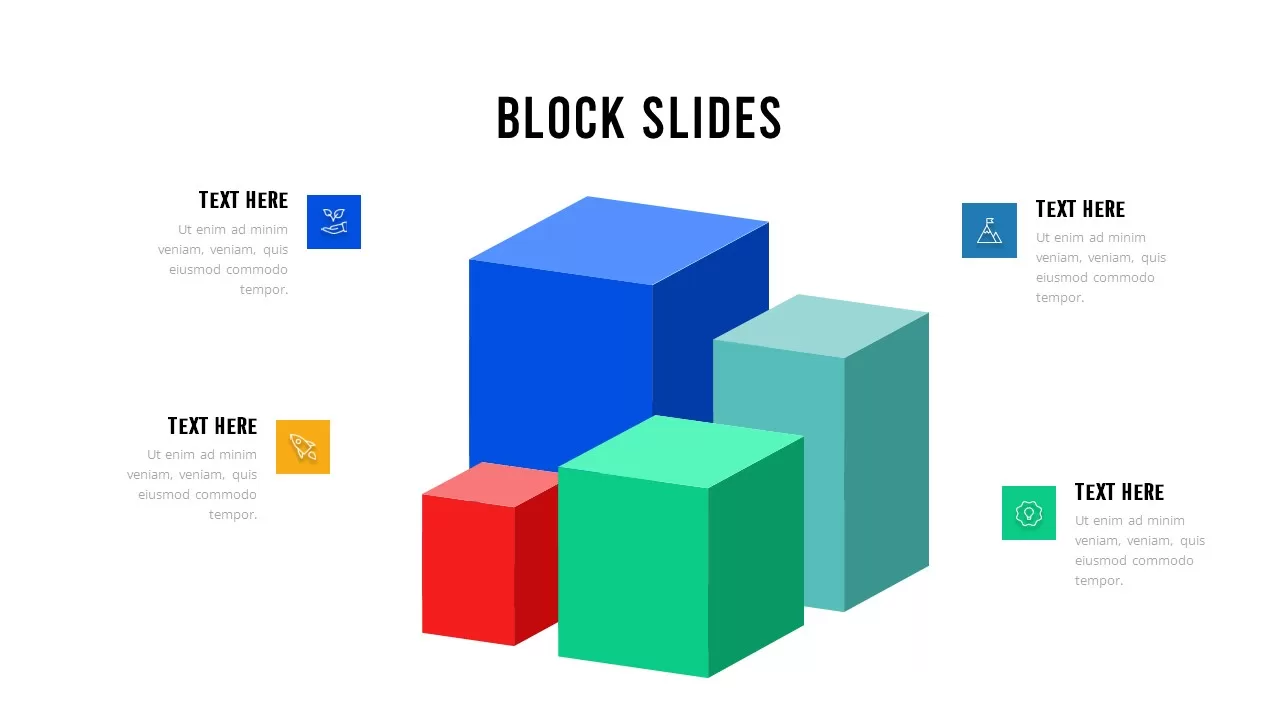
Use this four-stage isometric block infographic slide to illustrate hierarchical processes, stepwise progressions, or comparative data visualizations in PowerPoint & Google Slides. The design features four three-dimensional blocks of varying height and color—vivid red, green, teal, and blue—resting on a subtle reflective plane. Each block aligns with a matching square icon callout and text panel on alternating sides, creating visual balance while anchoring your key messages. The isometric perspective, crisp edges, and realistic drop shadows deliver depth and dimensionality, transforming complex information into an engaging, digestible format. Generous white space and clean sans-serif typography ensure readability across virtual meetings, large-venue projections, and web-based editors.
Built on fully editable slide masters with vector shapes and alignment guides, this template empowers you to adjust block sizes, swap icons, update text placeholders, and recolor elements in seconds—no design skills required. You can reorder the blocks to reflect priority levels, change the color palette to match corporate branding, or convert the layout into a visual timeline by ordering blocks chronologically. Integrated theme controls let you apply brand fonts and color schemes globally across your presentation, maintaining consistency and saving time. Optional entrance animations create sequential reveals of each block and callout, preserving narrative flow and audience focus. Pixel-perfect in resolution, this slide adapts seamlessly to any screen size, ensuring professional polish whether you’re presenting in a boardroom or broadcasting online.
Who is it for
Product Managers, Marketing Leaders, Strategy Consultants, and Training Facilitators will find this isometric block infographic ideal for mapping project roadmaps, feature rollouts, service tier overviews, or change-management stages. Project teams can also use it to highlight milestones and performance tiers during stakeholder briefings.
Other Uses
Beyond process mapping, repurpose this layout for layered SWOT categories, maturity models, organizational charts, or product comparisons. Duplicate or recolor blocks to illustrate parallel workflows, vendor assessments, or quarterly roadmap overviews—making this template a versatile asset for diverse presentation needs.
Login to download this file


