search

Essentials

Must-have decks for quick wins

By Industry

Professionally tailored slides for every sector

By Style

Minimal, modern and creative designs

By Topic

Explore slides curated by purpose and theme

TimelineTimelineRoadmapRoadmapStrategyStrategyGoalsGoalsTableTableComparisonComparisonSWOTSWOTAgendaAgendaArrowArrowWorld MapWorld MapMapsMapsProcessProcessFunnelFunnelTeamTeamOrg ChartOrg ChartPyramidPyramidCircularCircular

Business PlanBusiness PlanBusiness StrategyBusiness StrategyBusiness ProposalBusiness ProposalBusiness ModelsBusiness ModelsDigital MarketingDigital MarketingMarketing FunnelMarketing FunnelCustomer ExperienceCustomer ExperienceProject StatusProject StatusGantt ChartGantt ChartRecruitmentRecruitmentEmployee PerformanceEmployee PerformanceLeadershipLeadershipAIAIMachine LearningMachine Learning

AI Presentation Maker

Install the Windows plugin for quick access to templates and design tools.

AI Infographics Maker

Use our Office 365 add - in to access templates directly from the cloud.

Exe Version

Install the Windows plugin for quick access to templates and design tools.

Office 365

Use our Office 365 add - in to access templates directly from the cloud.

Mac Version

Get the Mac plugin to easily browse, insert, and customize templates and visuals within PowerPoint.

This template is part of a deck featuring multiple slides. To check out all slides, click on See All. See All round right arrow
Costa Rica Map

Description

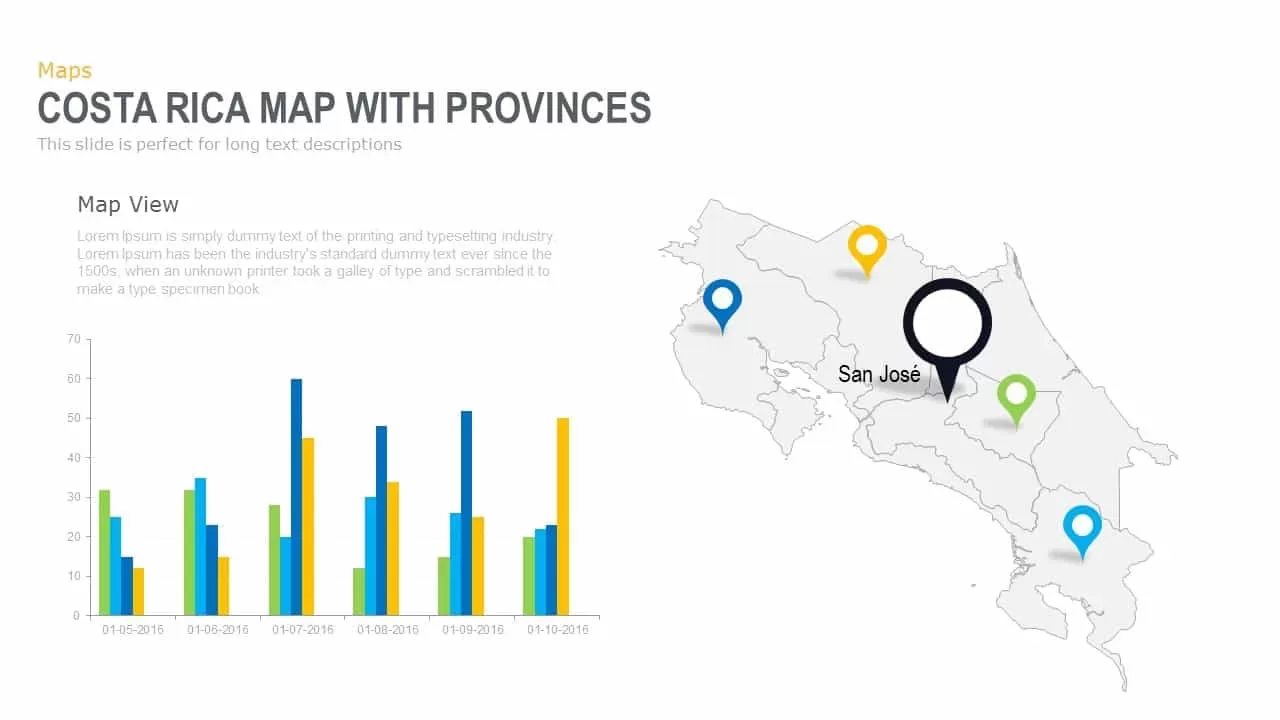
Leverage this comprehensive Costa Rica map slide to pinpoint provincial insights, strategic locations, and data-driven narratives with precision and visual clarity. At the core, a detailed grayscale vector map of Costa Rica delineates province boundaries and island territories, providing geographic context without distraction. Vibrant red location pins mark key areas, each connected via slender callout lines to numbered labels that guide audience attention. A distinctive flag icon highlights the capital province of San José, ensuring immediate orientation to the nation’s administrative center. Bordering the map, semi-transparent gradient arrows suggest carousel navigation or step-by-step walkthroughs, enhancing interactivity in any presentation format.

To the right, a large text placeholder accommodates long-form explanations, statistical summaries, or strategic commentary, while two numbered text boxes below offer structured space for bullet-point highlights or sequential insights. The slide’s clean white background and minimalist typography maintain focus on your content, and subtle gridlines support precise alignment without clutter.

Built on master slide layouts, every element is fully editable: adjust pin colors to reflect thematic categories, reposition markers to match evolving data sets, rename provinces with a single click, and modify callout paths to fit custom narratives. Vector-based assets guarantee pixel-perfect clarity on both PowerPoint and Google Slides, eliminating formatting headaches and version-control issues. Intuitive placeholders and layout guides accelerate collaboration, allowing teams to update content swiftly while preserving design integrity.

Whether you’re presenting market-entry analyses, sales territory performance, demographic studies, or logistics planning, this Costa Rica map template streamlines complex regional data into a single, cohesive visual asset. Duplicate slides to compare temporal trends, expand callouts for detailed reports, or repurpose markers for customer clusters, distribution centers, or project sites. Engage stakeholders with location-driven stories that resonate—this template offers the flexibility and professional polish needed to deliver impactful presentations with minimal effort.

Who is it for

Market researchers, sales managers, logistics planners, and regional strategists will leverage this Costa Rica map slide to showcase territory performance, customer distribution, or expansion plans in stakeholder meetings, board presentations, or client pitches.

Other Uses

Repurpose this template for travel itineraries, demographic analyses, supply-chain visualizations, or educational lectures. Replace marker icons to denote warehouses, retail outlets, or service centers, and customize callouts to display KPIs, timelines, or risk assessments.

Login to download this file

Add to favorites

Add to collection