Instagram Infographic Slide

Description
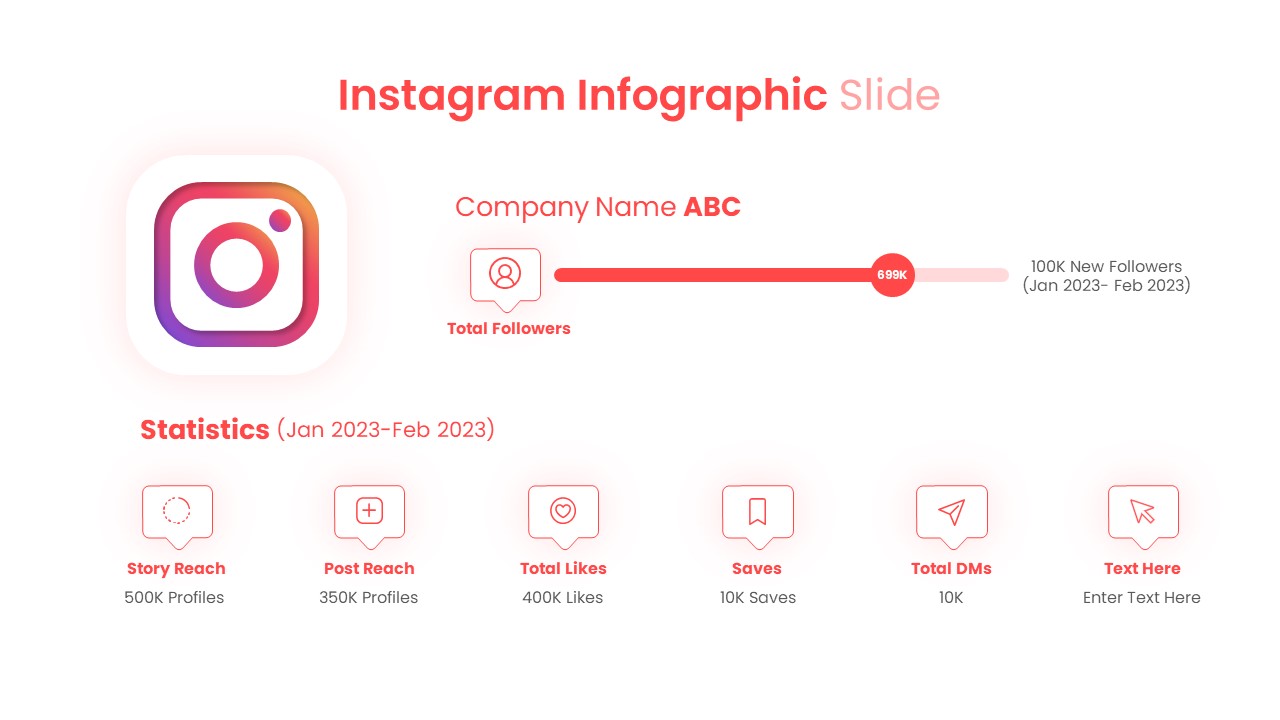
Turn your Instagram performance data into a compelling visual narrative with this clean Infographic Metrics slide template for PowerPoint & Google Slides. Centered around a glowing Instagram icon, this design uses a white background and coral-pink accents to highlight key metrics at a glance. The top section features a horizontal progress bar for Total Followers, complete with a bold data point and space for a “New Followers” callout. Below, six icon-anchored statistic panels display Story Reach, Post Reach, Total Likes, Saves, DMs, and an editable metric slot—all aligned in a single row for effortless comparison.
Each element is fully editable via the master slide: swap in your own numbers, replace icons, or adjust the coral hue to match your brand palette. Vector-based icons ensure sharp visuals on any screen, while generous white space keeps focus on your data. Whether you’re reporting campaign results, pitching social strategies, or showcasing quarterly dashboards, this single-slide asset streamlines your workflow and keeps audiences engaged.
Who is it for
Social media managers, digital marketers, and analytics teams will benefit from this Instagram infographic slide when reporting follower growth, engagement metrics, and content performance. Agencies and consultants can use it to deliver stunning client updates and strategy recommendations.
Other Uses
Beyond Instagram, repurpose this layout for Facebook, Twitter, or LinkedIn dashboards; illustrate email campaign results; compare product feature usage; or present key performance indicators in executive summaries and boardroom briefings.
Login to download this file


