factor-analysis-of-information-risk-template-powerpoint-google-slides


Description
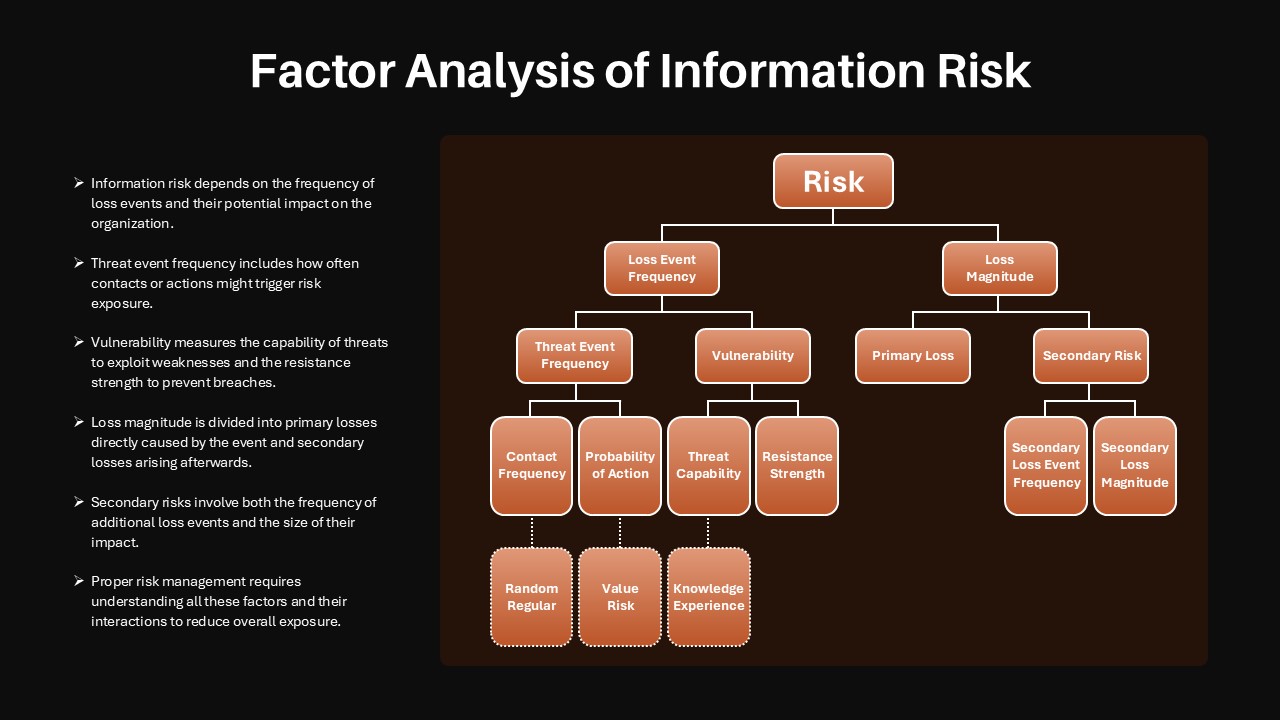
Use this factor analysis slide to break down information risk into its fundamental drivers—frequency and magnitude—in one cohesive tree diagram. At the top, the central “Risk” node splits into two primary branches: Loss Event Frequency and Loss Magnitude. The frequency branch subdivides into Threat Event Frequency and Vulnerability, with deeper layers for Contact Frequency (and its random vs. regular occurrences), Probability of Action (and its value-at-risk considerations), Threat Capability, and Resistance Strength. The magnitude branch highlights Primary Loss and Secondary Risk, the latter further dissected into Secondary Loss Event Frequency and Secondary Loss Magnitude. Dashed subnodes offer space to annotate supporting factors like knowledge, experience, or event variability.
Built on master slides with intuitive placeholders, this template accelerates customization in both PowerPoint and Google Slides. Simply swap labels to match your organization’s terminology, adjust node colors to align with your corporate palette, or duplicate subbranches to model additional risk factors without disrupting alignment. Grouped shapes and connector lines maintain pixel-perfect positioning, letting you focus on refining your risk definitions instead of wrestling with slide layouts. You can also annotate the diagram with metrics, probabilities, or policy references to enhance context and align on action plans.
Engineered for risk reviews, audit workshops, and governance discussions, this factor-analysis diagram enables stakeholders to explore interaction effects and target mitigation strategies with clarity. Highlight how improved resistance strength offsets high threat capability, or demonstrate how reducing contact frequency lowers secondary risks. With its linear, layered structure, this slide fosters data-driven conversations and supports quantitative risk modeling, making it an indispensable asset for comprehensive risk management.
Who is it for
Risk managers, compliance officers, audit teams, and enterprise risk committees will benefit from this slide when mapping threat exposures, assessing vulnerability, or presenting loss-magnitude scenarios to executives.
Other Uses
Repurpose this layout for failure-mode analysis, process-control frameworks, or root-cause investigations by relabeling nodes to reflect your specific risk taxonomy or control checkpoints.
Login to download this file


