Infographics Presentation Templates for PowerPoint and Google Slides
![]() Filter
Filter
Filter
-
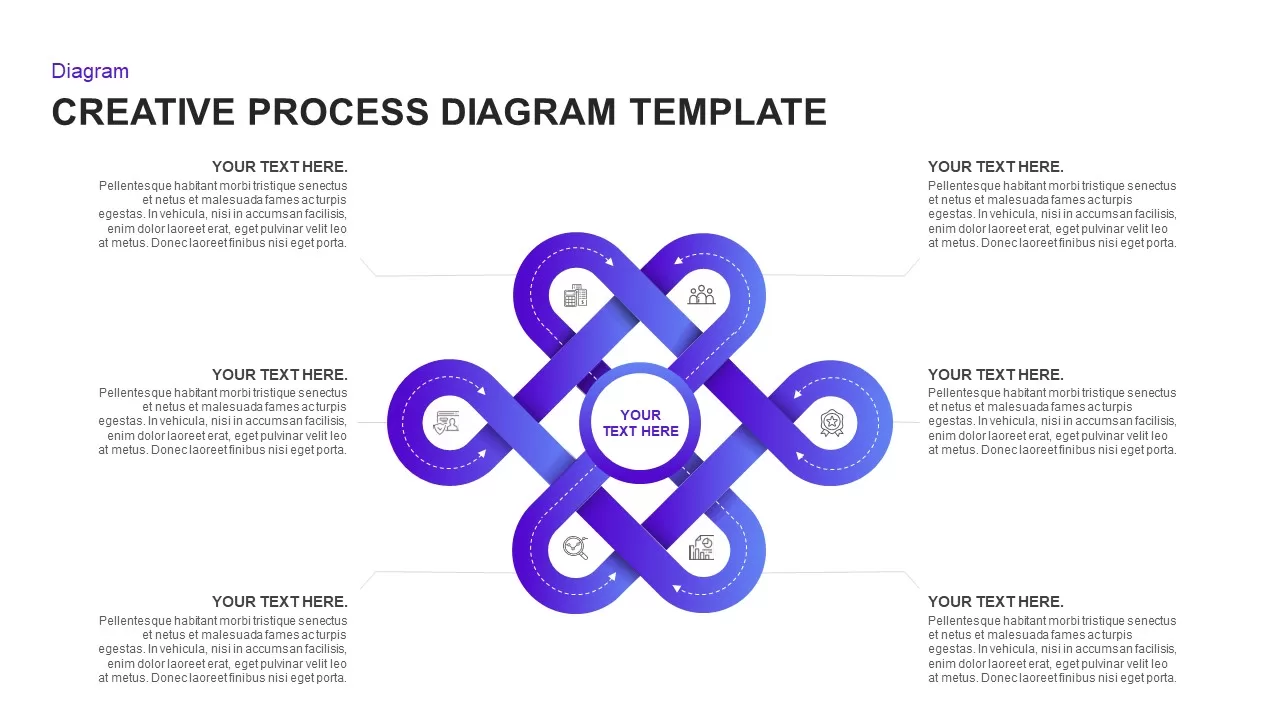
Creative Infinity Loop Process Diagram Template for PowerPoint & Google Slides
Process
-
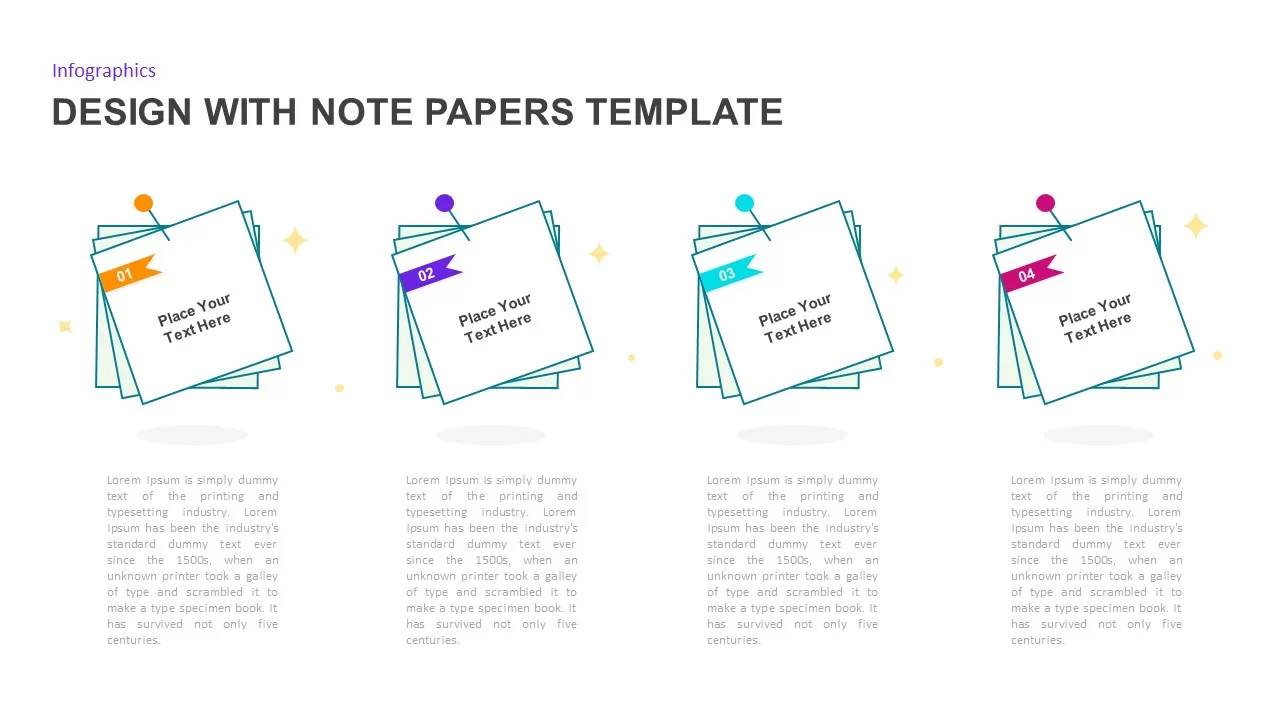
Pinnable Note-Paper Process Infographic Template for PowerPoint & Google Slides
Process
-
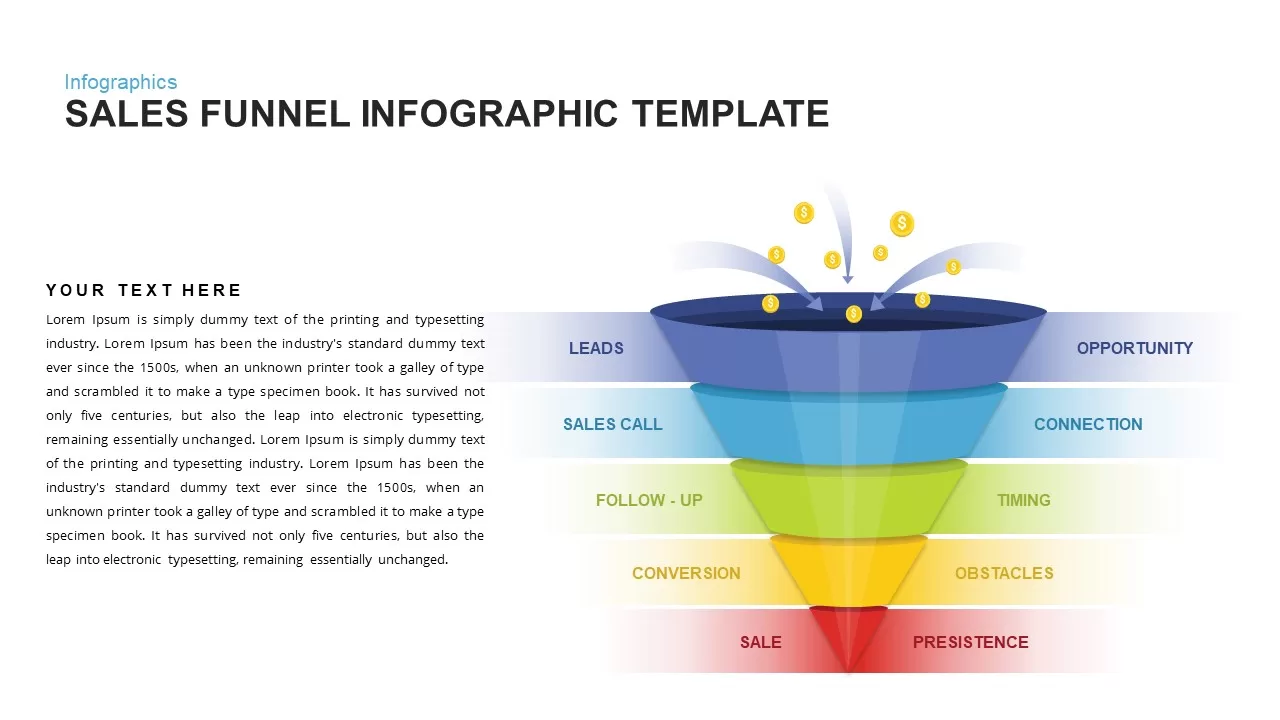
Sales Funnel Infographic Diagram Template for PowerPoint & Google Slides
Funnel
-
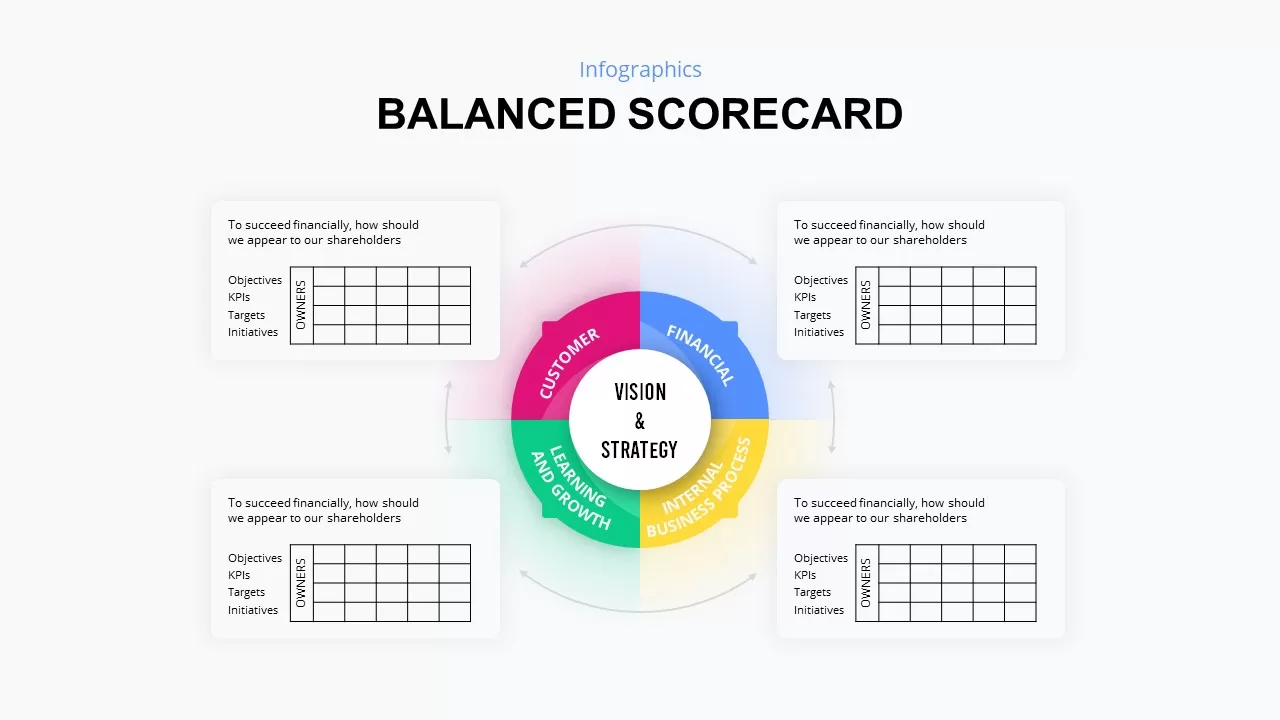
Circular Balanced Scorecard Infographic Template for PowerPoint & Google Slides
Business Strategy
-
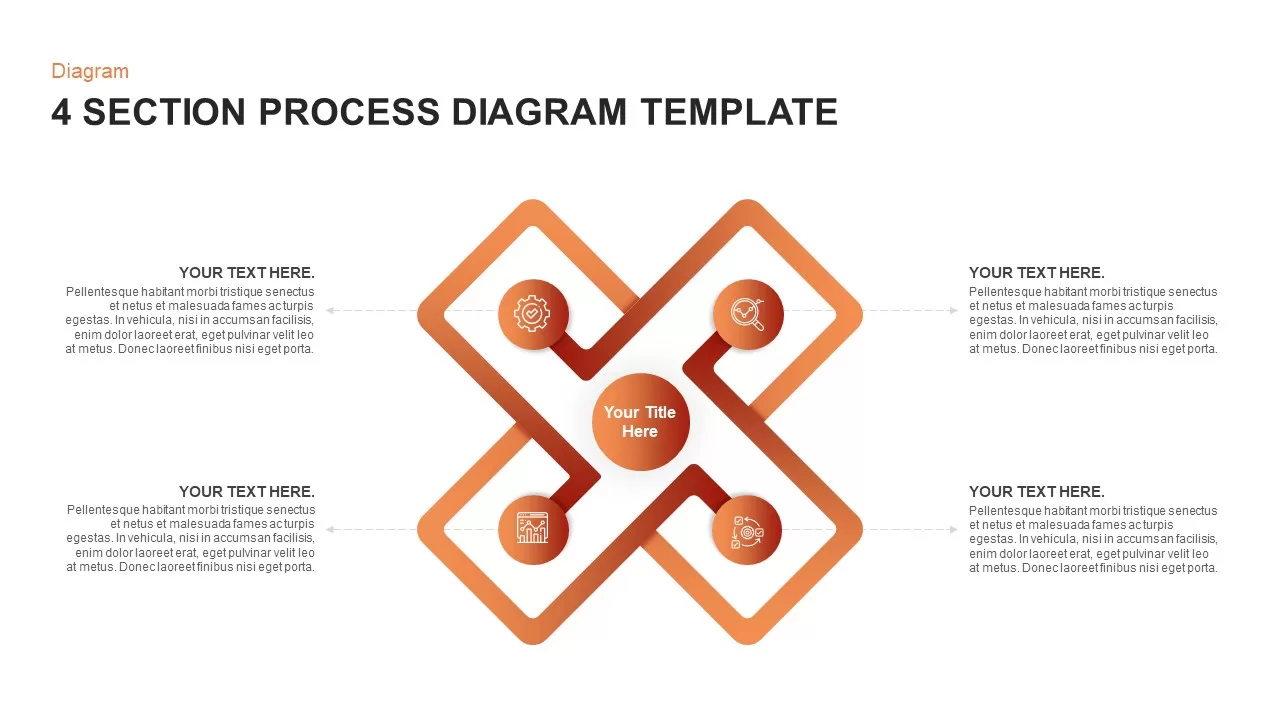
Modern 4 Section Process Diagram Template for PowerPoint & Google Slides
Process
-
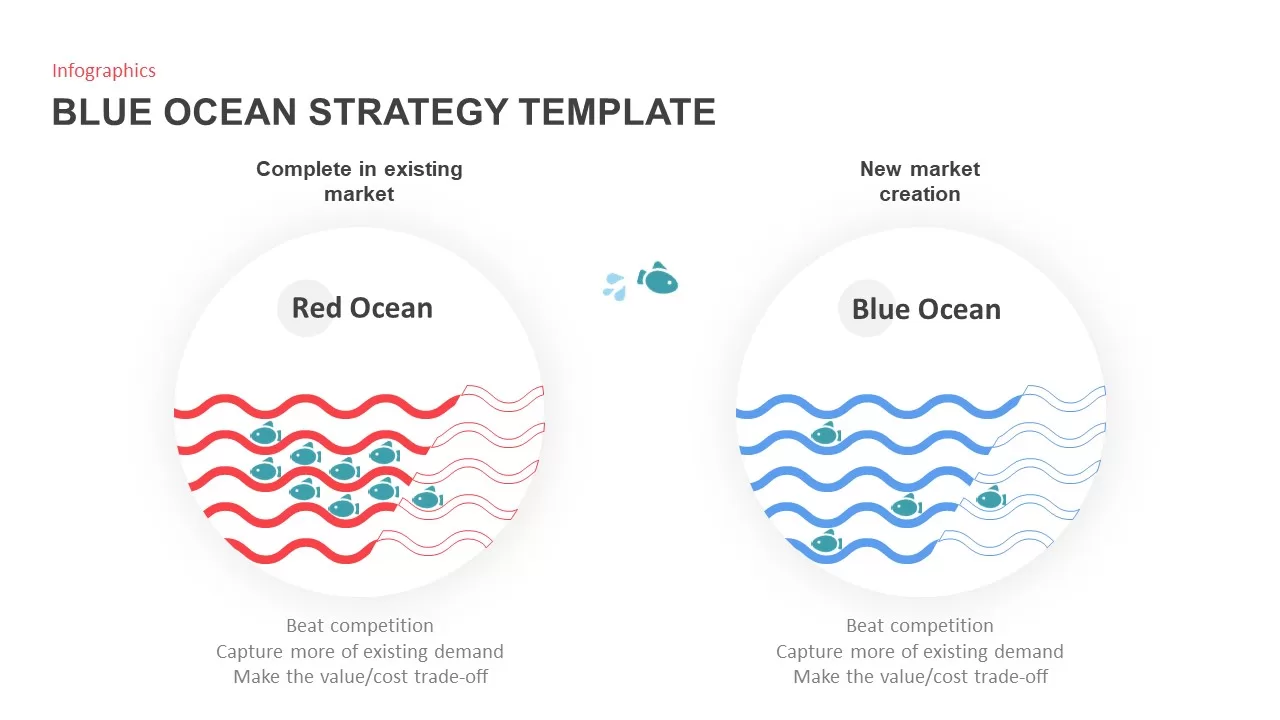
Blue Ocean Strategy Infographic Template for PowerPoint & Google Slides
Marketing
-
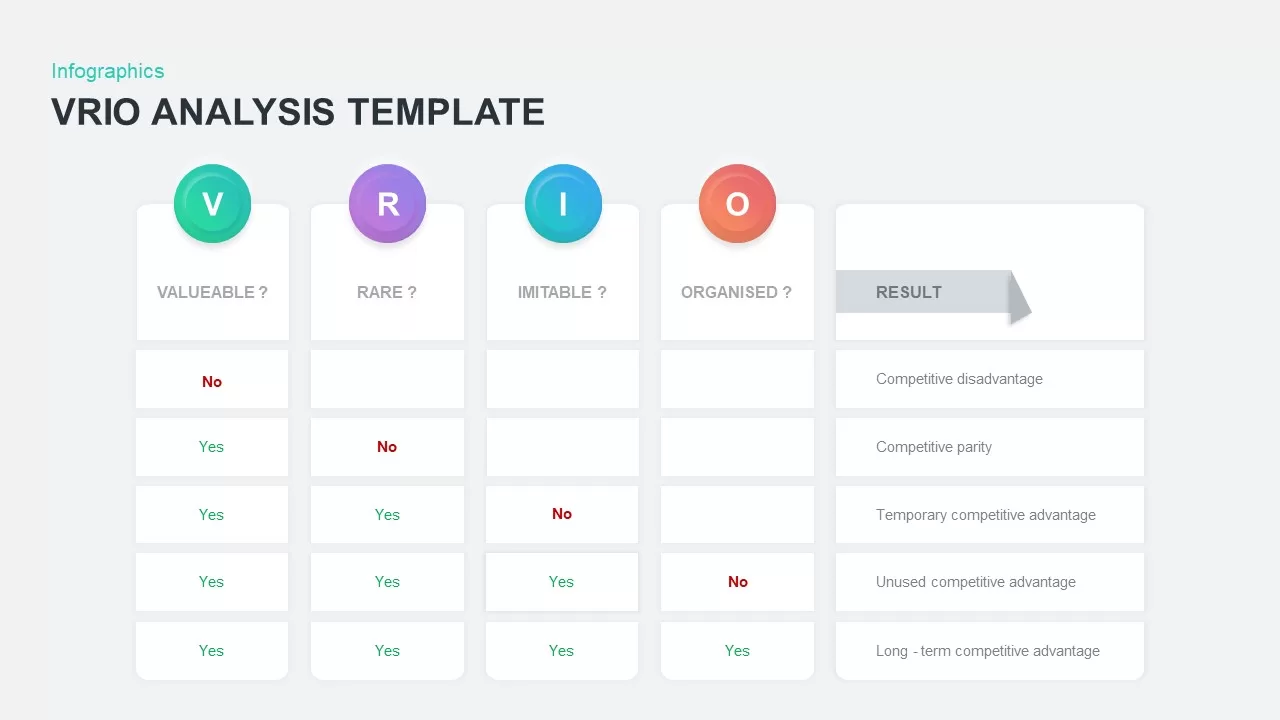
VRIO Analysis Infographic Template for PowerPoint & Google Slides
Business Strategy
-

Sky and Tree Root Cause Analysis Deck Template for PowerPoint & Google Slides
Opportunities Challenges
-
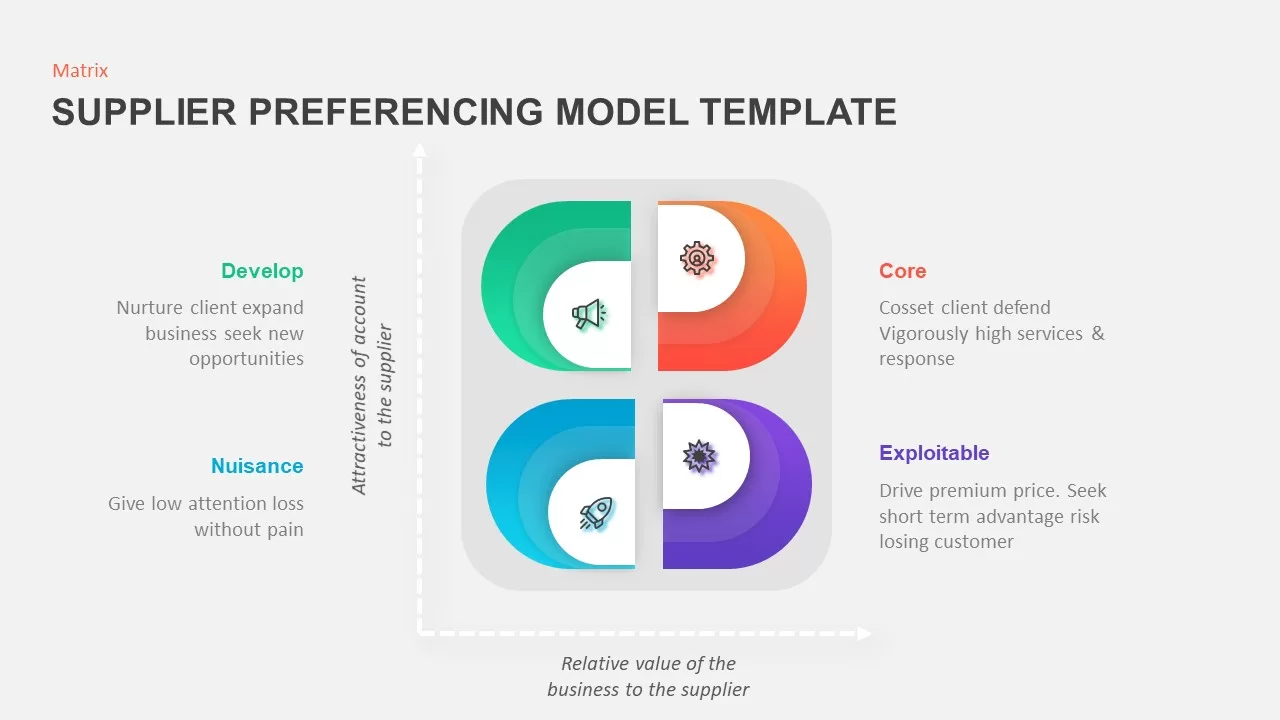
Supplier Preferencing Model Matrix Template for PowerPoint & Google Slides
Business Strategy
-
Roadmap Process Infographic Template for PowerPoint & Google Slides
Roadmap
-

8-Step Circular Diagram Infographics Template for PowerPoint & Google Slides
Circular
-
Circular 3D Cube Six-Segment Diagram Template for PowerPoint & Google Slides
Infographics
-
Underwater Fishbone Cause-Effect Diagram Template for PowerPoint & Google Slides
Process
-
Six-Step Circular Diagram Infographics Template for PowerPoint & Google Slides
Circular
-
Dynamic Gear Diagram Infographics Template for PowerPoint & Google Slides
Process
-
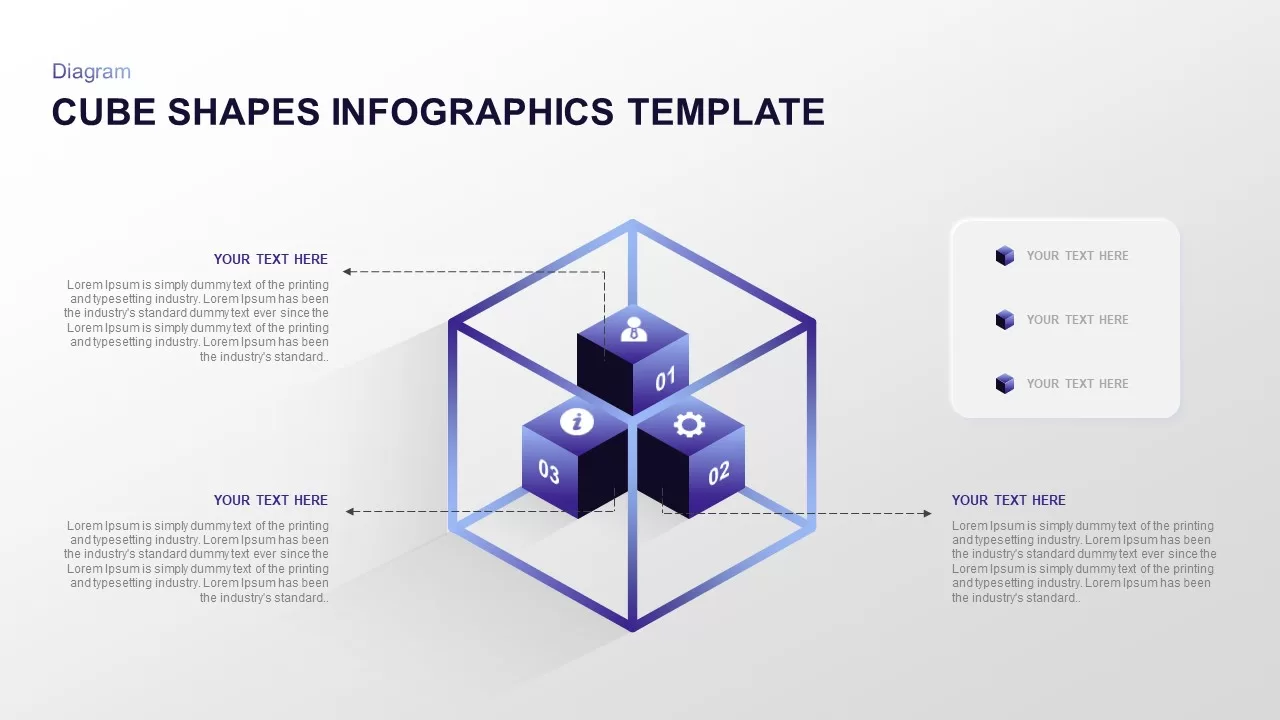
Isometric 3D Cube Shapes Infographics Template for PowerPoint & Google Slides
Infographics
-
Six-Stage Road Map Infographic Timeline Template for PowerPoint & Google Slides
Roadmap
-
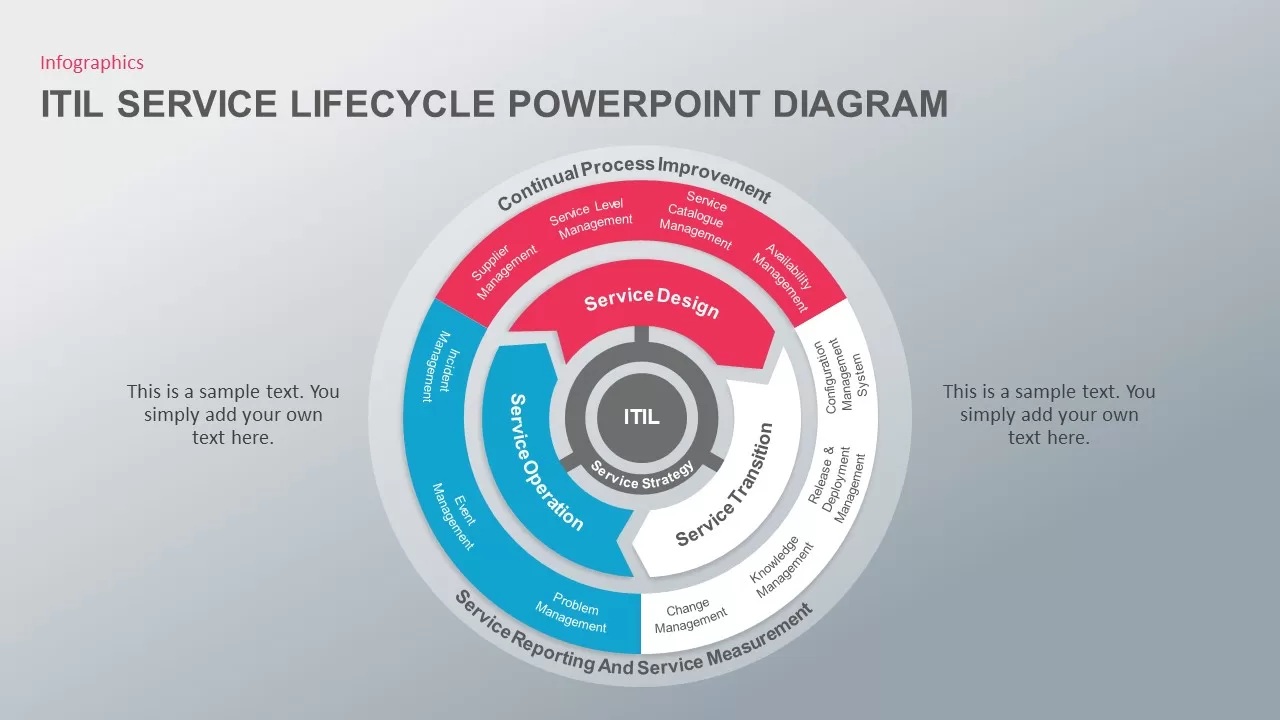
ITIL Service Lifecycle Circular Diagram Template for PowerPoint & Google Slides
Circular
-
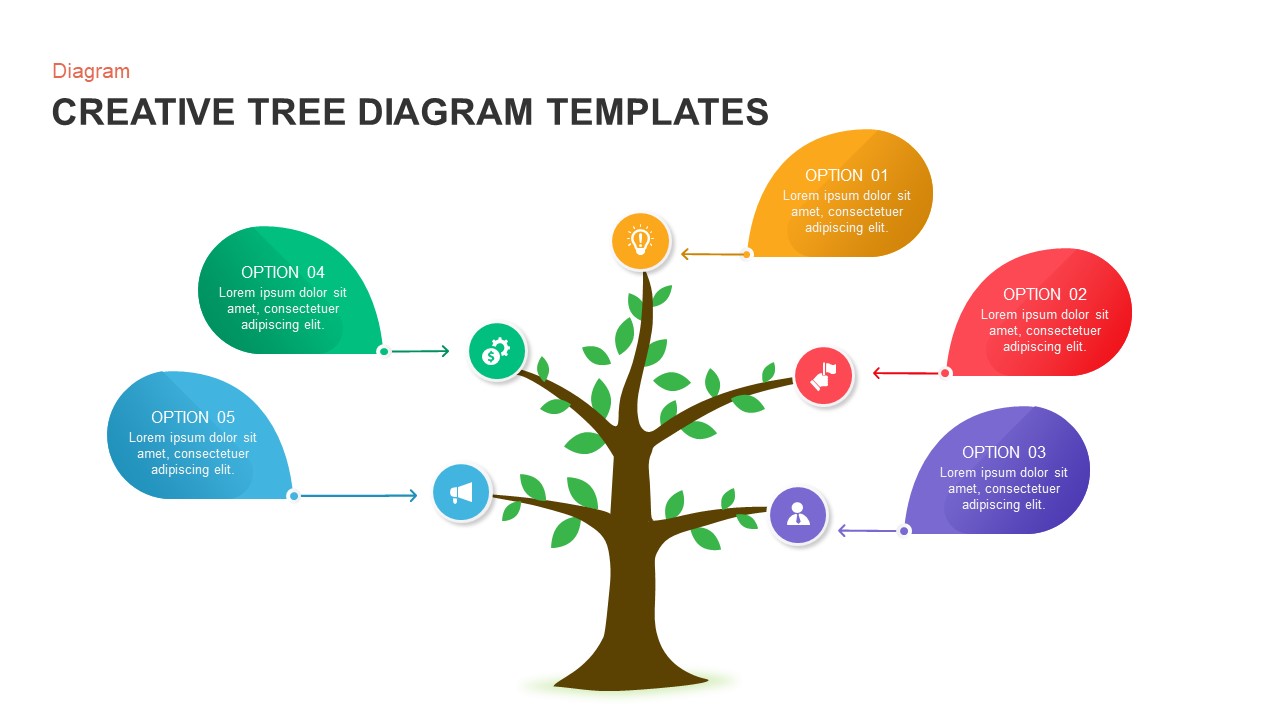
Creative Tree Diagram Infographic Template for PowerPoint & Google Slides
Decision Tree
-
Business Growth Metaphor Chart Template for PowerPoint & Google Slides
Business
-
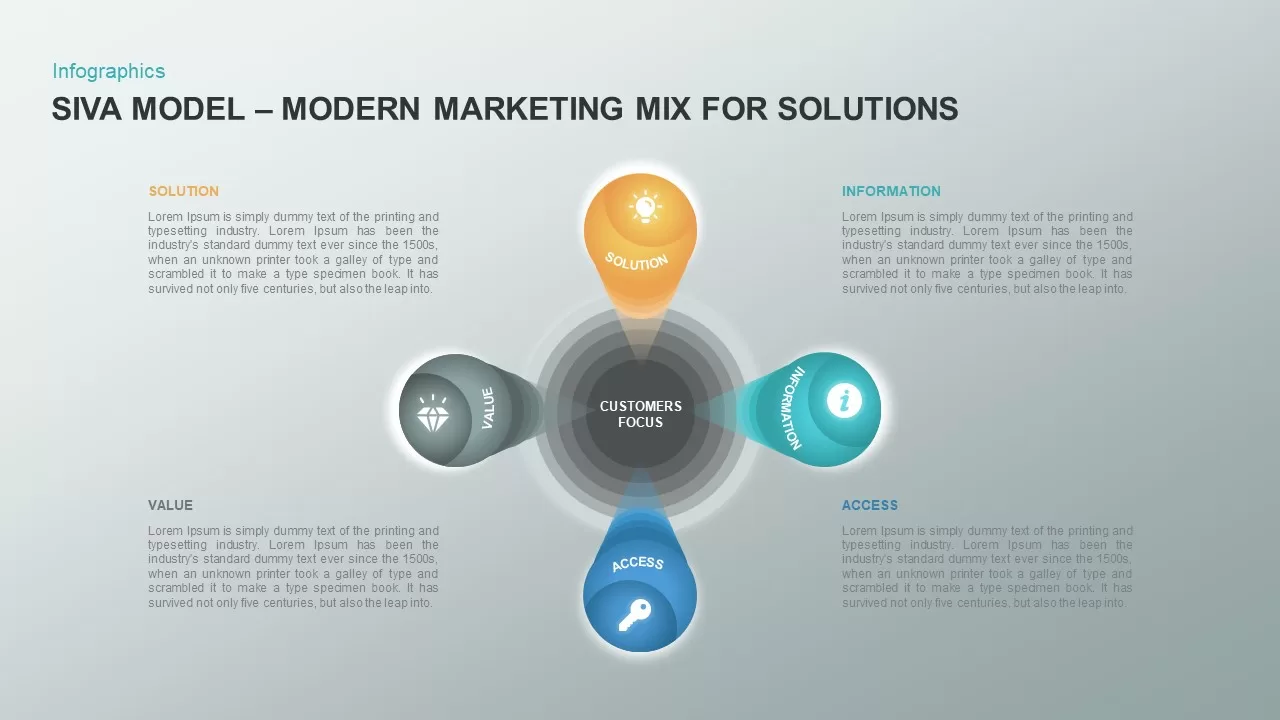
SIVA Model Modern Marketing for PowerPoint & Google Slides
Business Models
-
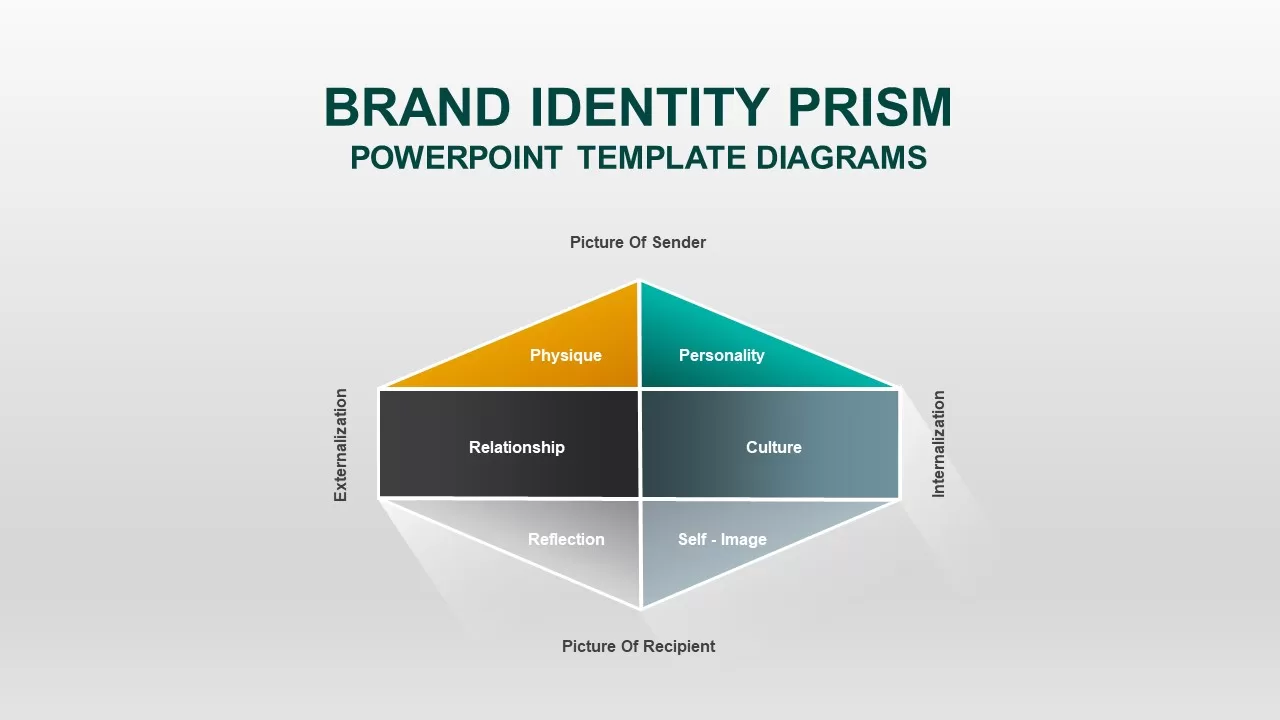
Brand Identity Prism Template for PowerPoint & Google Slides
Infographics
-
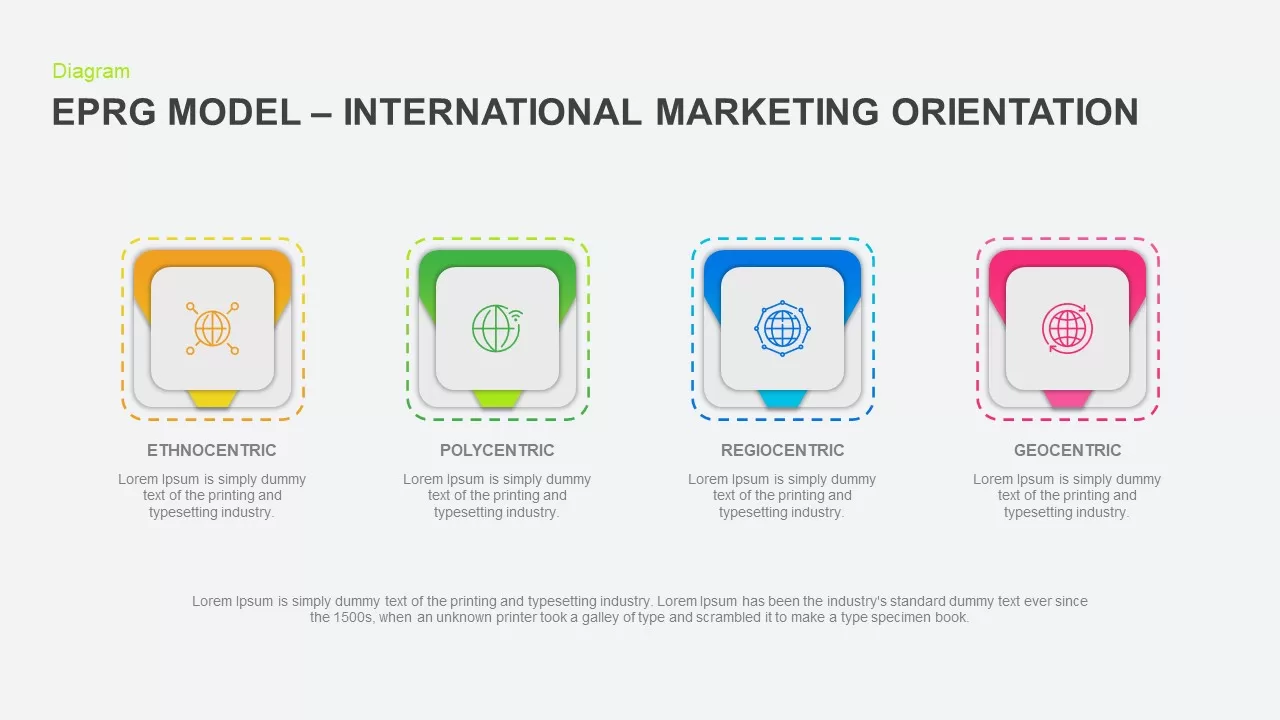
EPRG Model International Marketing for PowerPoint & Google Slides
Business Models
-
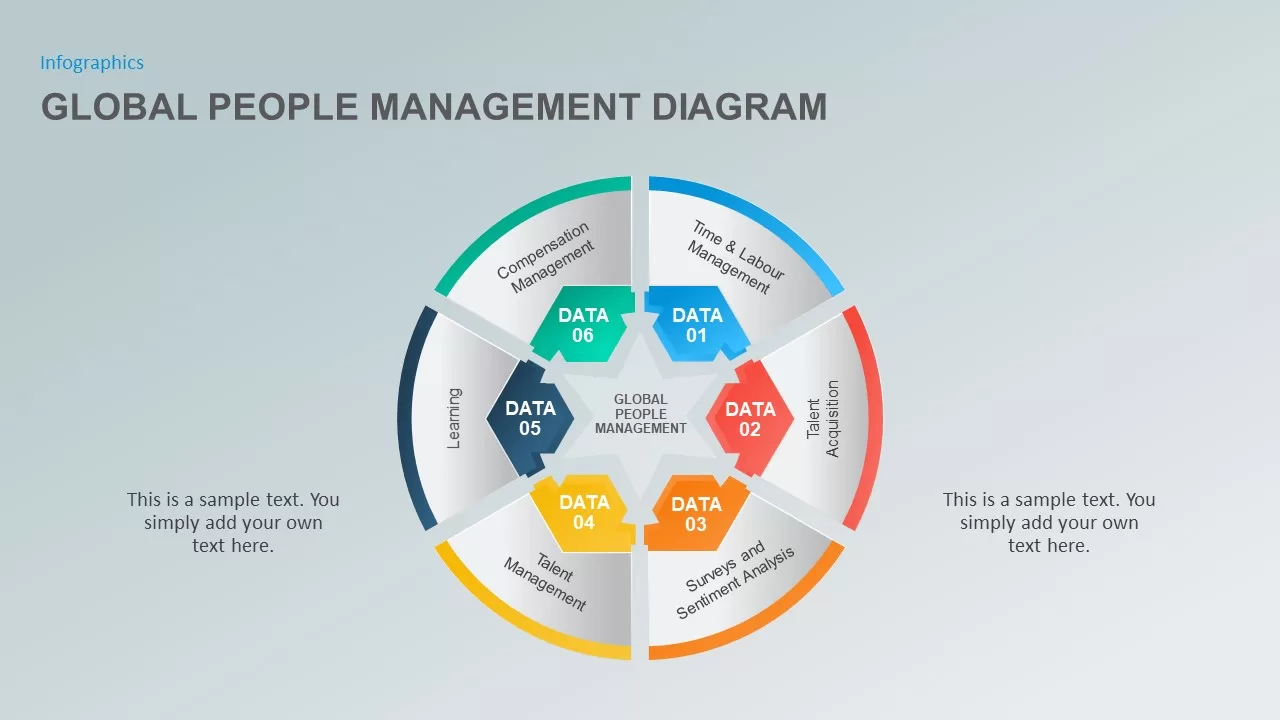
The Global People Management Diagram for PowerPoint & Google Slides
Business Models
-
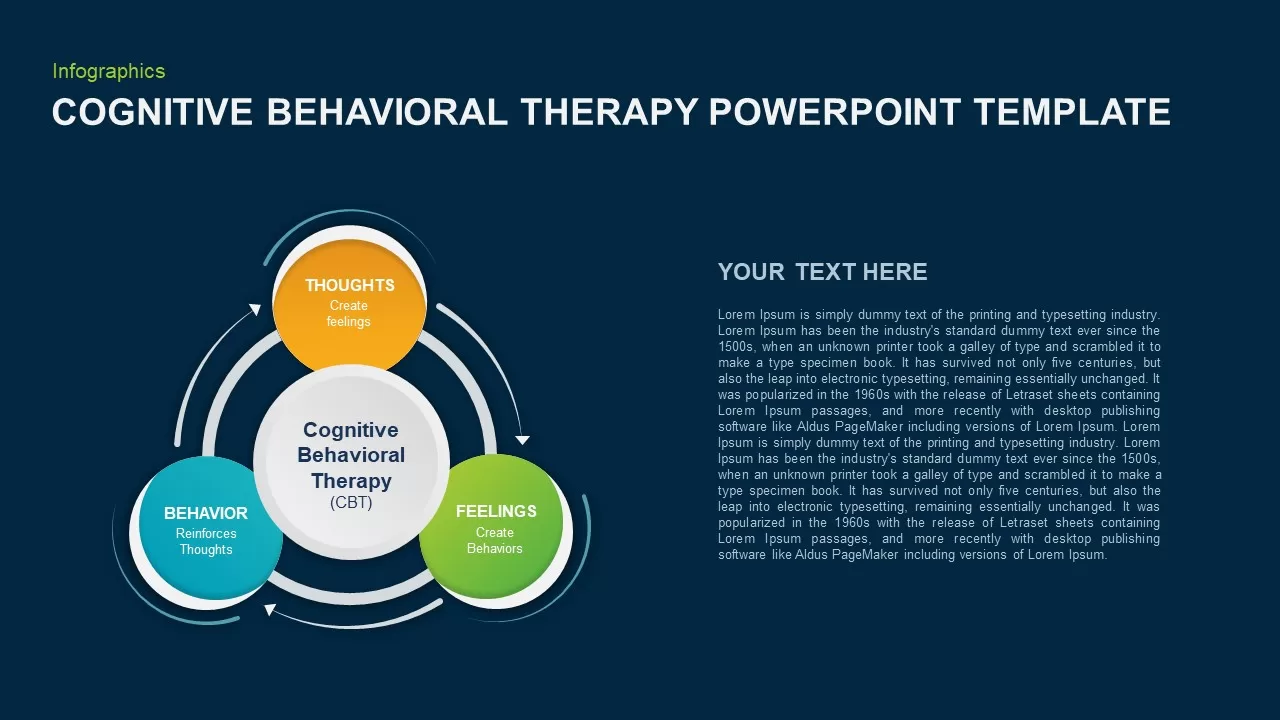
Cognitive Behavioral Therapy Diagram Template for PowerPoint & Google Slides
Health
-
Interaction Infographic for PowerPoint & Google Slides
Process
-
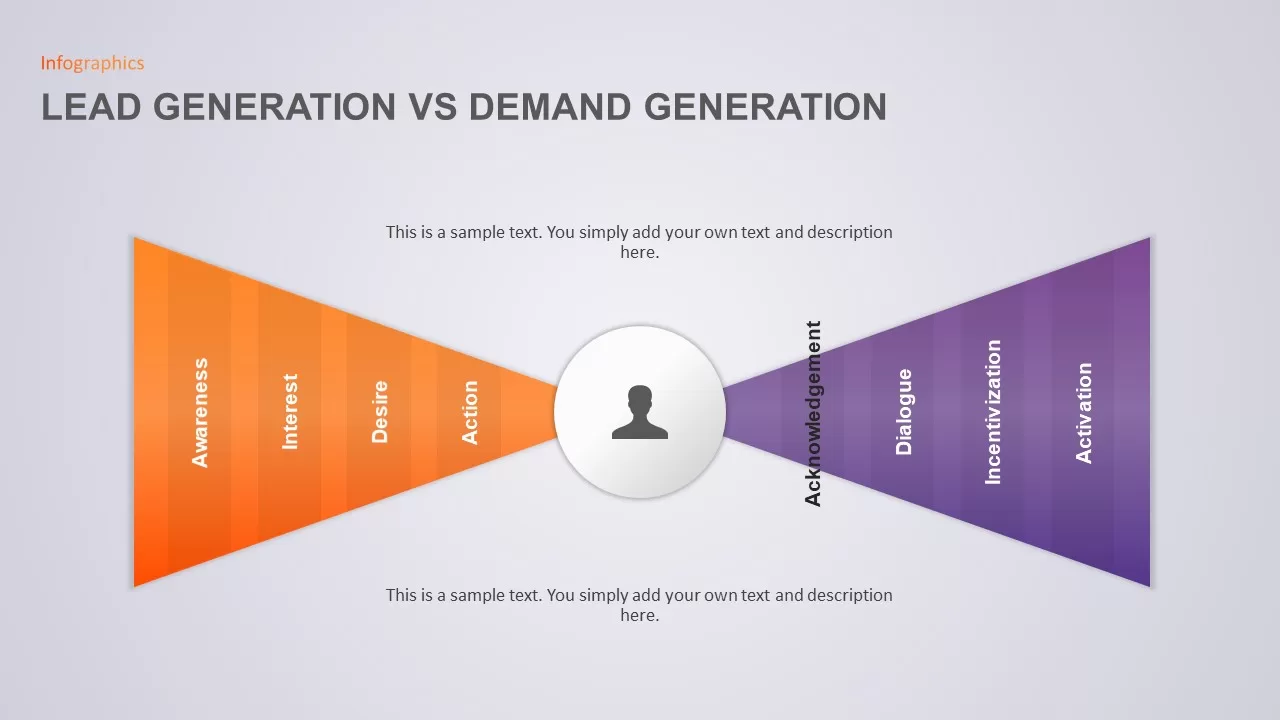
Demand Generation Process Template for PowerPoint & Google Slides
Customer Journey
-
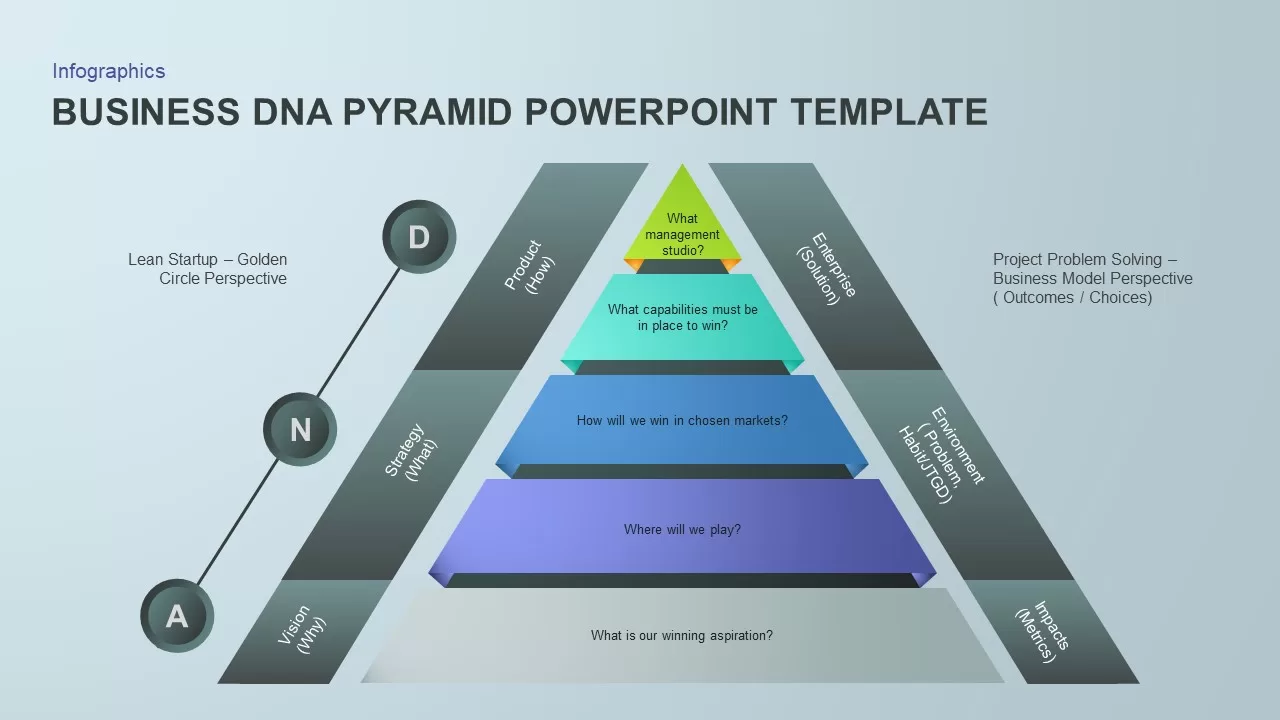
Business DNA Pyramid PowerPoint Template for PowerPoint & Google Slides
Pyramid
-
4 Step Problem Solving PowerPoint Diagram for PowerPoint & Google Slides
Process
-
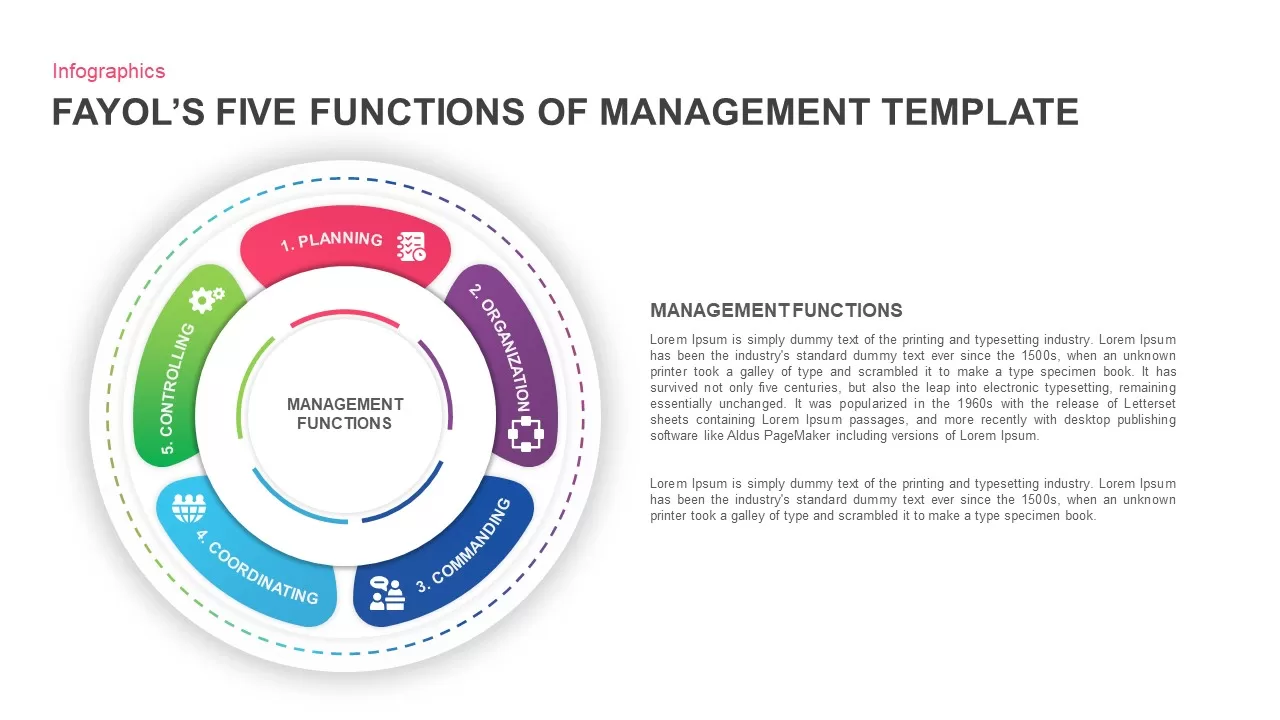
Fayol’s Five Functions of Management Template for PowerPoint & Google Slides
Business
-
Dashboard Templates for PowerPoint & Google Slides
Bar/Column
-
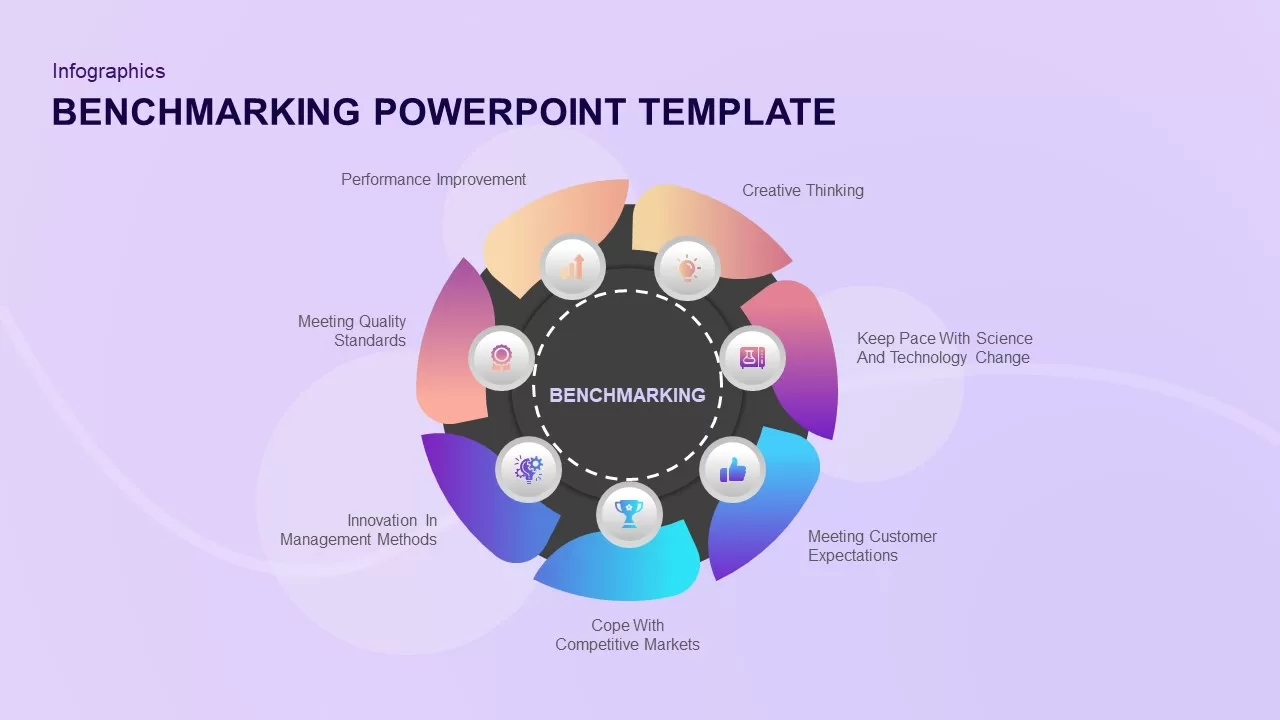
Benchmarking PowerPoint Template for PowerPoint & Google Slides
Process
-
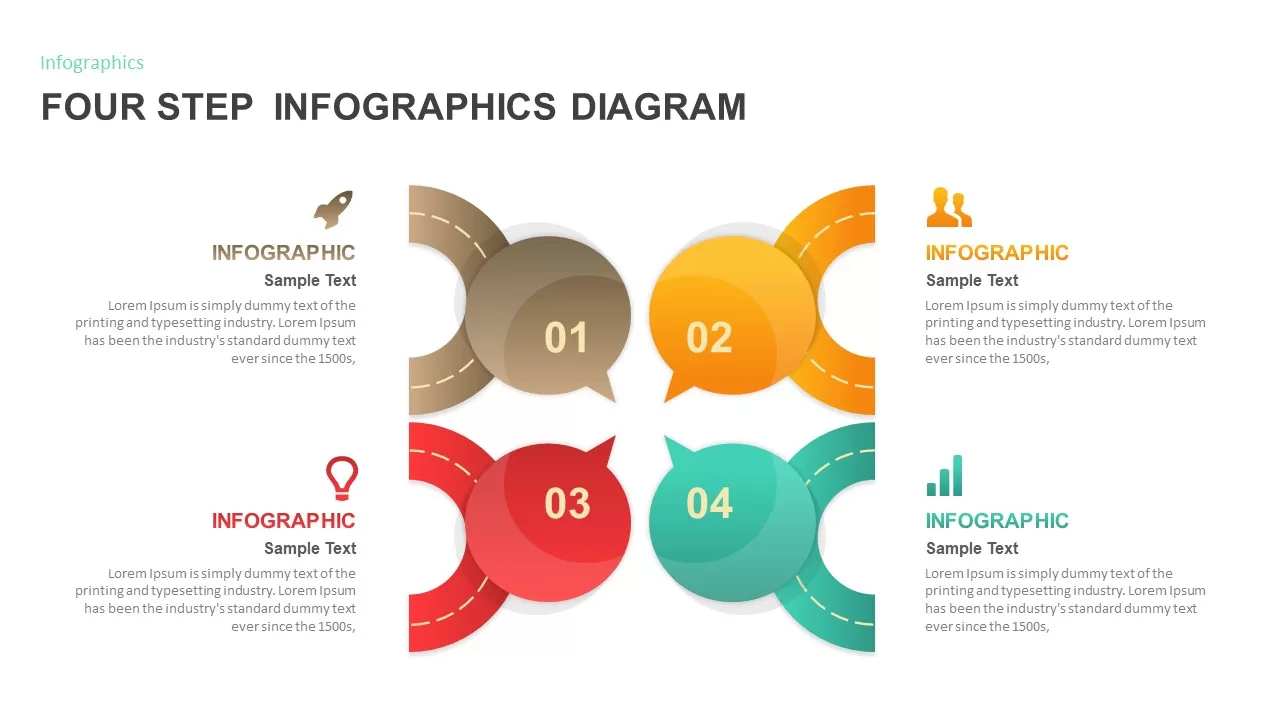
Four Step Infographics Diagram for PowerPoint & Google Slides
Process
-
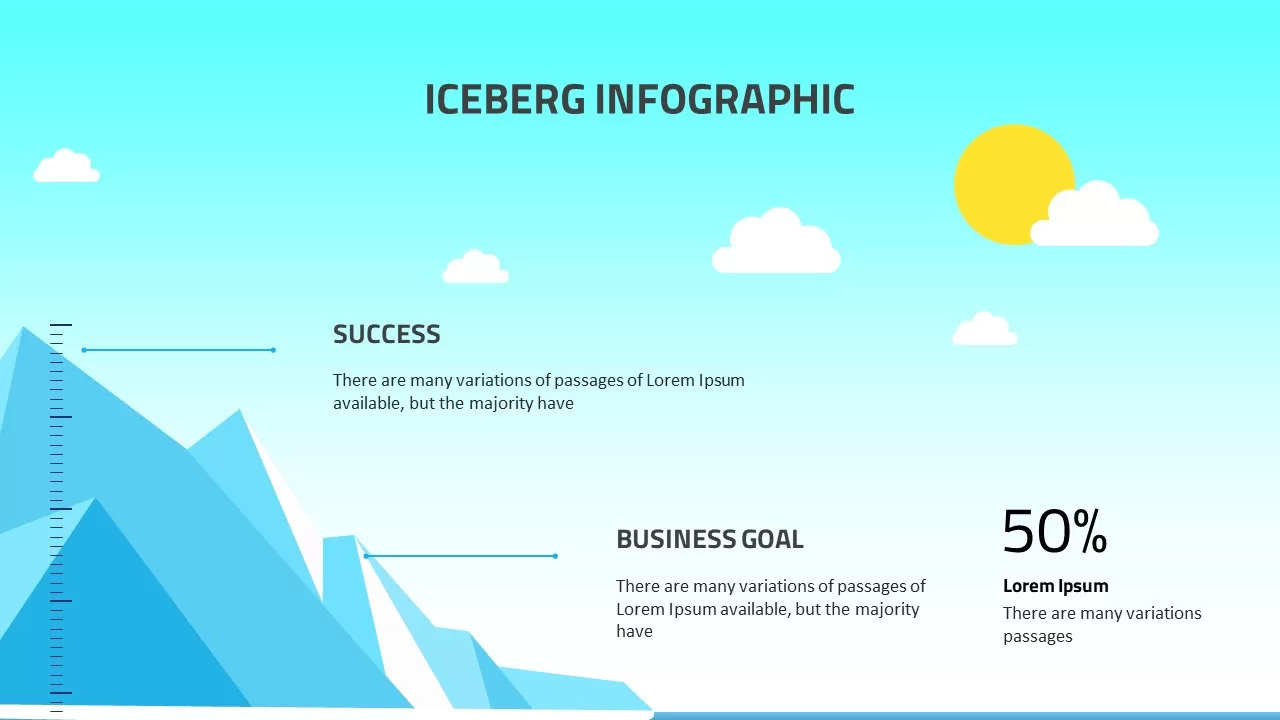
Iceberg Infographic for PowerPoint & Google Slides
Iceberg Charts
-
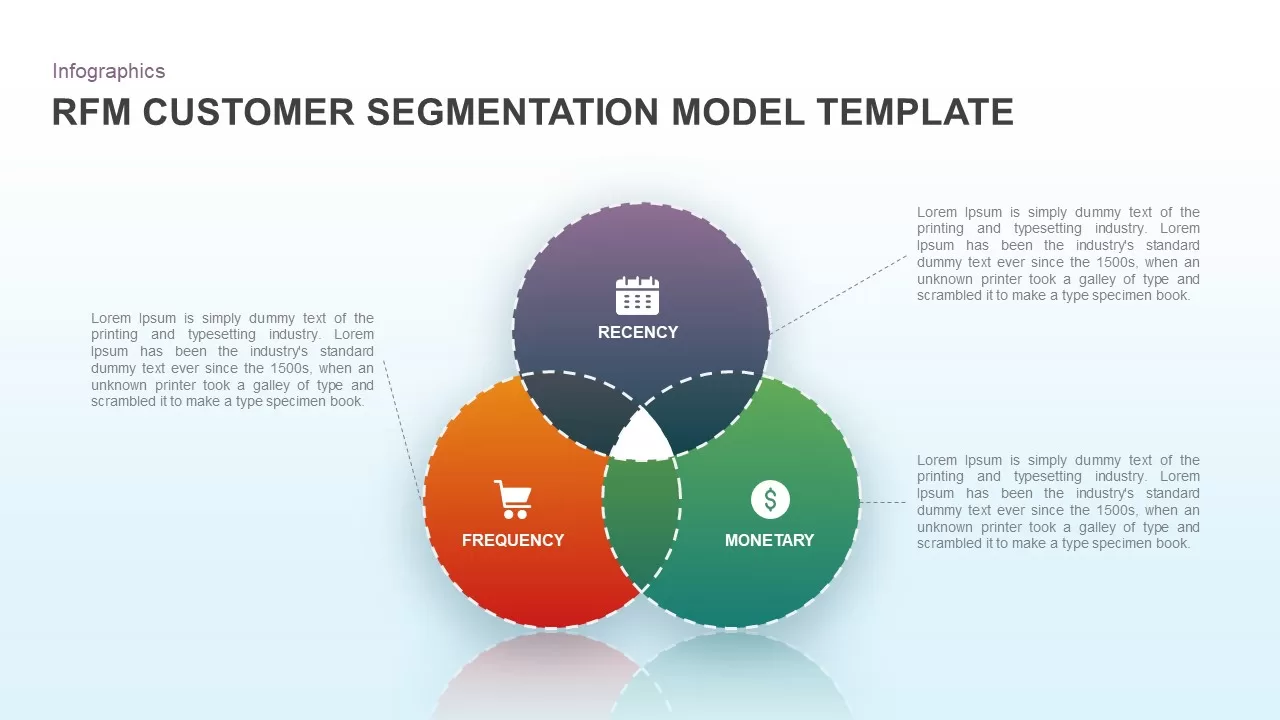
RFM Customer Segmentation Template for PowerPoint & Google Slides
Business Models