Growth Tables Slide template for PowerPoint & Google Slides


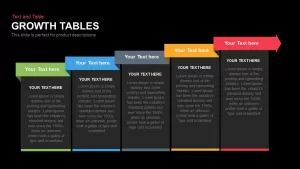
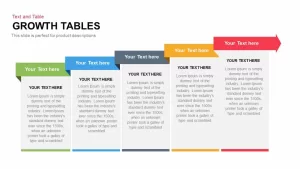
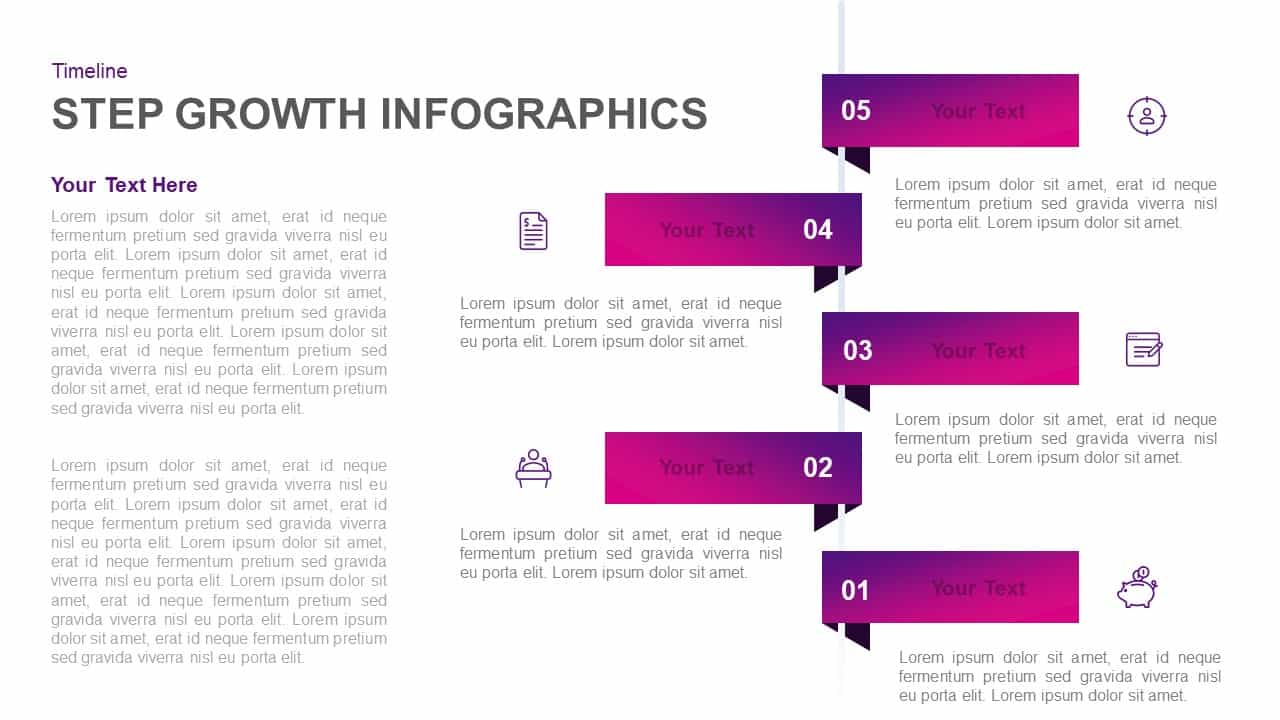
Use this Growth Tables slide to present sequential product features or performance metrics across five distinct stages. This professionally designed template features five vertical panels topped with ribbon-style headers in green, blue, gray, yellow, and red, each tab incrementally larger to convey momentum and progression. The clean, modern layout leverages ample white space and vibrant accents to guide viewers’ attention from the initial stage through to final outcomes. Built with master layouts, this asset ensures consistent styling and seamless text replacement in both PowerPoint and Google Slides. Fully editable color palettes, typefaces, and shapes allow you to align the visual theme with your brand guidelines in seconds. The flexible structure supports detailed headlines, rich text passages, and metric highlights within each section, making it ideal for illustrating quarterly growth reports, product roadmaps, feature comparisons, or competitive analyses. Experienced presenters will appreciate how effortlessly you can swap icons, adjust panel widths, or reorder stages to suit diverse narrative needs. The slide’s intuitive placeholders and grid alignment reduce formatting time, so you can focus on crafting compelling content rather than wrestling with design intricacies. Optimized for widescreen 16:9 and adaptable to 4:3 ratios, this template maintains high resolution clarity across projectors and HD displays. Color-coded tabs provide immediate stage identification, while subtle drop shadows add depth without overwhelming the design. With its balanced composition and intuitive editing features, this slide accelerates your workflow and enhances audience engagement, turning raw data into persuasive visual narratives in minutes.
Who is it for
Product managers, marketing teams, sales directors, project managers, and startup founders will find this slide invaluable for communicating growth stages, feature rollouts, and performance benchmarks. Consultants and business analysts can leverage its structured format to make data-driven insights accessible and engaging for executive audiences.
Other Uses
Beyond growth tables, repurpose each panel as a comparison chart, checklist, pricing tier overview, or timeline marker. Swap colors and icons to adapt the layout for strategic roadmaps, milestone tracking, process flows, or competitive landscape analyses in any corporate presentation.
Login to download this file

Item ID
SB00284
Related Templates

Growth Arrow for Progress & Growth template for PowerPoint & Google Slides
Arrow

Five 3D Growth Arrow Infographic Slide Template for PowerPoint & Google Slides
Arrow
Five-Step Growth Infographic Slide Template for PowerPoint & Google Slides
Process
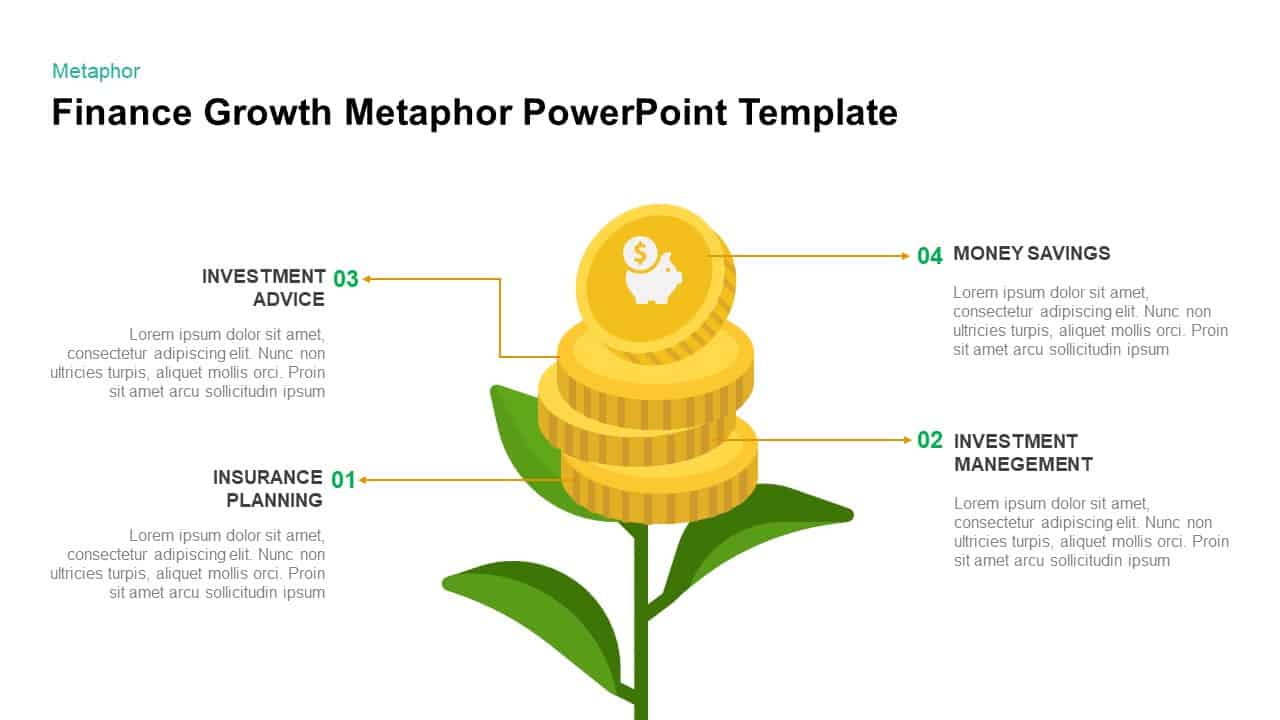
Finance Growth Plant Metaphor Slide Template for PowerPoint & Google Slides
Finance
3D Curved Arrow Growth Process Slide Template for PowerPoint & Google Slides
Process
Abraham Maslow Growth Quote Slide Template for PowerPoint & Google Slides
Vision and Mission
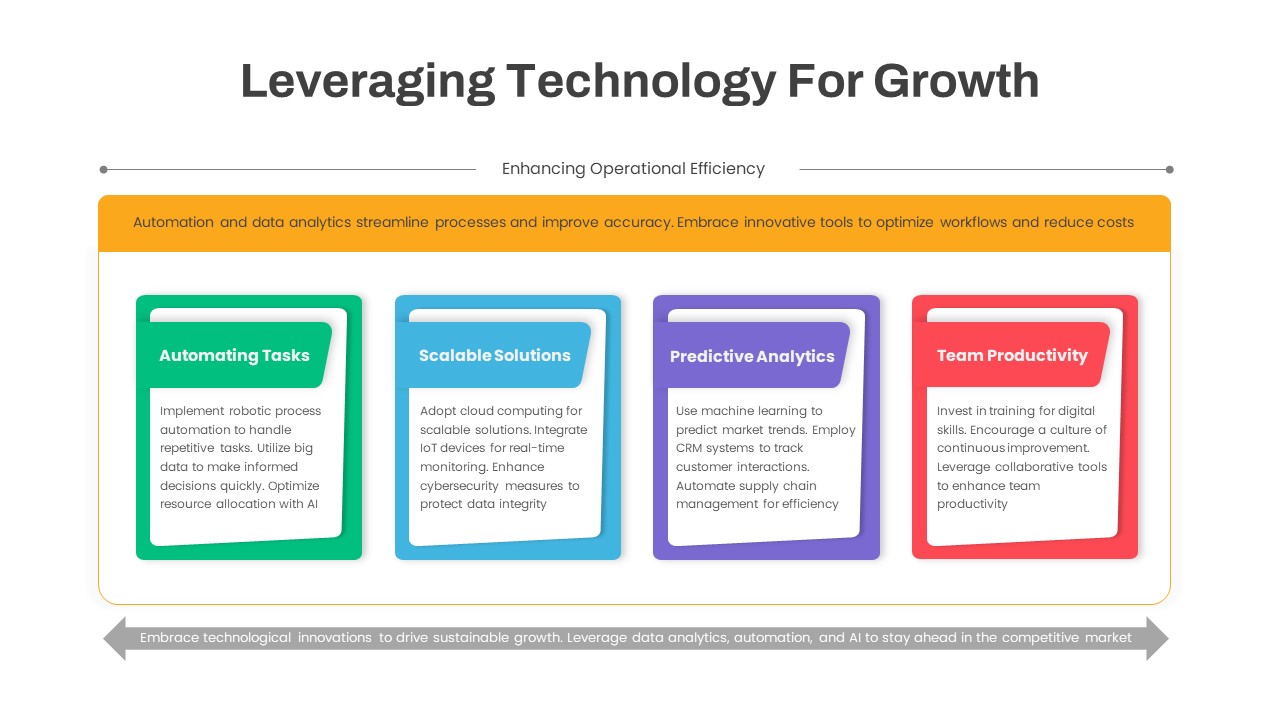
Leveraging Technology for Growth Slide Template for PowerPoint & Google Slides
Information Technology
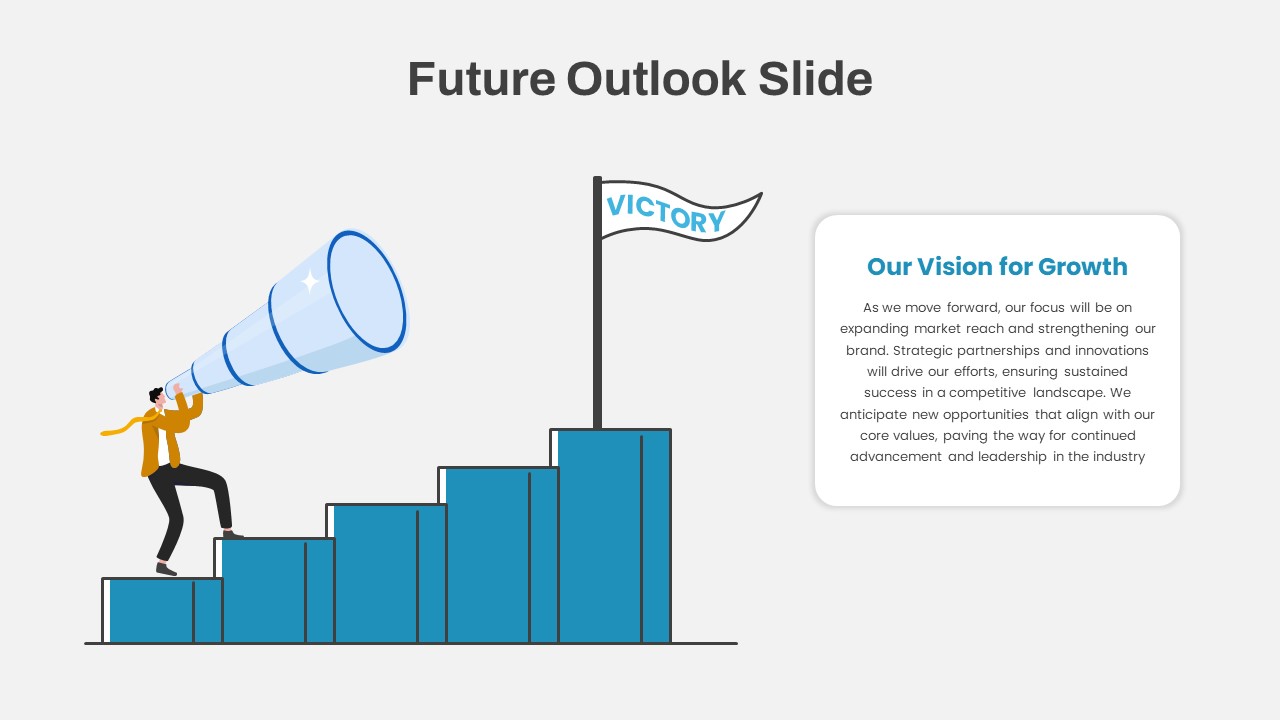
Future Outlook and Growth Strategy Slide Template for PowerPoint & Google Slides
Infographics
Growth Timeline template for PowerPoint & Google Slides
Timeline
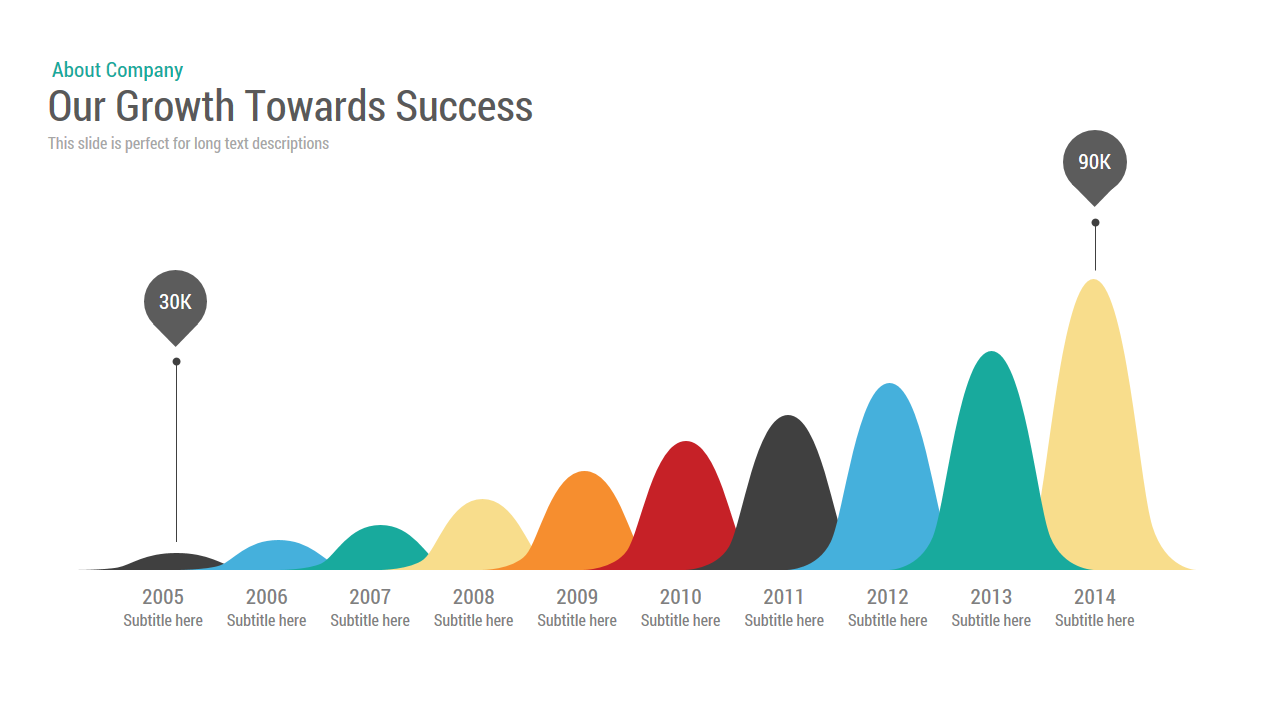
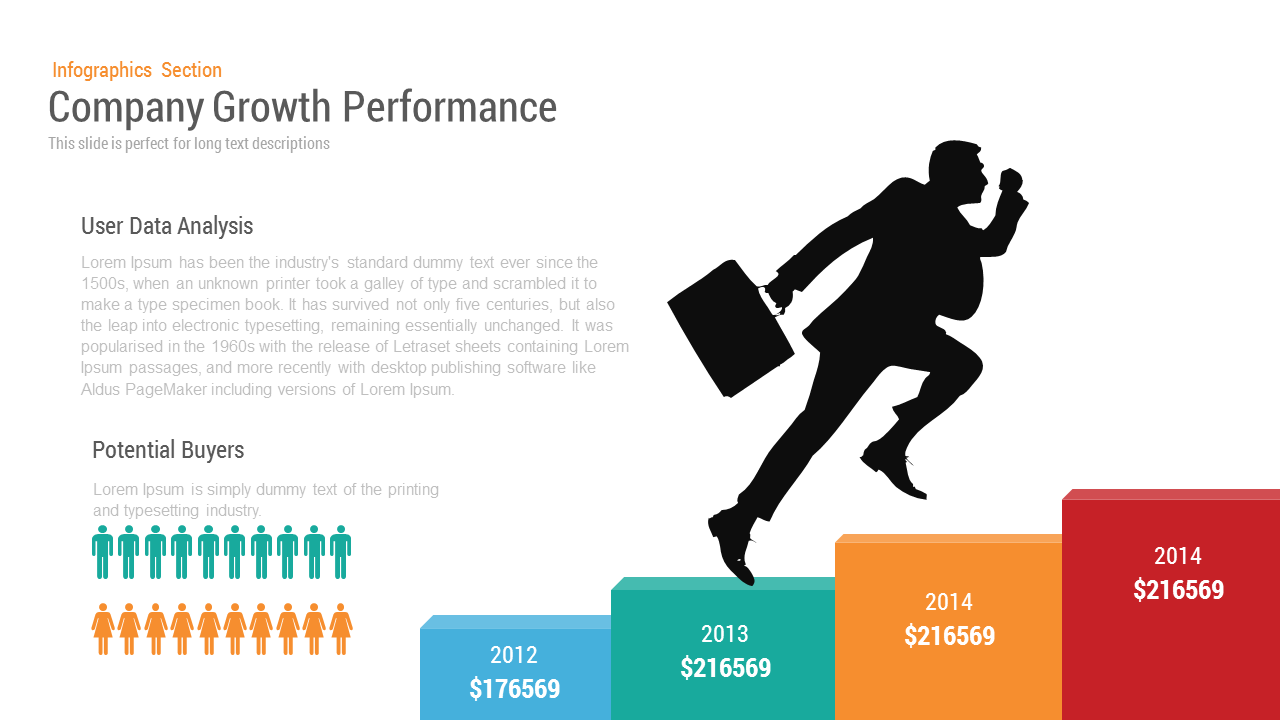
Company Growth template for PowerPoint & Google Slides
Charts
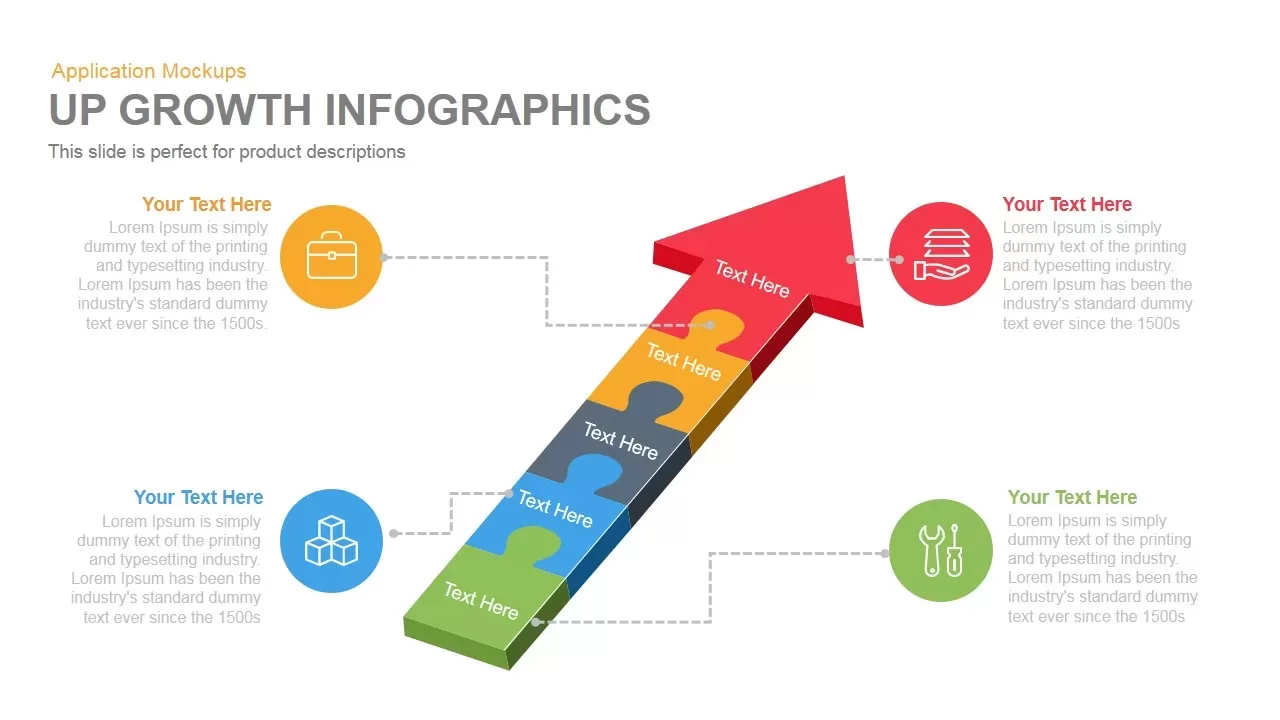
Growth Infographics template for PowerPoint & Google Slides
Arrow
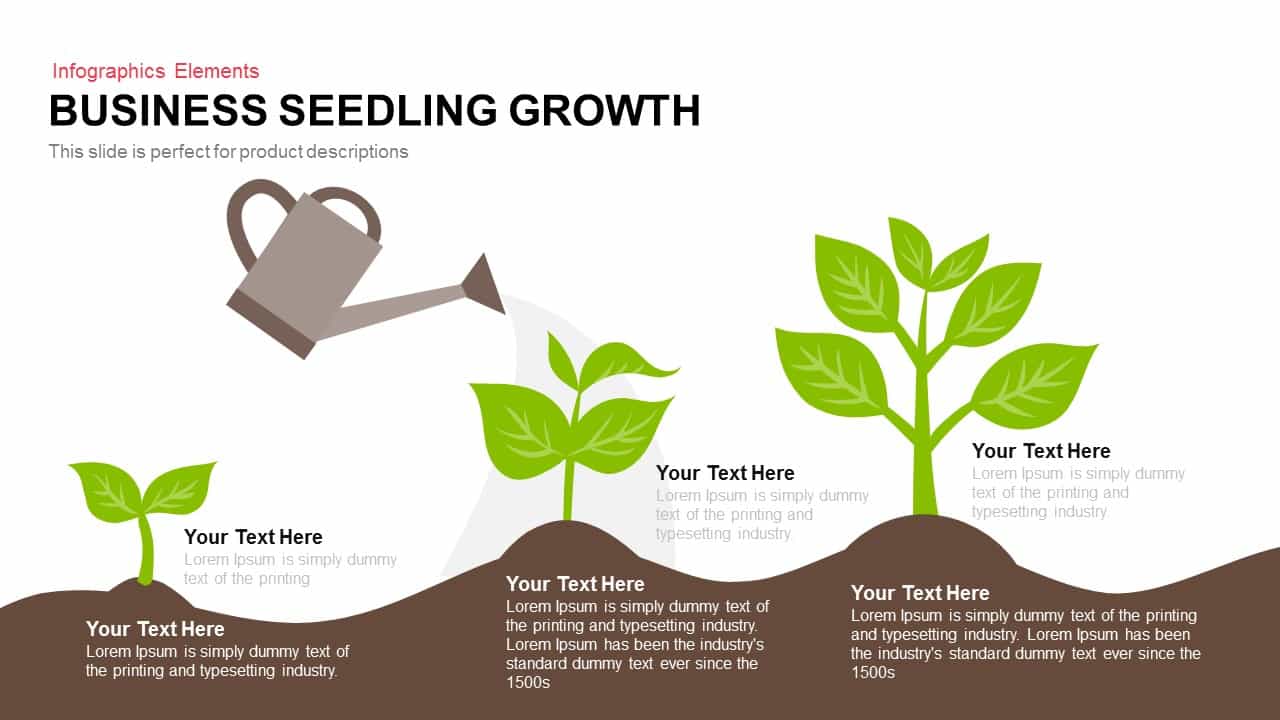
Business Seedling Growth Template for PowerPoint & Google Slides
Infographics
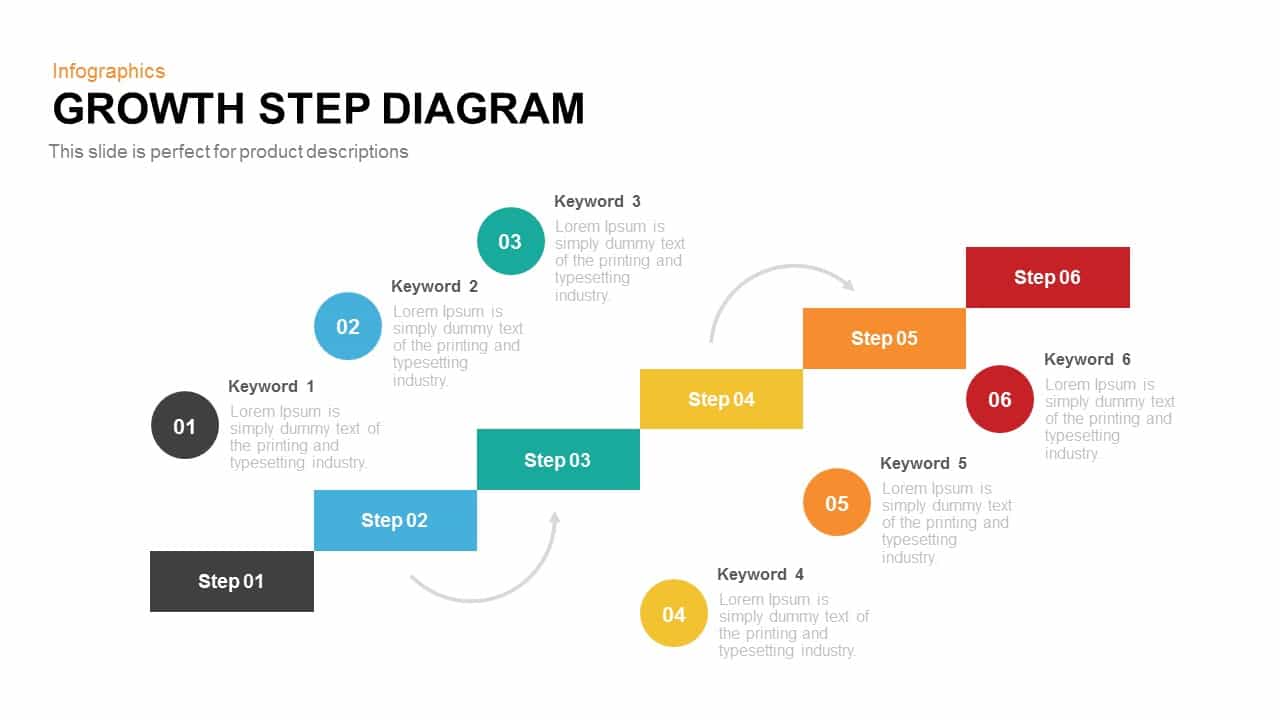
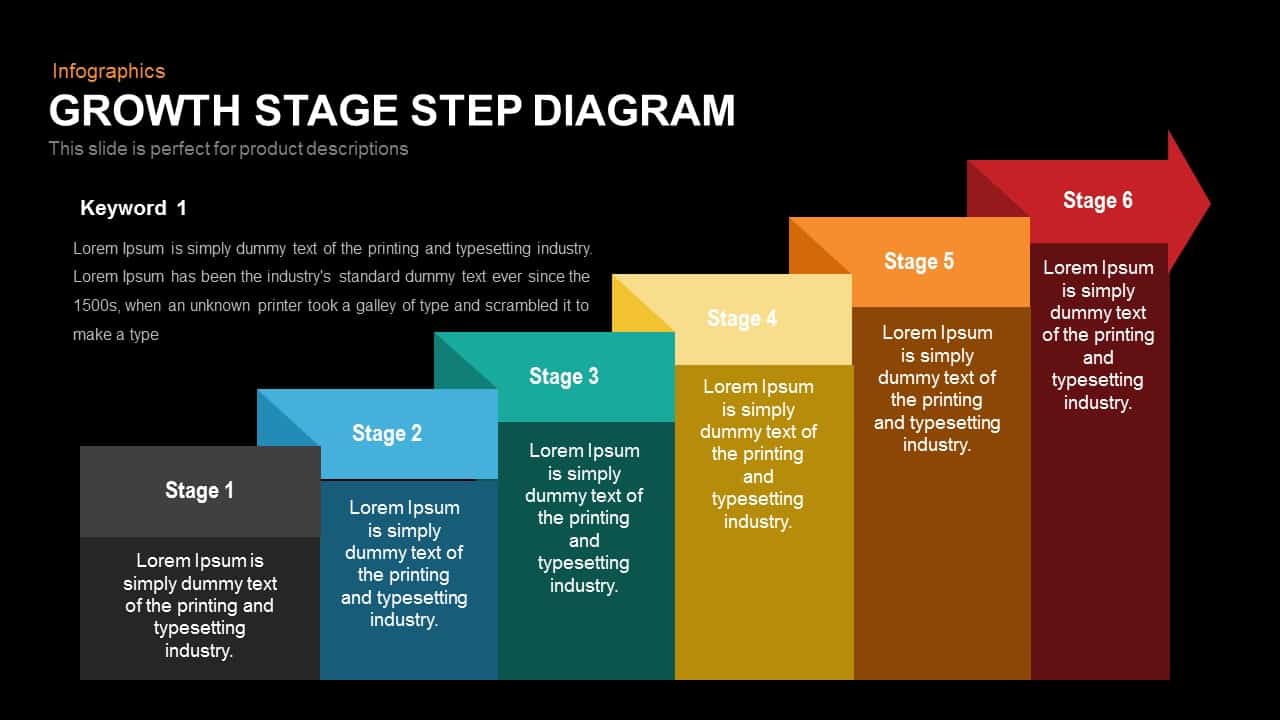
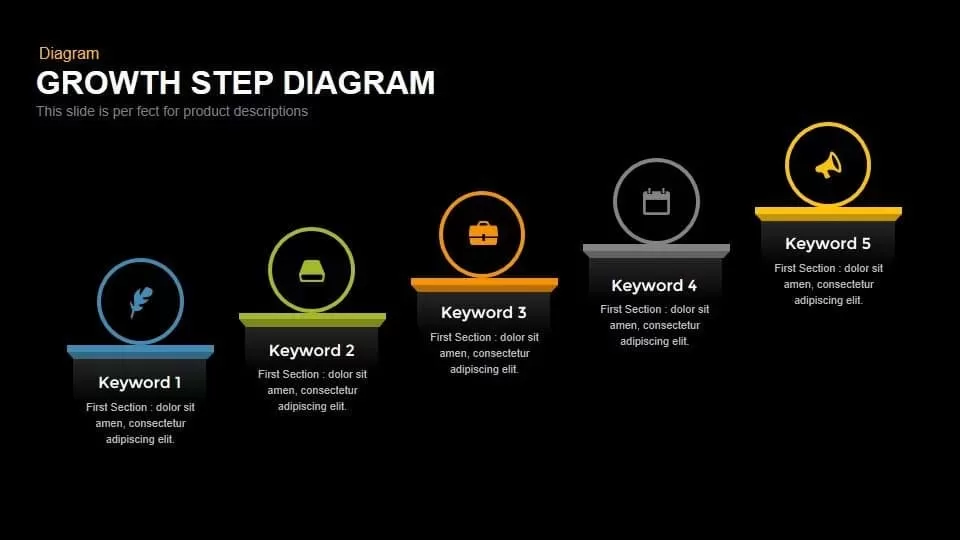
Growth Step Diagram template for PowerPoint & Google Slides
Infographics
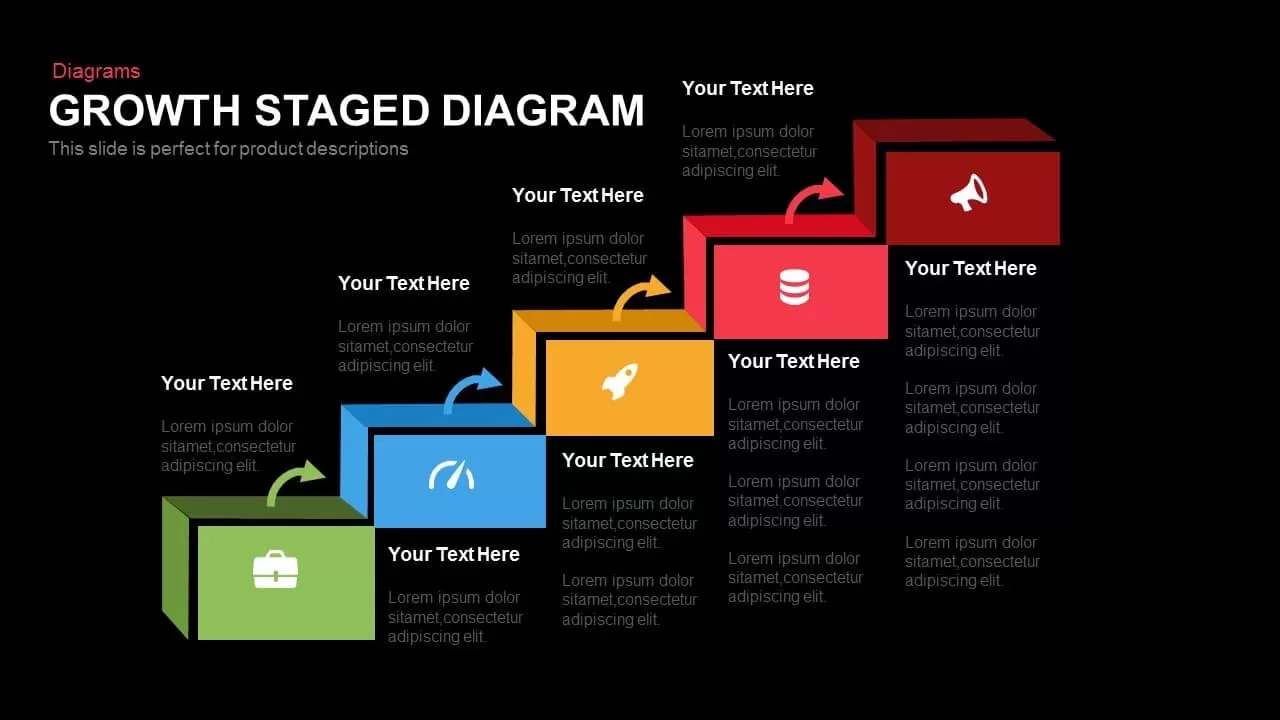
Growth Stage Diagram template for PowerPoint & Google Slides
Process
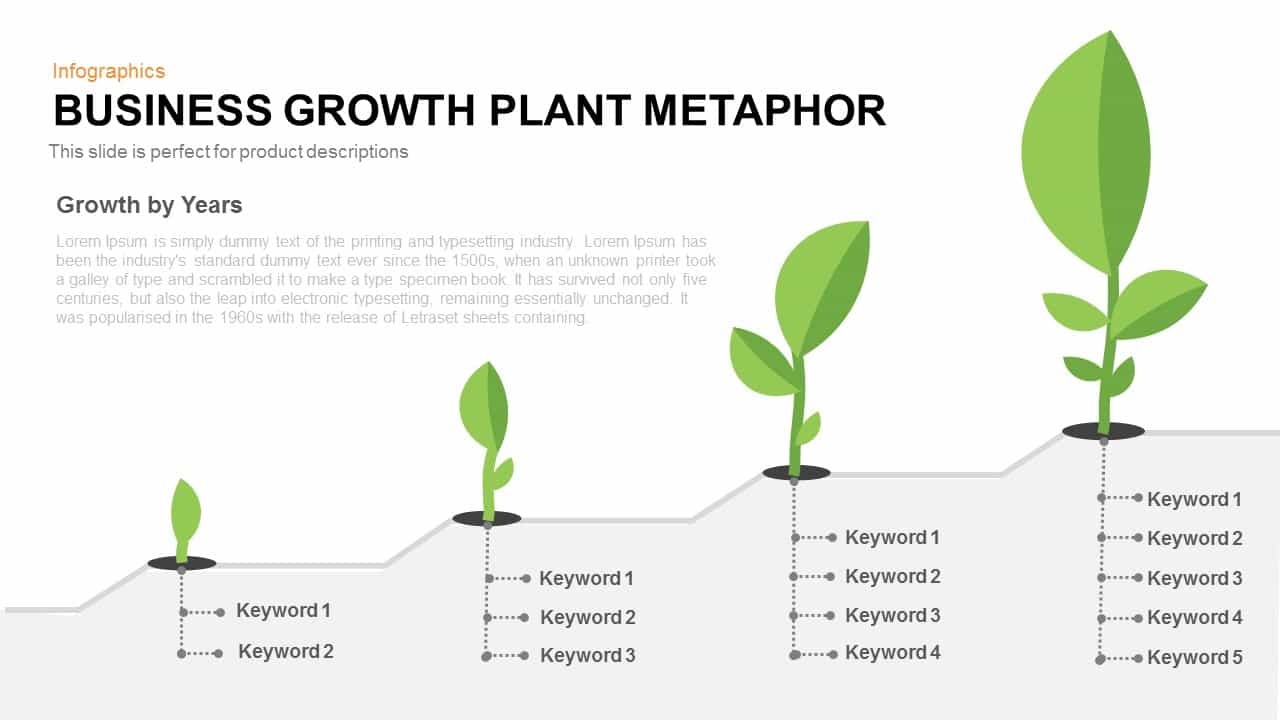
Business Growth Plant Metaphor Timeline Template for PowerPoint & Google Slides
Business Strategy
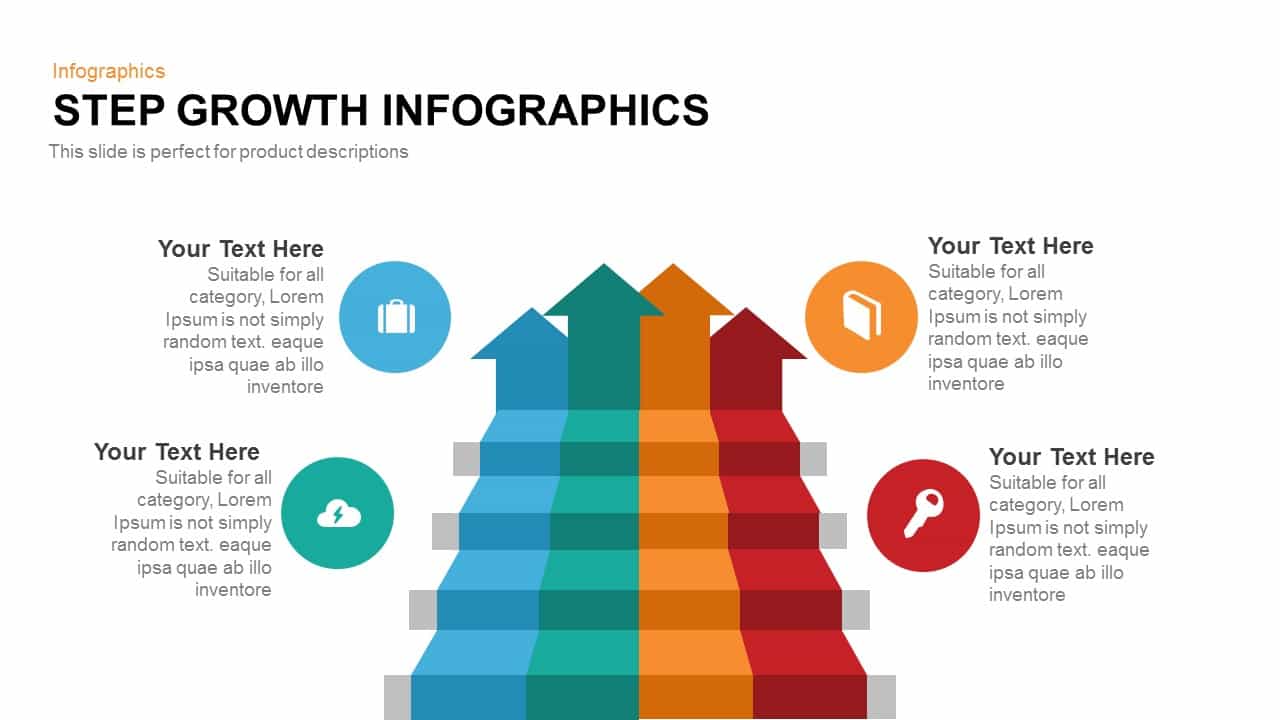
Modern Step Growth Infographics Template for PowerPoint & Google Slides
Process
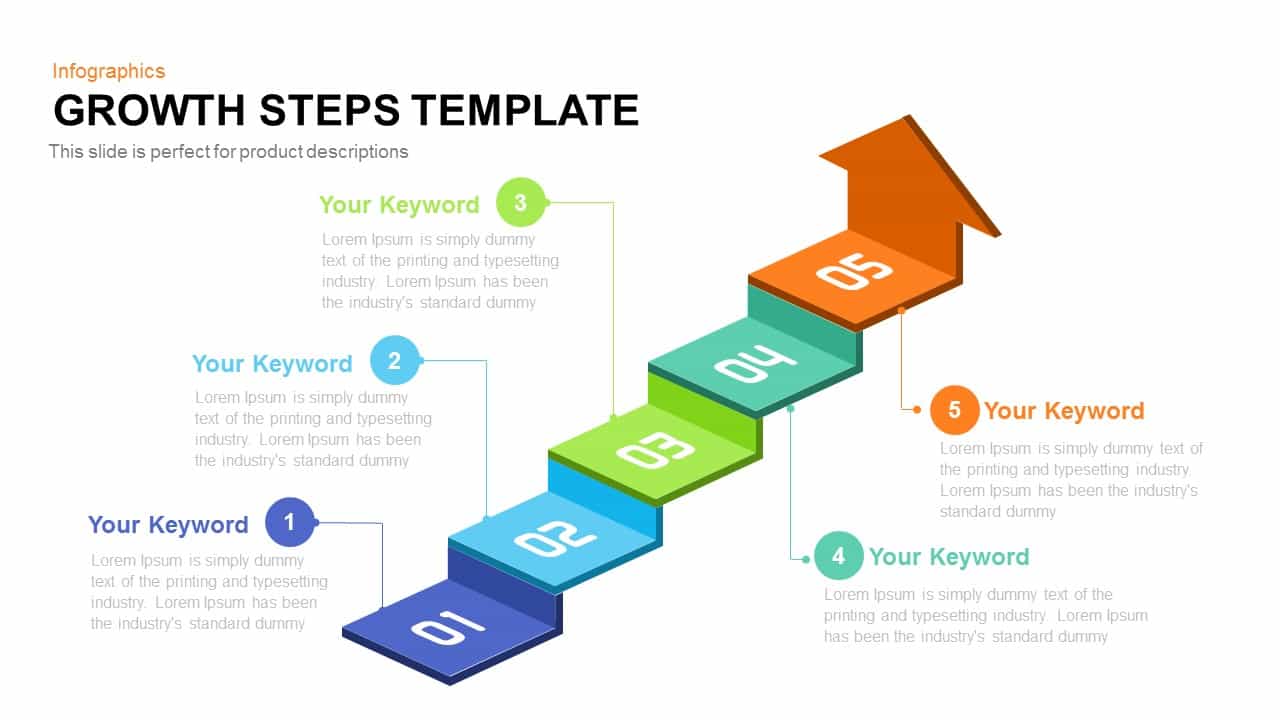
5-Step Growth Staircase Infographic Template for PowerPoint & Google Slides
Process

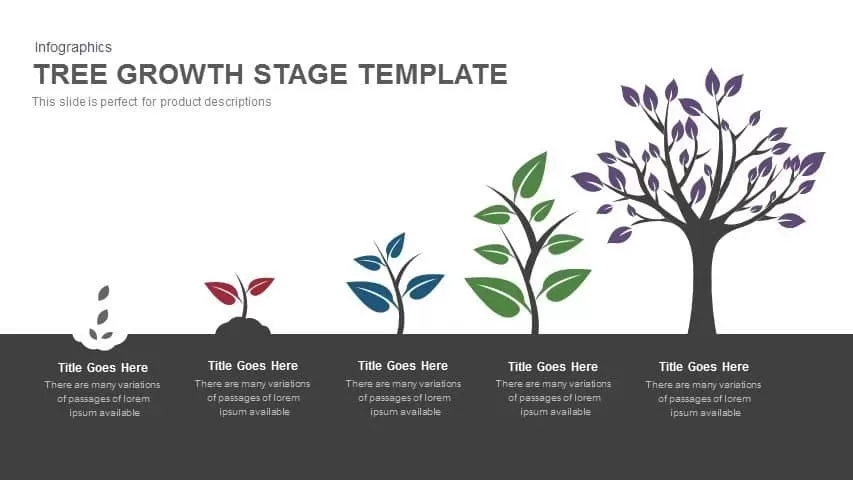
Tree Growth Stage Infographic Template for PowerPoint & Google Slides
Timeline
Five-Step Growth Stage Staircase Diagram Template for PowerPoint & Google Slides
Process

Modern Five-Step Growth Diagram Template for PowerPoint & Google Slides
Process
Improvement Growth Arrow Metaphor Template for PowerPoint & Google Slides
Bar/Column
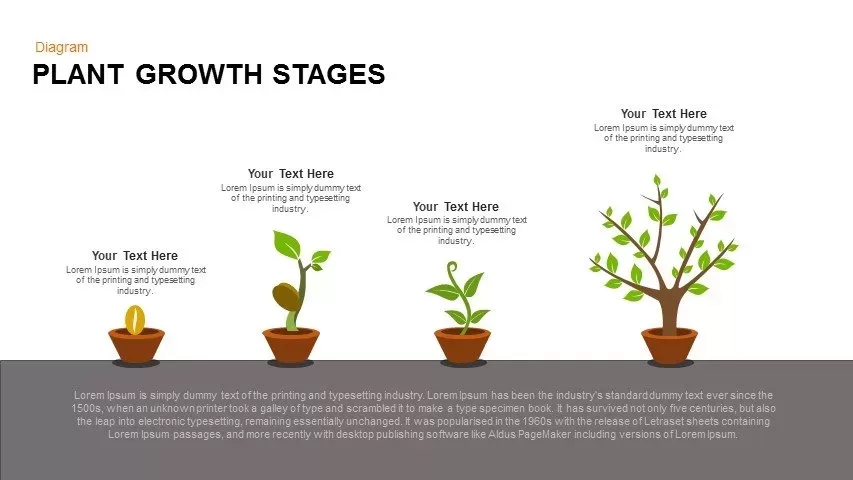
Editable Plant Growth Stages Diagram Template for PowerPoint & Google Slides
Process
Growth Sign Board Infographics template for PowerPoint & Google Slides
Timeline
Five-Stage Growth Arrow Infographic Template for PowerPoint & Google Slides
Arrow
Ansoff Matrix Growth Strategy Model Template for PowerPoint & Google Slides
BCG
Six Stage Incremental Growth template for PowerPoint & Google Slides
Timeline
4 Step Revenue Growth Flow Diagram Template for PowerPoint & Google Slides
Process
Growth Plant Infographics template for PowerPoint & Google Slides
Process
Business Growth Infographic Metaphor Template for PowerPoint & Google Slides
Revenue
Dynamic Growth Arrow Step Infographic Template for PowerPoint & Google Slides
Process
Plant Growth Lifecycle Infographic Template for PowerPoint & Google Slides
Process
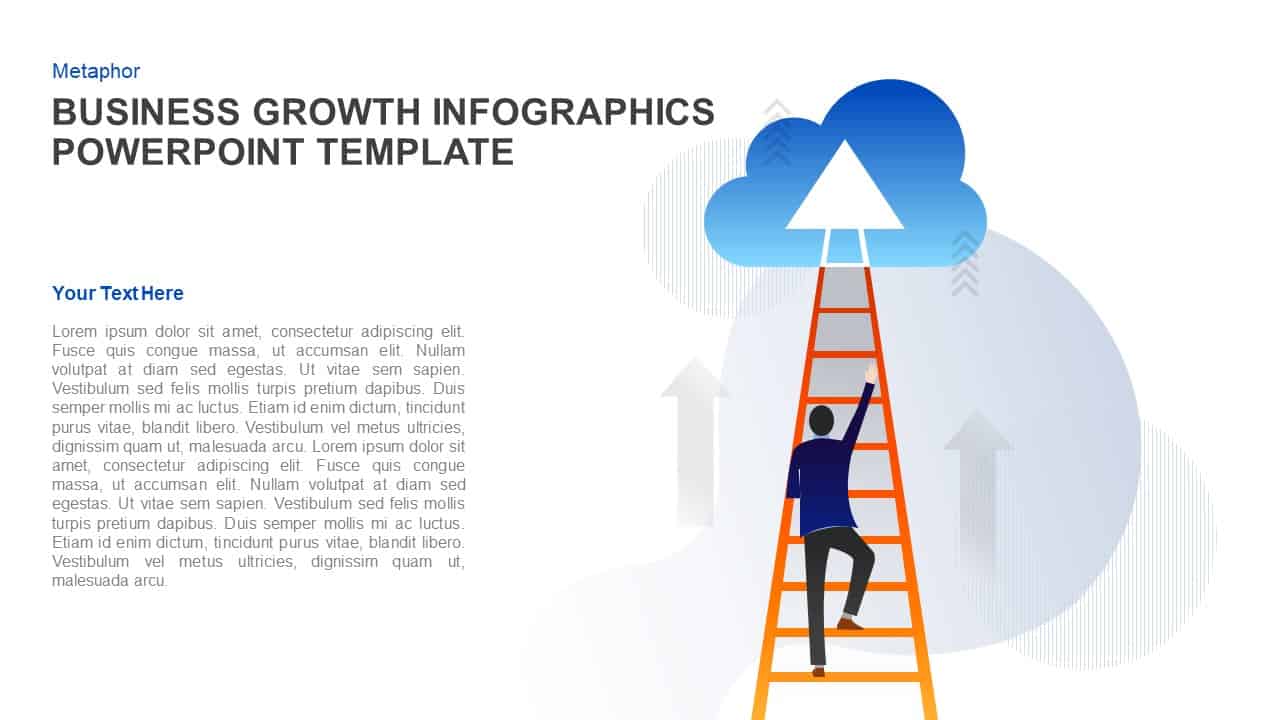
Business Growth Ladder to Cloud Metaphor Template for PowerPoint & Google Slides
Vision and Mission
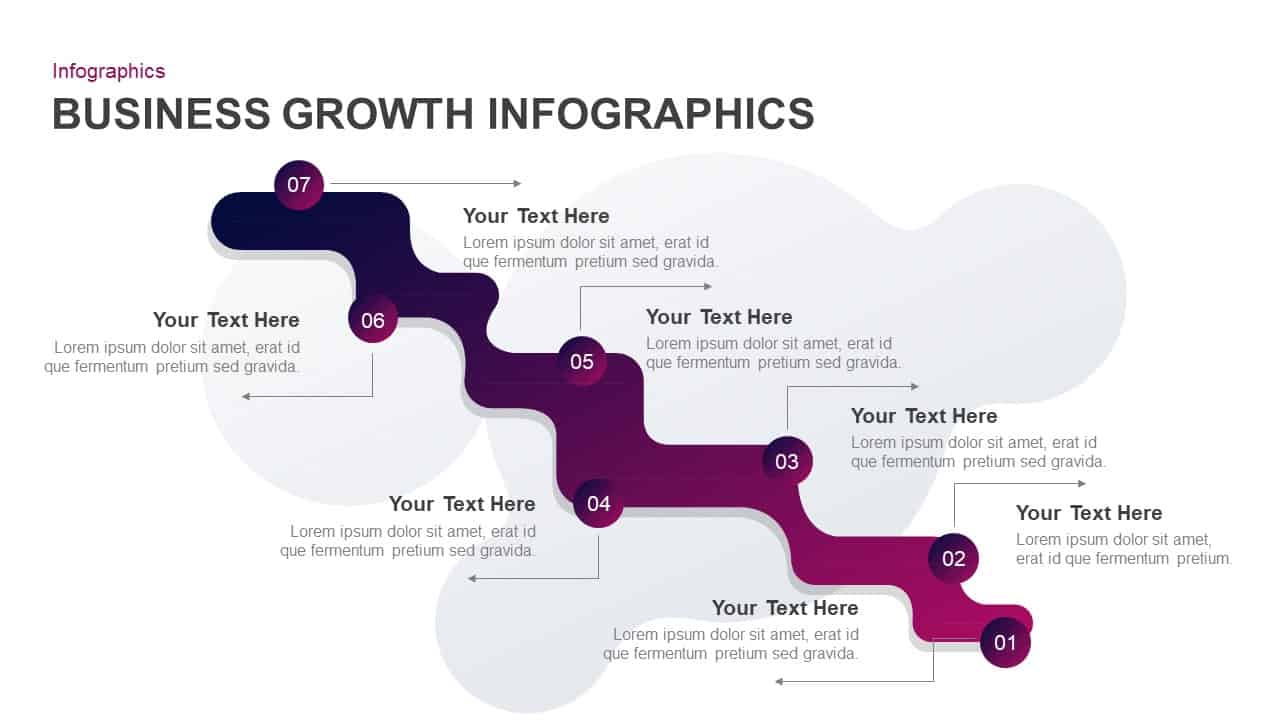
Business Growth Infographics Template for PowerPoint & Google Slides
Roadmap
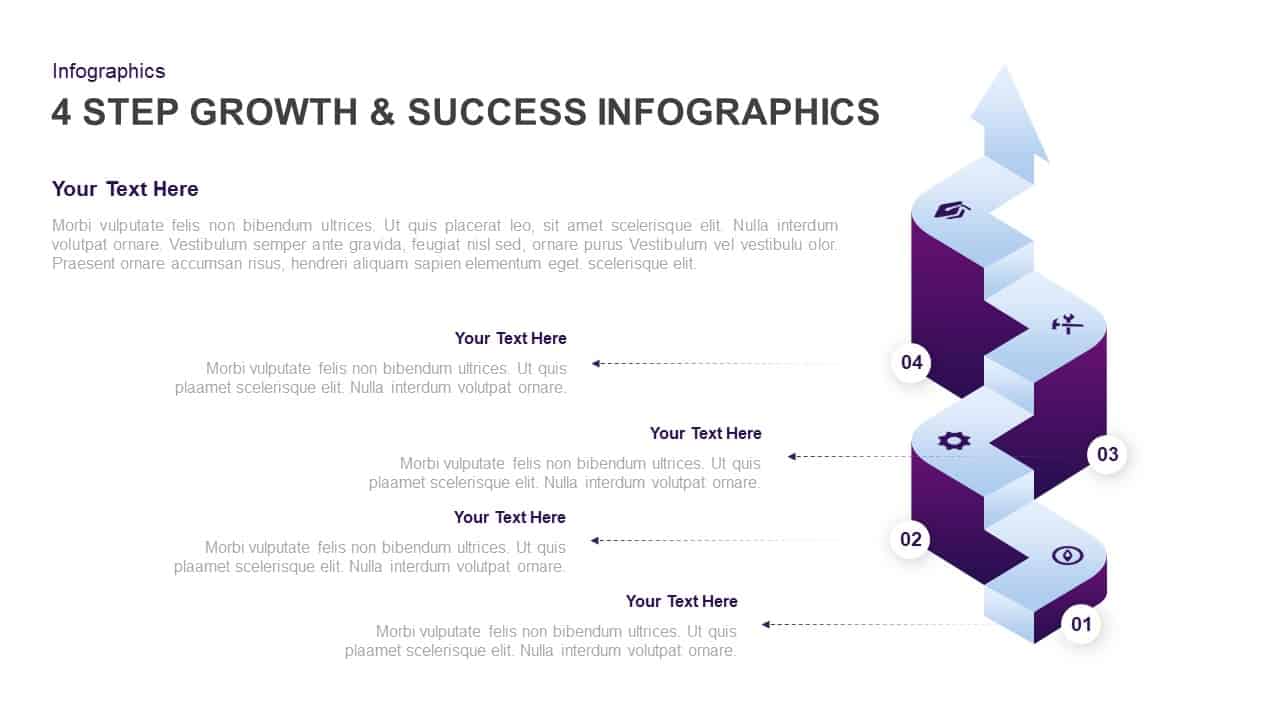
4-Step Growth & Success Infographics Template for PowerPoint & Google Slides
Accomplishment
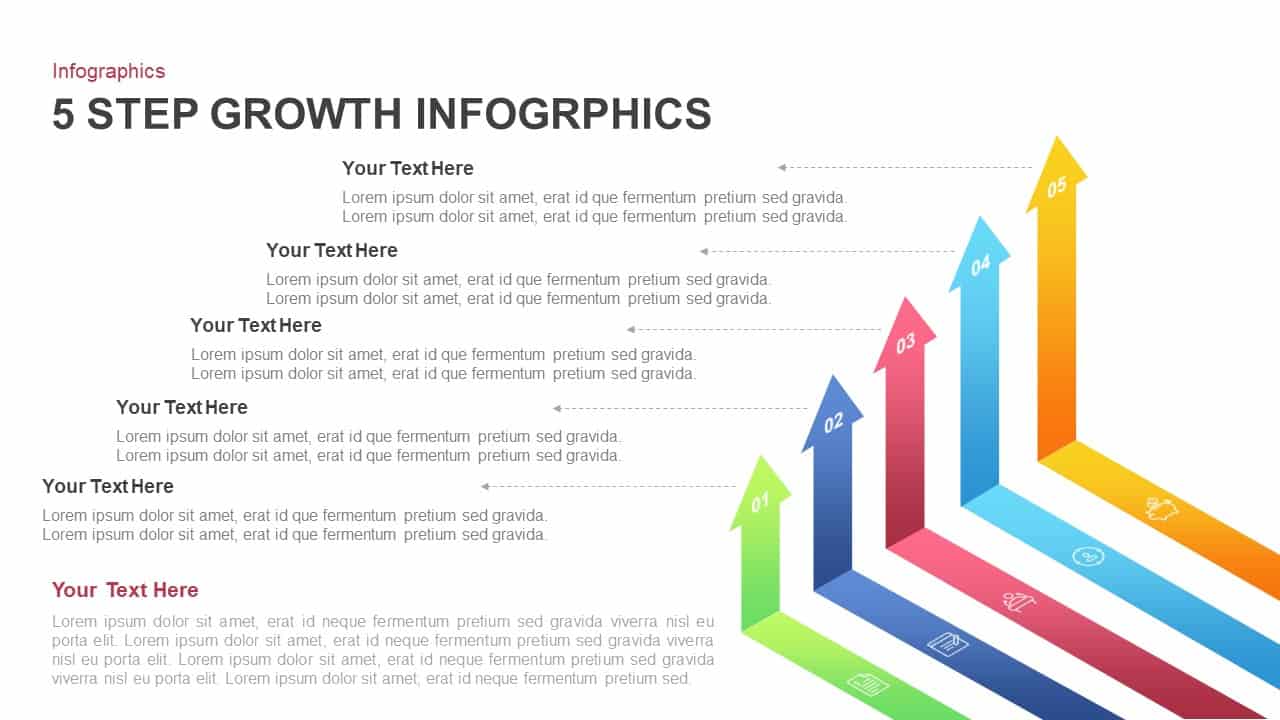
5-Step Growth Arrow Infographics Template for PowerPoint & Google Slides
Arrow
Five-Step Growth Timeline Infographic Template for PowerPoint & Google Slides
Timeline
Greiner Growth Model Six-Phase Diagram Template for PowerPoint & Google Slides
Business Models
Sales Growth Dashboard: KPI Gauge & Line Template for PowerPoint & Google Slides
Revenue
5-Stage Financial Growth Timeline Template for PowerPoint & Google Slides
Timeline

Ansoff Growth Matrix Strategy Diagram Template for PowerPoint & Google Slides
Business Strategy
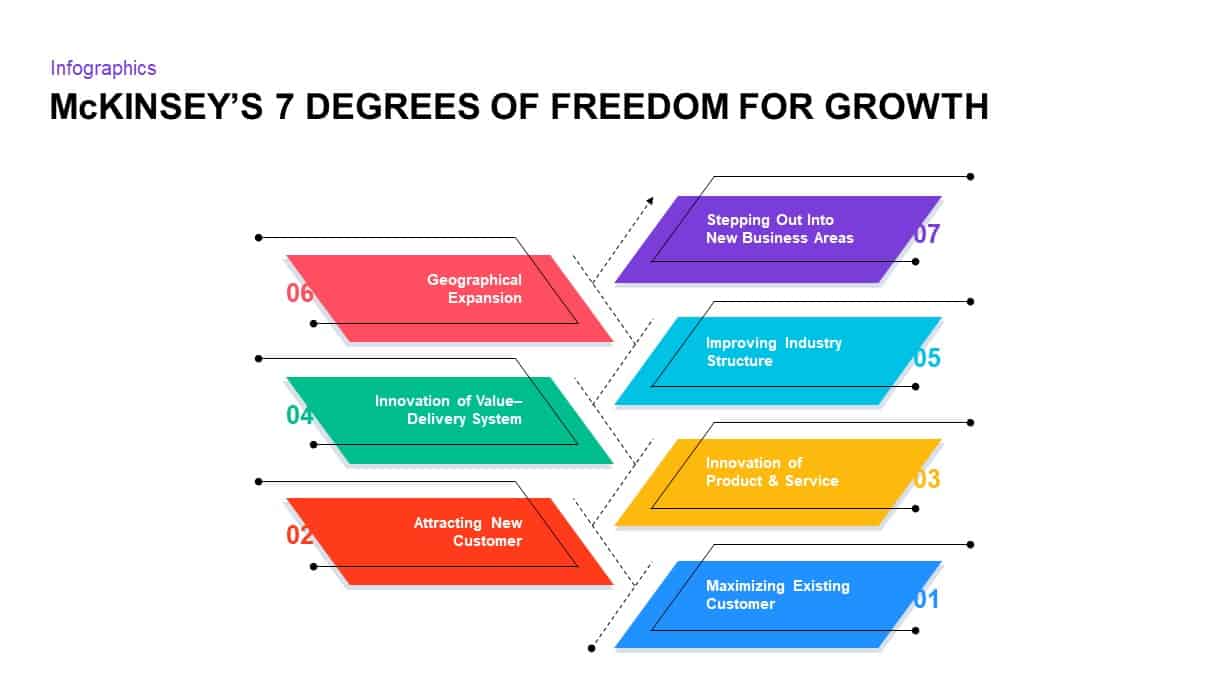
McKinsey’s 7 Degrees of Freedom Growth Template for PowerPoint & Google Slides
Process
Greiner’s Growth Model Curve template for PowerPoint & Google Slides
Infographics
Business Growth Plant Infographics Pack Template for PowerPoint & Google Slides
Process
Business Growth Metaphor Chart Template for PowerPoint & Google Slides
Business
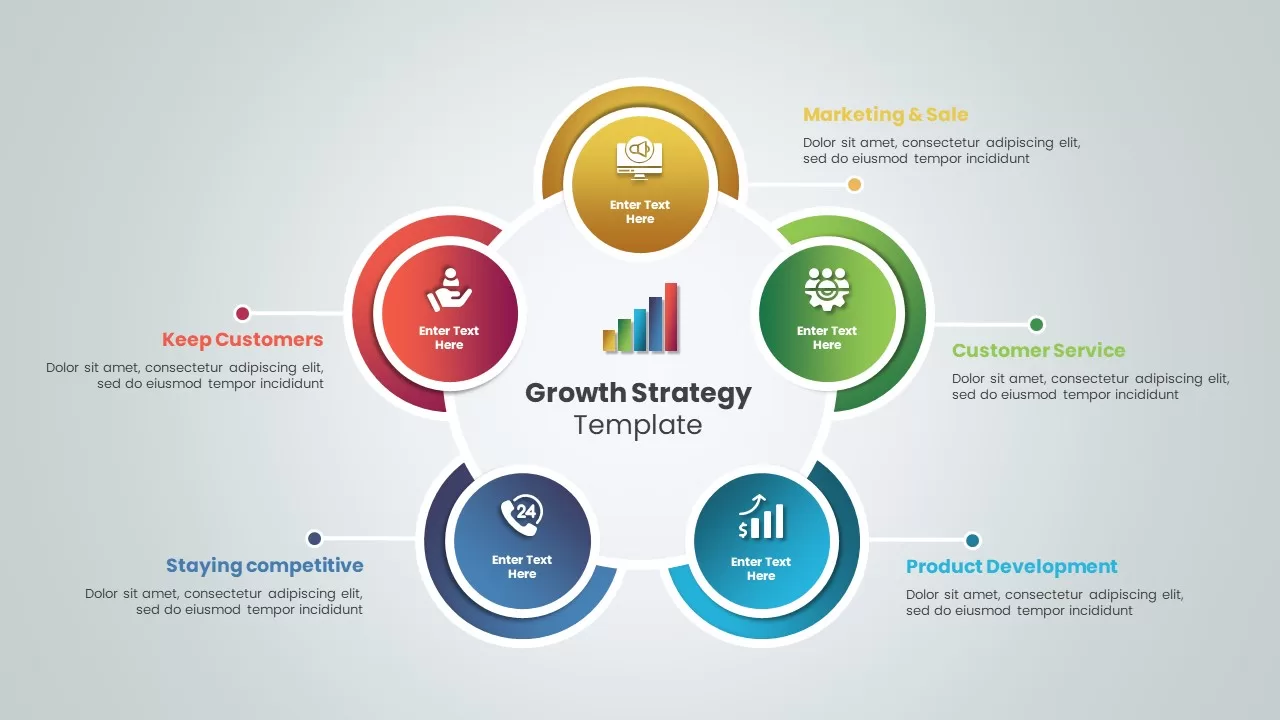
Growth Strategy Circular Diagram Template for PowerPoint & Google Slides
Circular
Data-driven GDP Growth Infographic Pack Template for PowerPoint & Google Slides
Infographics
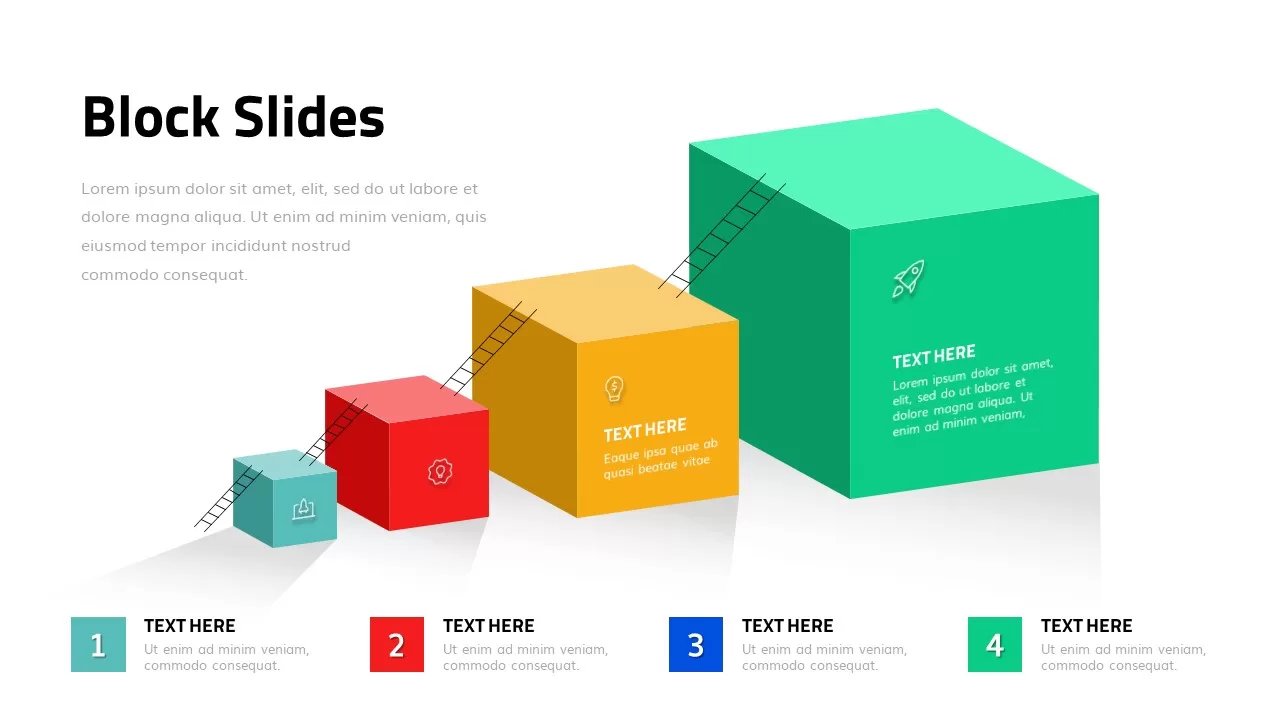
3D Growth Blocks Template for PowerPoint & Google Slides
Process
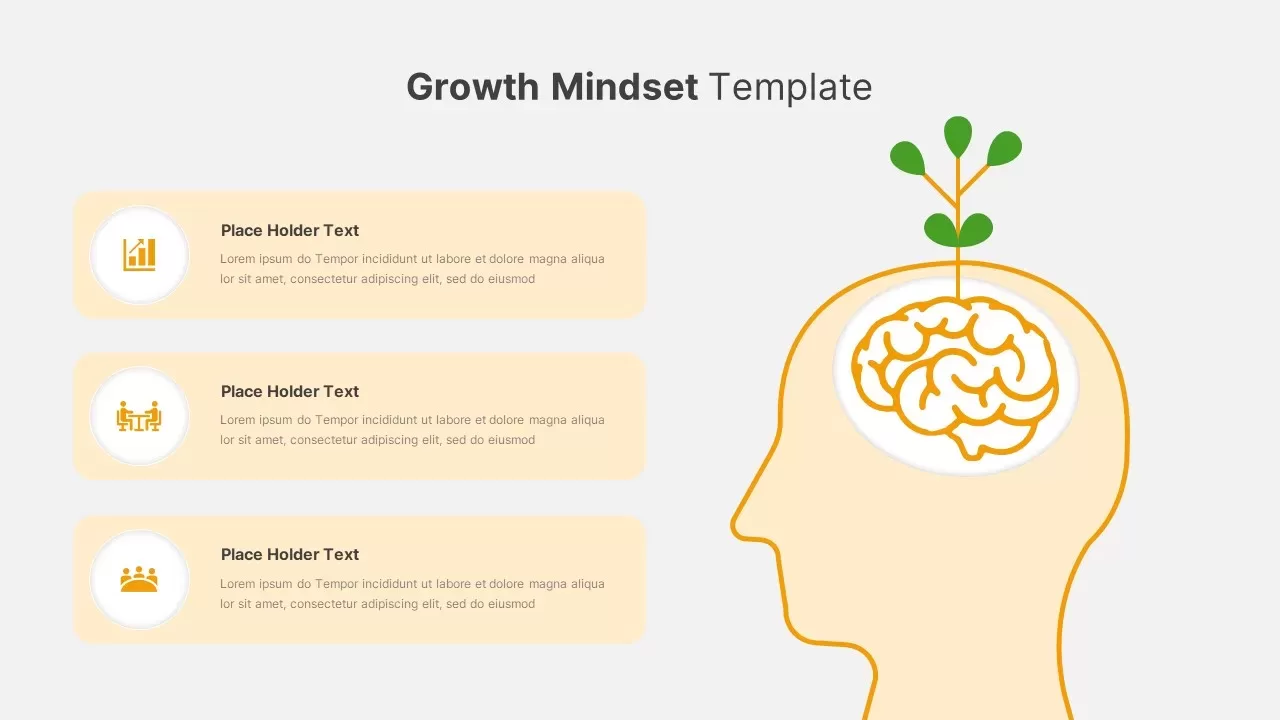
Growth Mindset Illustration Template for PowerPoint & Google Slides
Goals
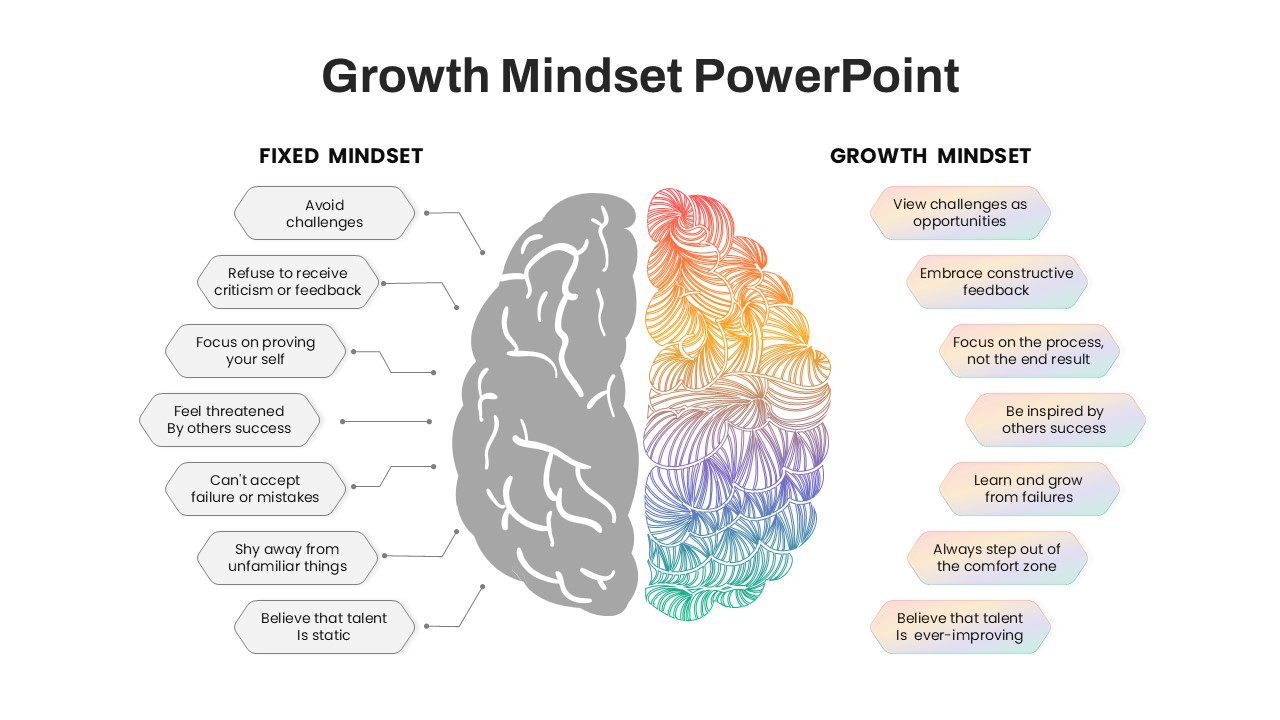
Growth vs Fixed Mindset Diagram Template for PowerPoint & Google Slides
Comparison
Three-Stage S Curve Growth Diagram Template for PowerPoint & Google Slides
Process
Growth Curve Line Chart Visualization Template for PowerPoint & Google Slides
Charts
Dynamic Investment & Finance Growth Template for PowerPoint & Google Slides
Finance
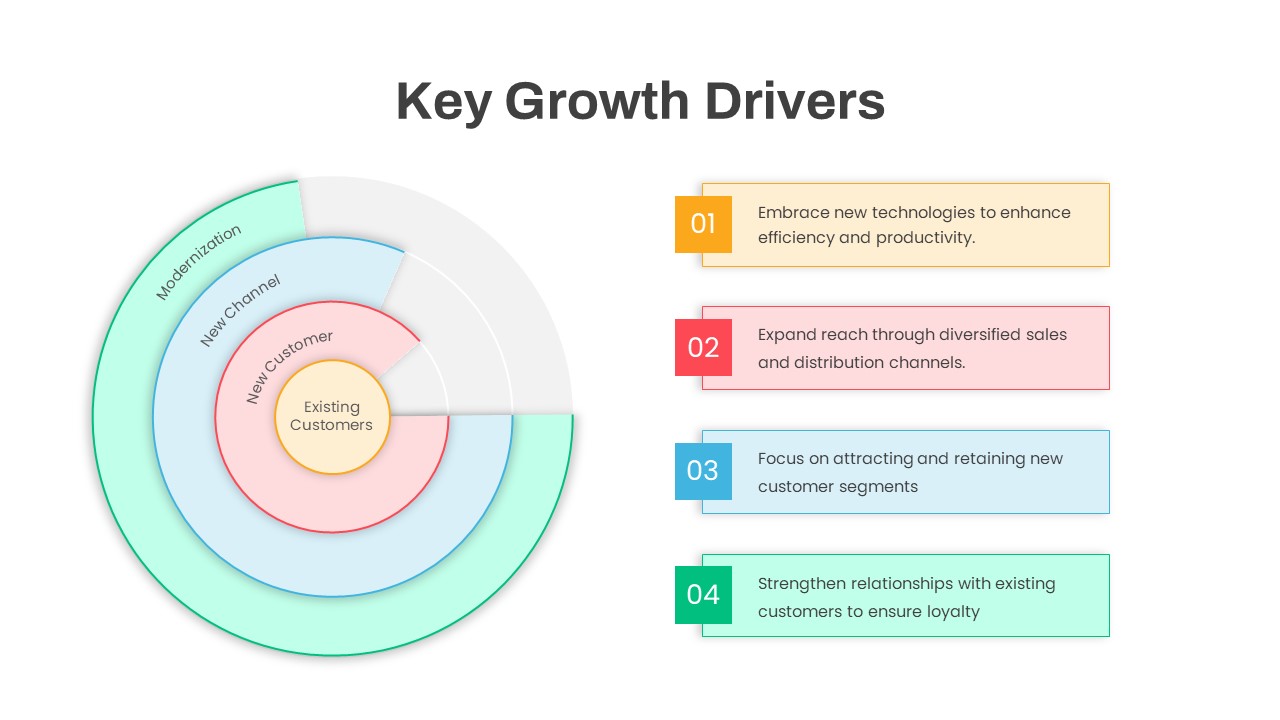
Circular Key Growth Drivers Diagram Template for PowerPoint & Google Slides
Circular
Business Growth Strategies Matrix Template for PowerPoint & Google Slides
Comparison

Growth Plant Nurture Business Development Template for PowerPoint & Google Slides
Decks
Annual Growth Trend Analysis Chart template for PowerPoint & Google Slides
Business Report
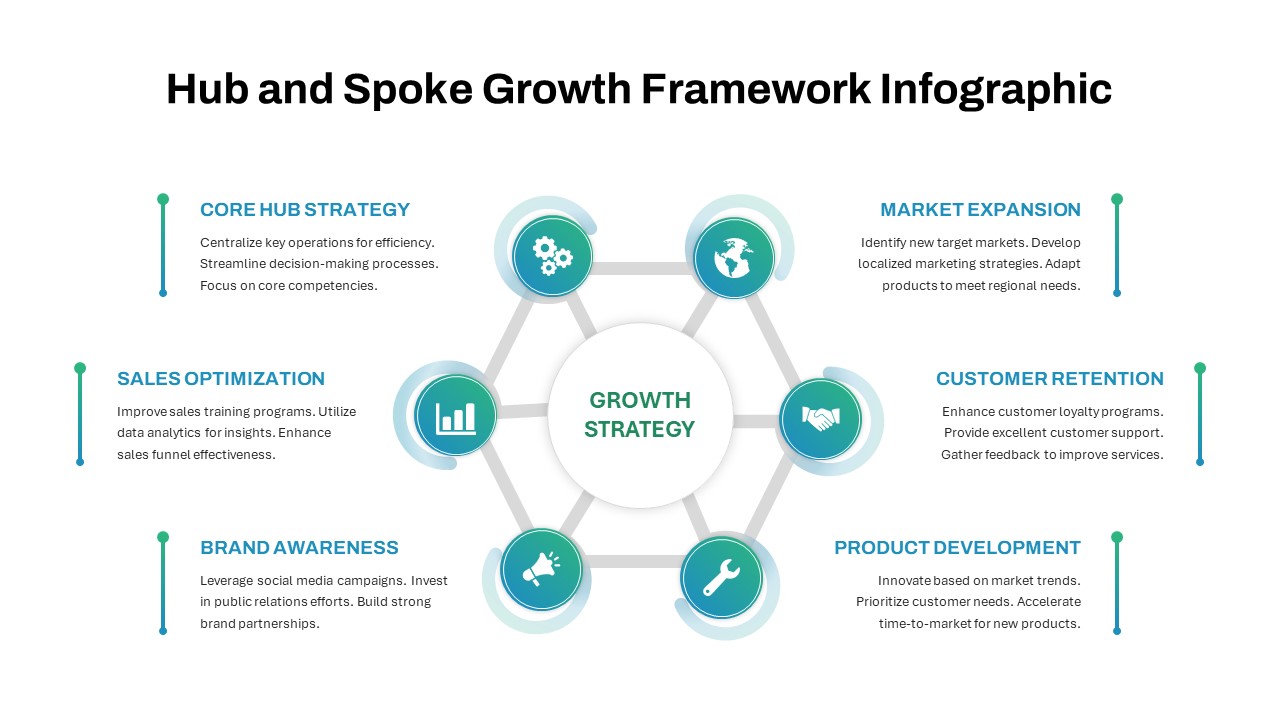
Hub and Spoke Growth Framework Template for PowerPoint & Google Slides
Circular

Quarterly Net Interest Income Growth Template for PowerPoint & Google Slides
Bar/Column
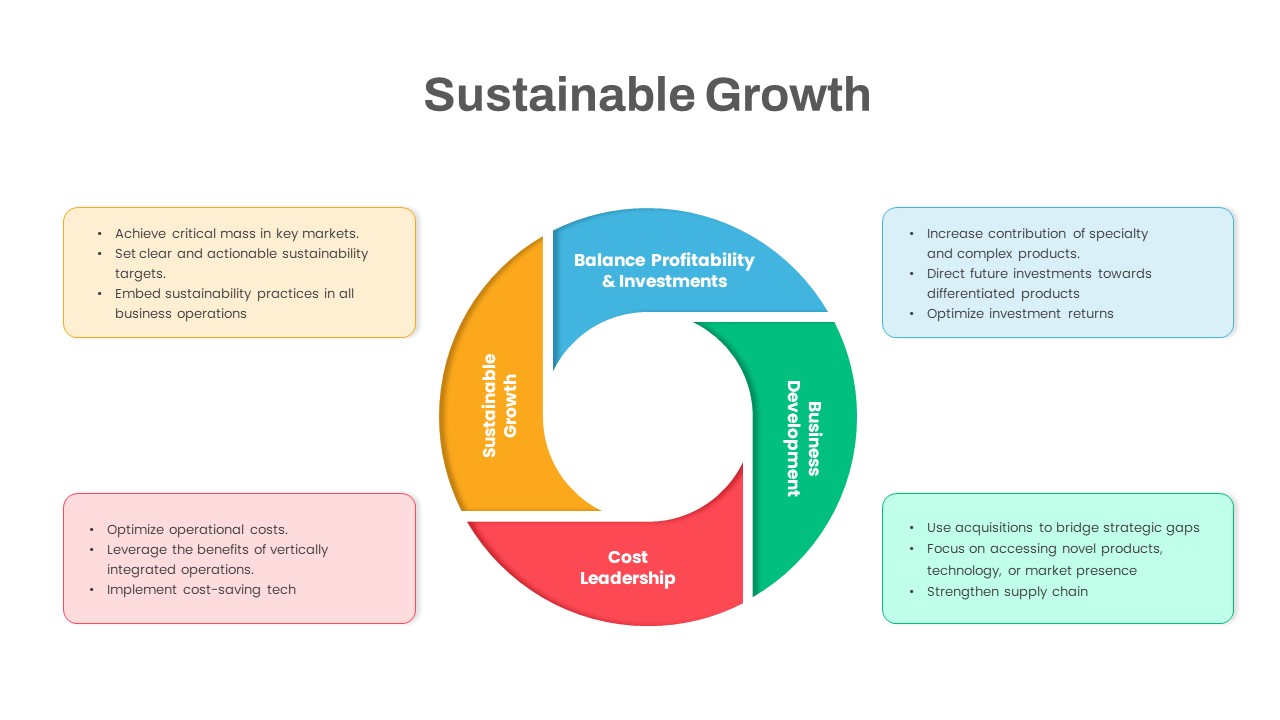
Sustainable Growth Circular Diagram Template for PowerPoint & Google Slides
Circular
Fixed vs Growth Mindset Matrix Template for PowerPoint & Google Slides
Comparison
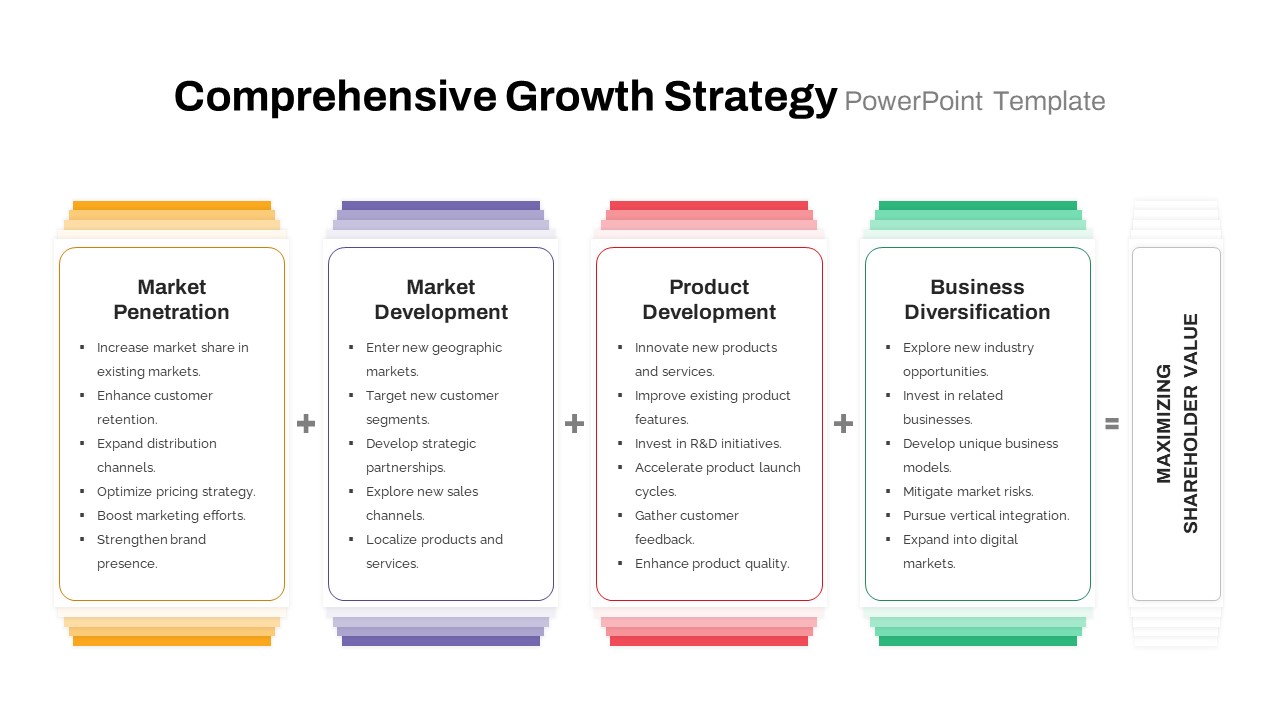
Comprehensive Growth Strategy Cards Template for PowerPoint & Google Slides
Infographics
Ansoff Growth Matrix Professional Template for PowerPoint & Google Slides
Comparison
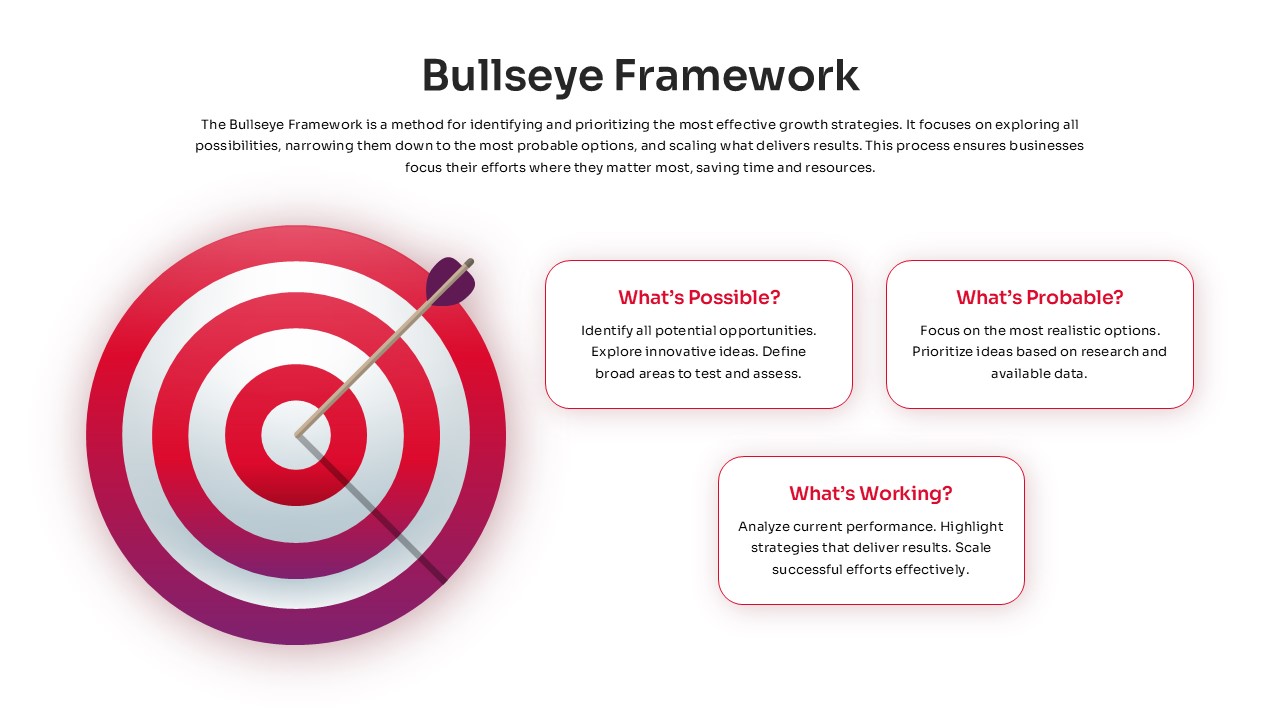
Bullseye Framework Growth Strategy Template for PowerPoint & Google Slides
Business Strategy
Modern Growth Hacking Venn Diagram Template for PowerPoint & Google Slides
Circular
Seeds Growth Cycle Business Model Template for PowerPoint & Google Slides
Process
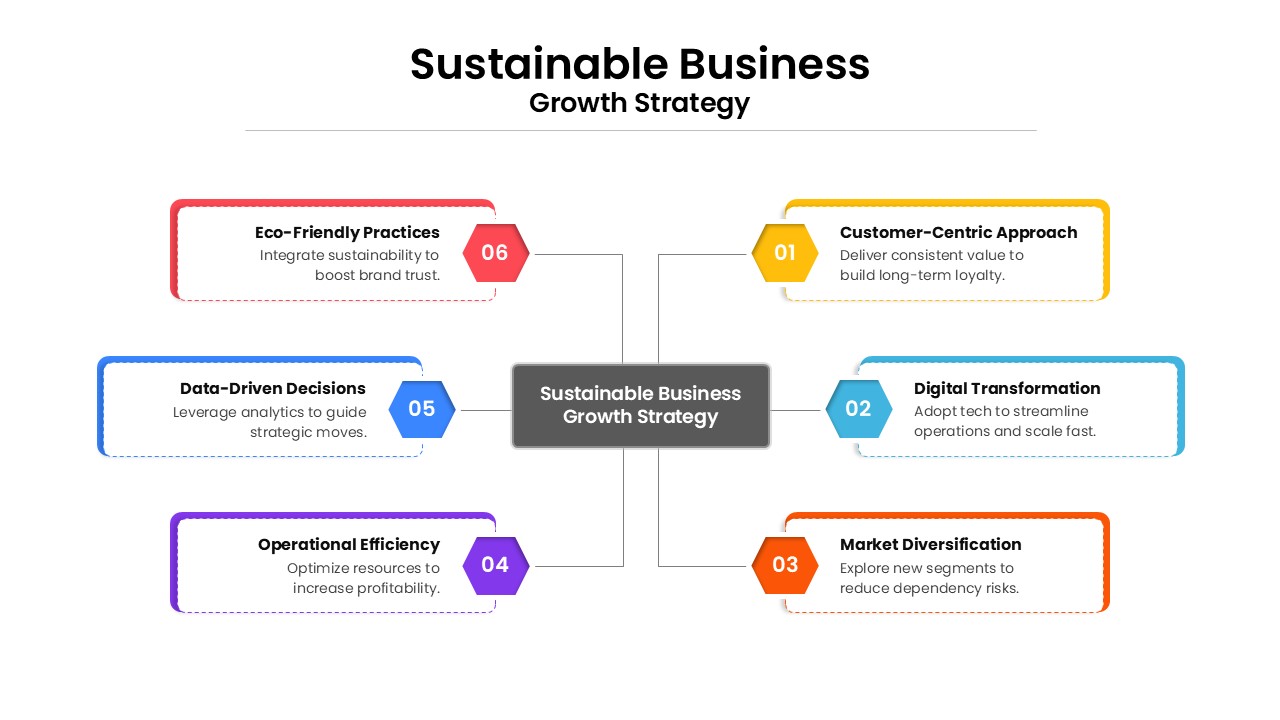
Sustainable Business Growth Strategy Template for PowerPoint & Google Slides
Process
Sales Growth Comparison Chart & Table Template for PowerPoint & Google Slides
Bar/Column
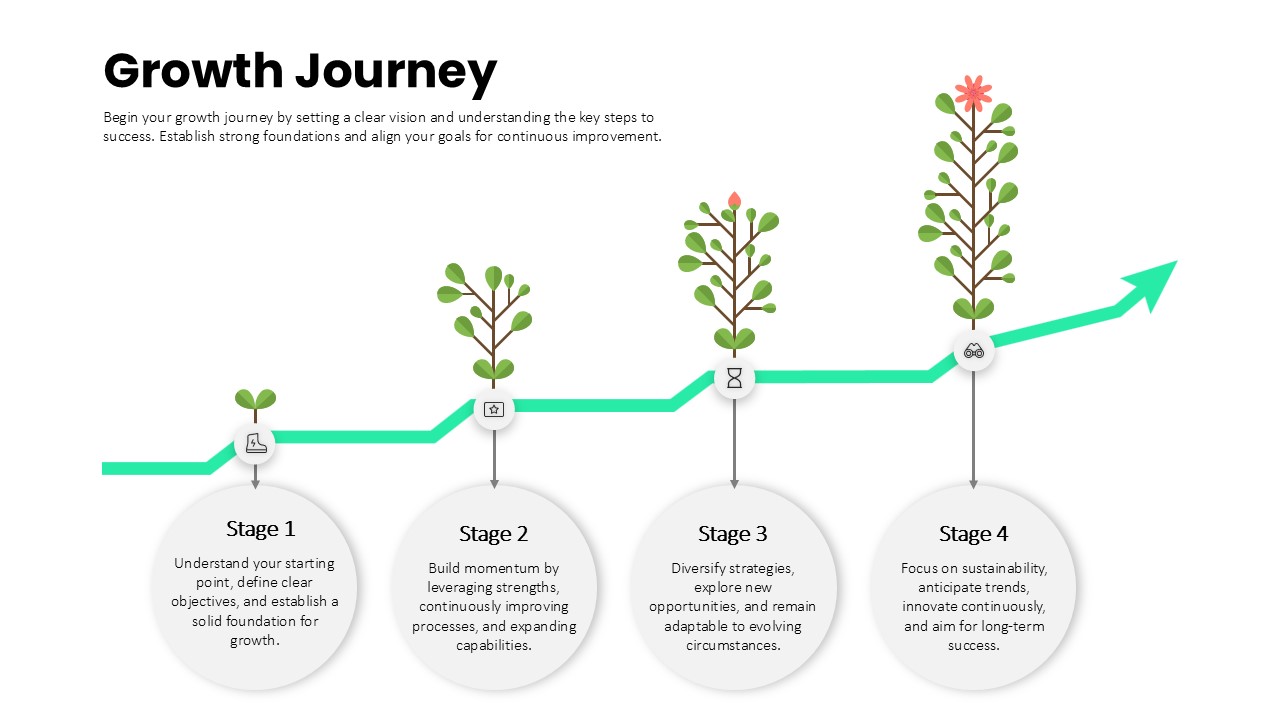
Growth Journey Stages Process template for PowerPoint & Google Slides
Business Strategy
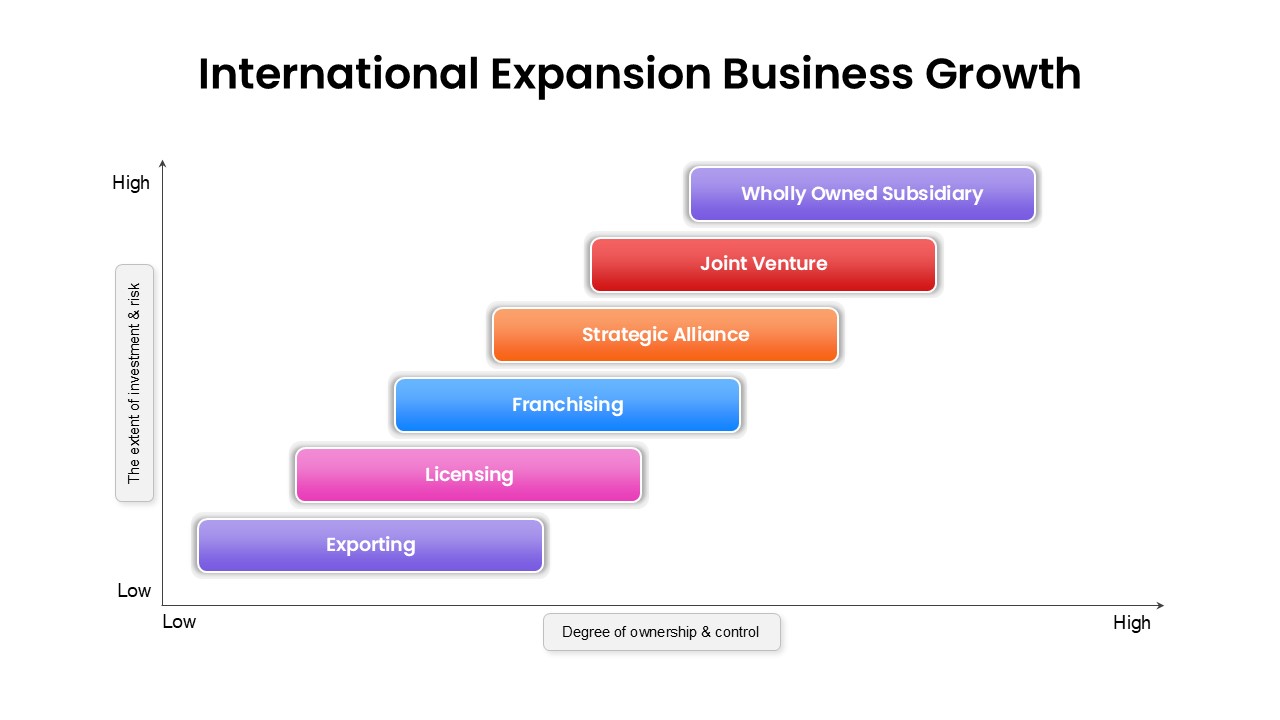
International Expansion Business Growth template for PowerPoint & Google Slides
Business Strategy
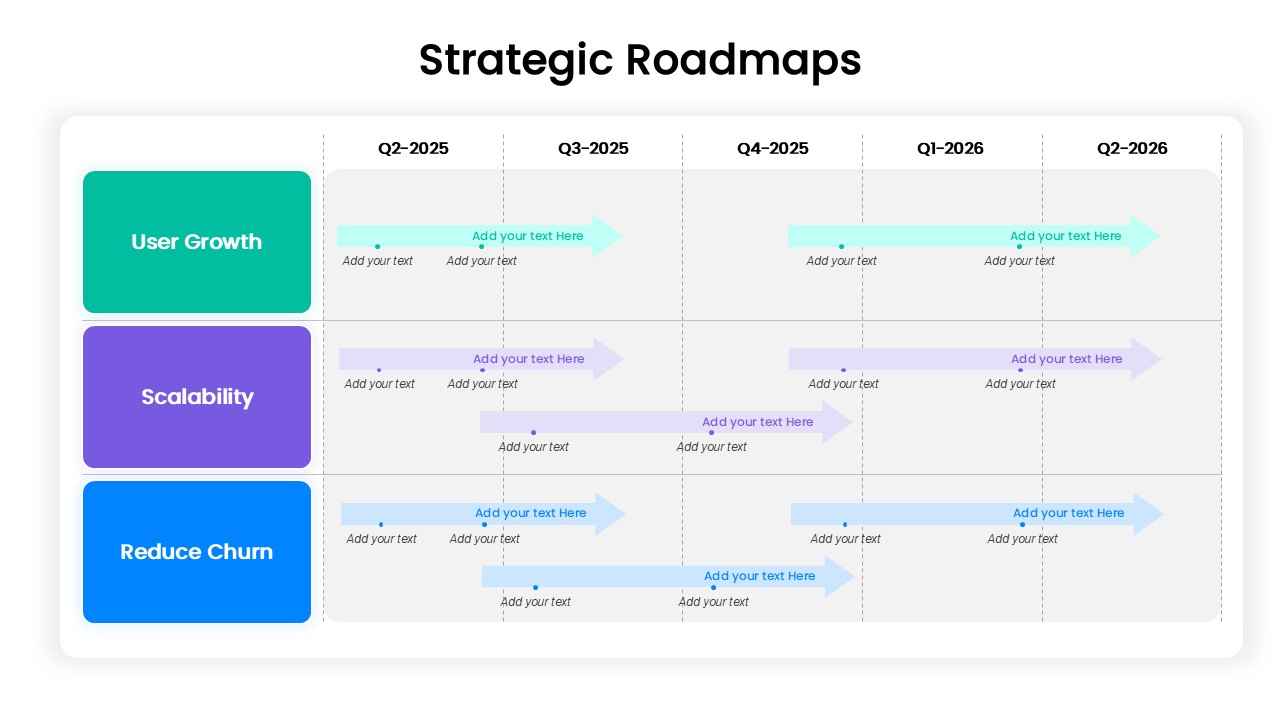
Strategic Roadmap for User Growth, Scalability, and Reducing Churn template for PowerPoint & Google Slides
Business
Flywheel Growth Cycle Diagram Template for PowerPoint & Google Slides
Circular
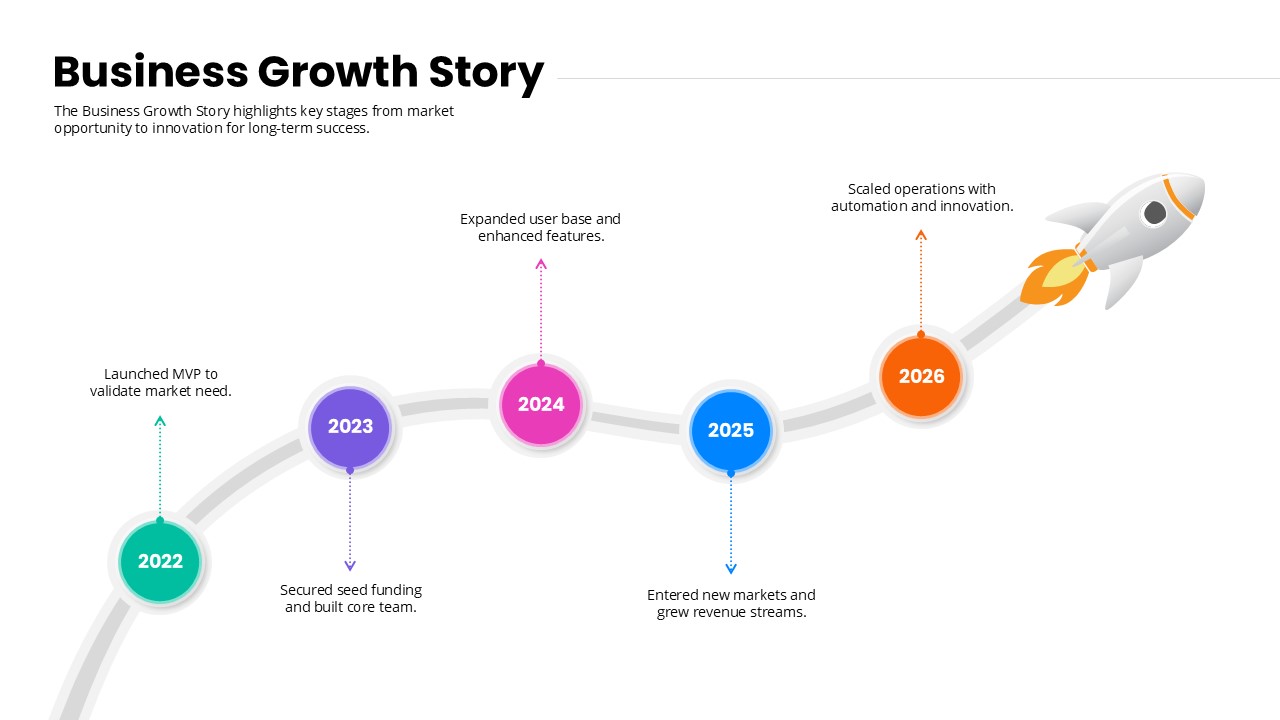
Business Growth Story timeline template for PowerPoint & Google Slides
Timeline
Personal Growth Overview Template for PowerPoint & Google Slides
Business
Ansoff Growth Matrix Template for PowerPoint & Google Slides
Business Strategy
Success and Growth Stair Arrow Diagram for PowerPoint & Google Slides
Process
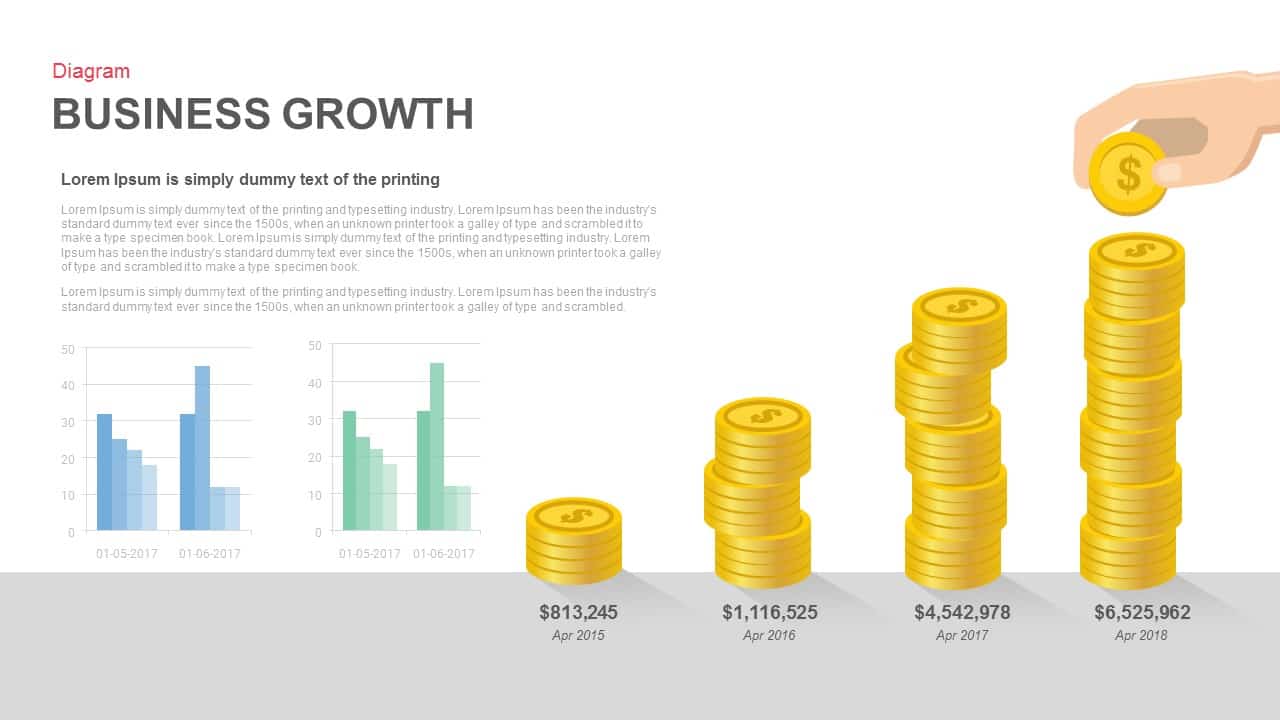
Business Growth Diagram for PowerPoint & Google Slides
Business Models
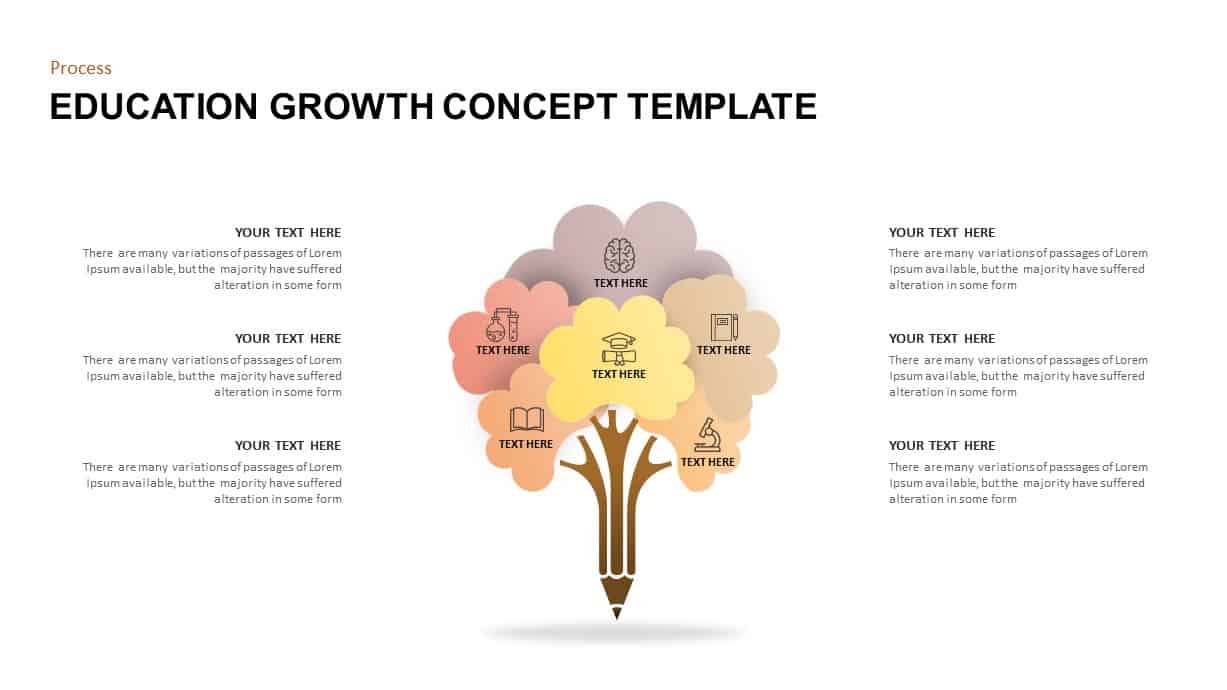
Education Growth Concept Diagram for PowerPoint & Google Slides
Process
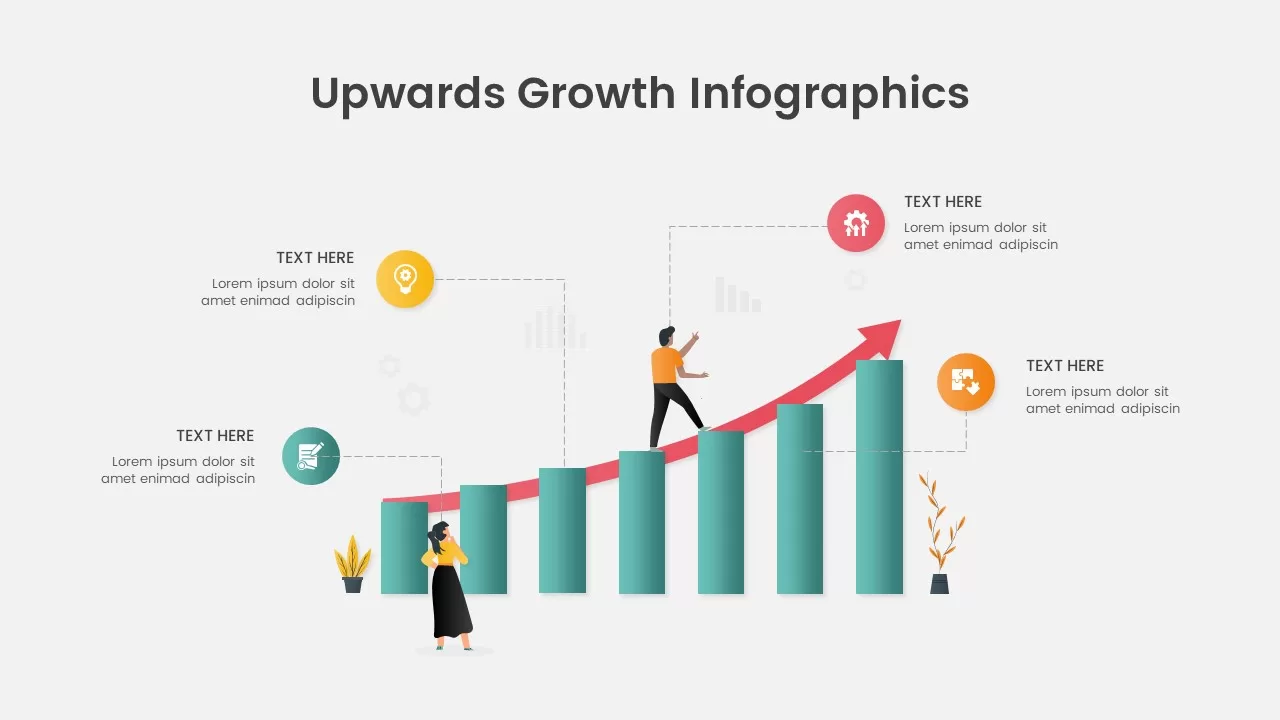
Upwards Growth Infographics for PowerPoint & Google Slides
Infographics
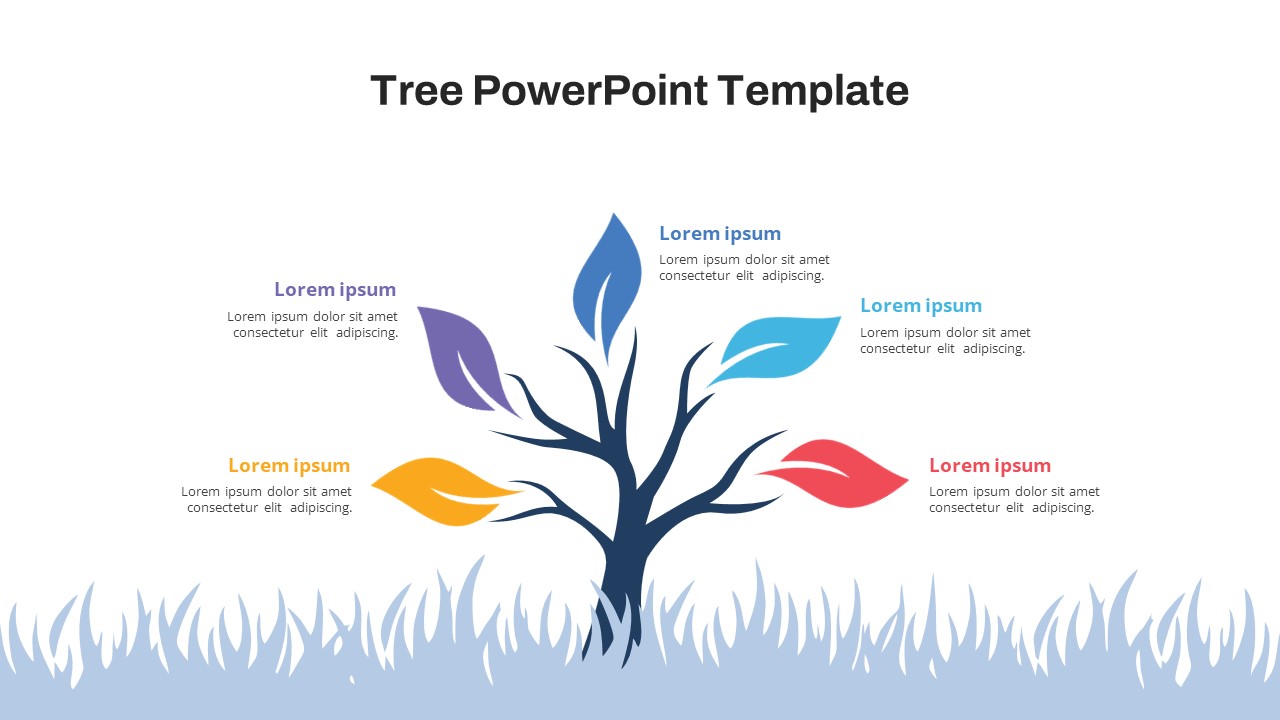
Free Colorful Tree Diagram for Growth & Strategy in PowerPoint & Google Slides
Infographics
Free
Business Growth and Partnership Background for PowerPoint & Google Slides
Business