Graphic Organizer PPT Template


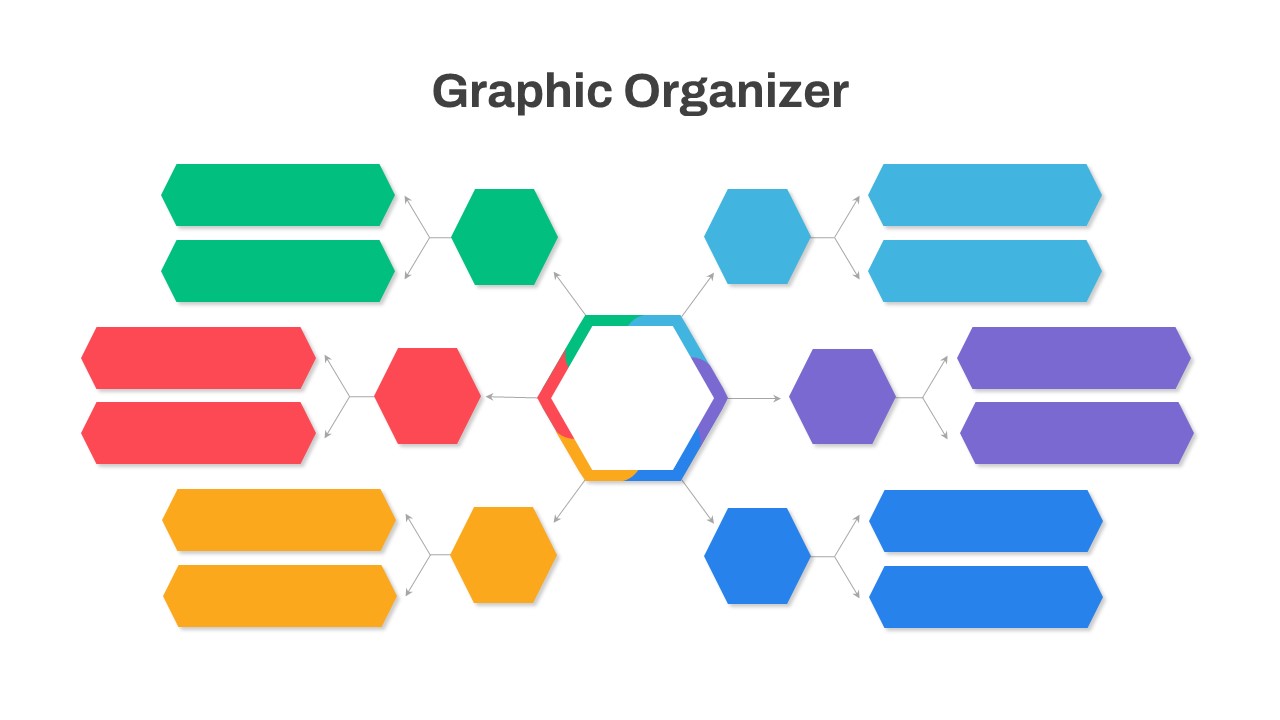
Leverage this versatile slide deck to craft clear, visually engaging graphic organizers and comparative bubble maps in your presentations. The first layout features a central hexagon hub with six color-coded branches and paired text bars—ideal for mind maps, concept breakdowns, and hub-and-spoke diagrams. The second layout presents a hierarchical organizer with icon placeholders above four editable content blocks, perfect for process flows, category breakdowns, or feature lists. The third layout is a double bubble map, offering side-by-side comparison with two central nodes, six comparison circles, and five connecting text bars for shared and unique attributes.
All shapes and connectors are vector-based and fully editable on master slides: swap colors, adjust node counts, replace icons, or restyle fonts in seconds to match your brand. The clean white background and consistent drop-shadow effects ensure your content remains the focal point, while ample whitespace supports readability in both live and printed formats. Built for seamless exports and collaborative editing, this template preserves layout integrity across PowerPoint and Google Slides.
Whether you’re visualizing brainstorming outcomes, comparing competitive products, mapping organizational roles, or outlining strategic frameworks, these three infographic layouts streamline your storytelling and enhance audience comprehension.
Who is it for
Educators, consultants, business analysts, project managers, instructional designers, and marketing teams will benefit from these layouts when structuring ideas, illustrating relationships, and conducting side-by-side comparisons in workshops, training sessions, and stakeholder briefings.
Other Uses
Beyond concept mapping and comparisons, repurpose these slides for stakeholder mapping, customer journey breakdowns, SWOT elaborations, decision trees, feature prioritizations, or KPI dashboards. Expand or collapse nodes as needed to fit any data-driven narrative.
Login to download this file


