gdp powerpoint slides


Description
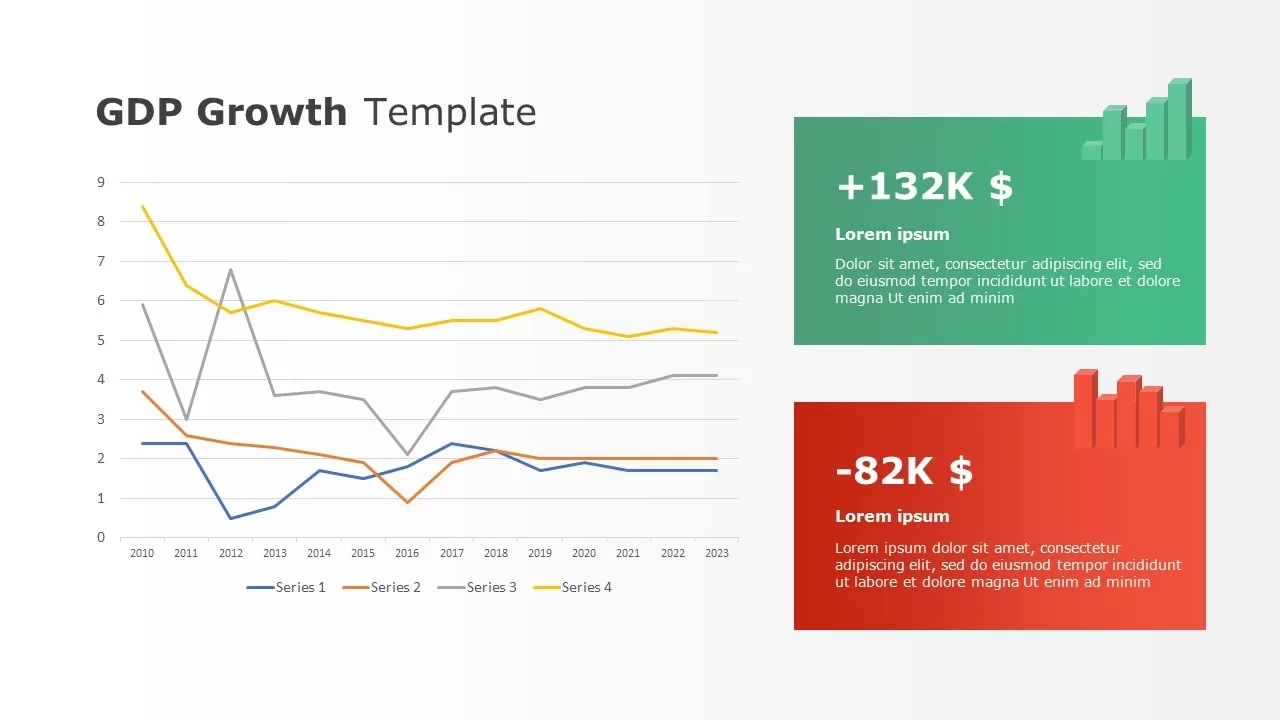
Leverage this dynamic 2-slide infographic pack to visualize GDP growth trends and key financial metrics with clarity and impact. The first slide presents a compelling narrative element with ascending coin stacks, directional arrows, and comparative callouts—displaying negative and positive growth values against light blue panels. Customizable icons and placeholder text allow you to highlight areas of contraction and expansion, annotate macroeconomic insights, or illustrate the effects of policy changes. The second slide features a clean line chart spanning 2010–2023 with four data series, accompanied by two vibrant gradient panels in green and red to emphasize gains and losses. Each element is fully editable: adjust line weights, swap colors, resize placeholders, or update axis labels in seconds. The minimalist grid background and consistent typography ensure that your audience remains focused on the data, while subtle drop shadows and layered shapes add depth without distraction. Built-in master slide layouts streamline formatting workflows, so you can duplicate, reorder, or rebrand slides across any PowerPoint or Google Slides project. Pre-built infographic components include left and right-aligned information blocks, percentage icons, and timeline markers for contextualizing economic cycles. The customizable callouts support bullet lists, statistical highlights, or comparative analyses, making this pack ideal for investor briefings, board presentations, or classroom lectures. All vector elements maintain high resolution on any screen size, and linked data charts can be updated in real time using Google Sheets integration or Excel. Enhance stakeholder engagement by customizing color palettes to align with corporate branding or thematic reports.
Who is it for
Economists, financial analysts, corporate strategists, investment managers, and academic instructors who need to communicate GDP growth patterns, economic forecasts, and performance indicators clearly and persuasively to stakeholders, boards, clients, or students.
Other Uses
Use this pack to illustrate quarterly or annual performance reviews, project budget analyses, competitive benchmarking, risk assessments, or educational case studies. Adapt the layouts for regional comparisons, sectoral growth breakdowns, policy impact studies, or stakeholder briefing decks.
Login to download this file


