GA4 Reporting PowerPoint template for PowerPoint & Google Slides
Description
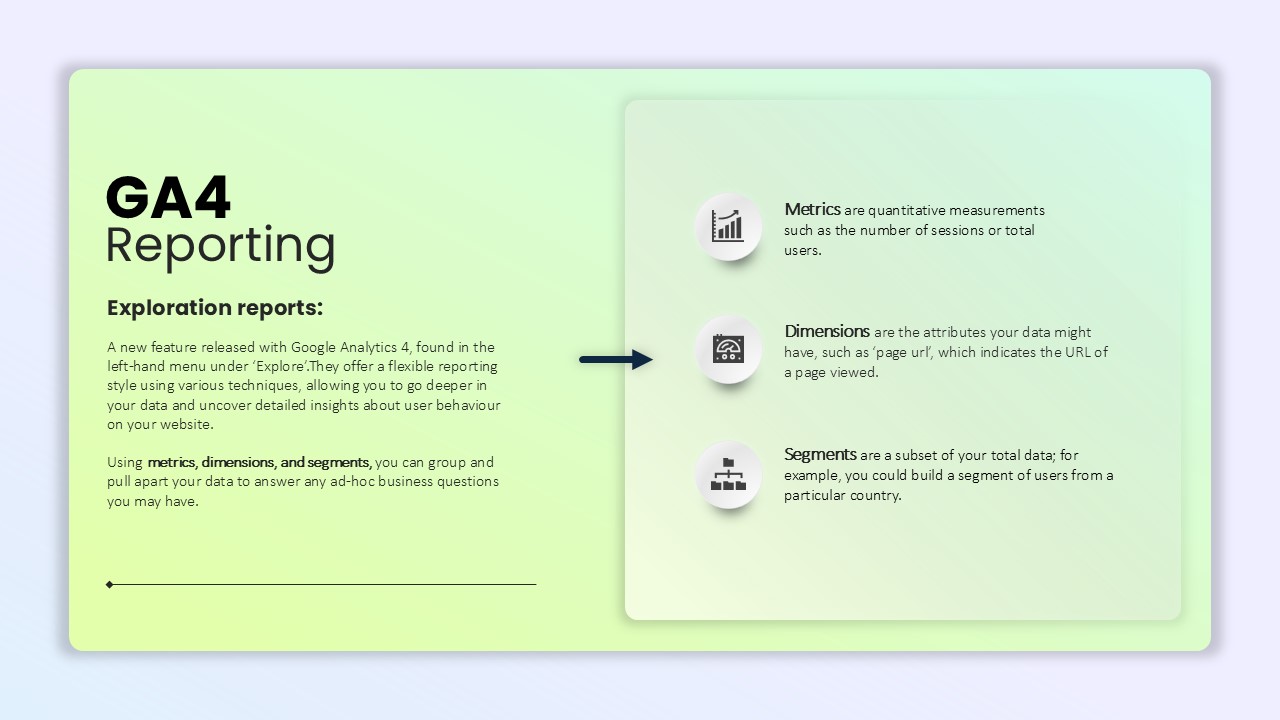
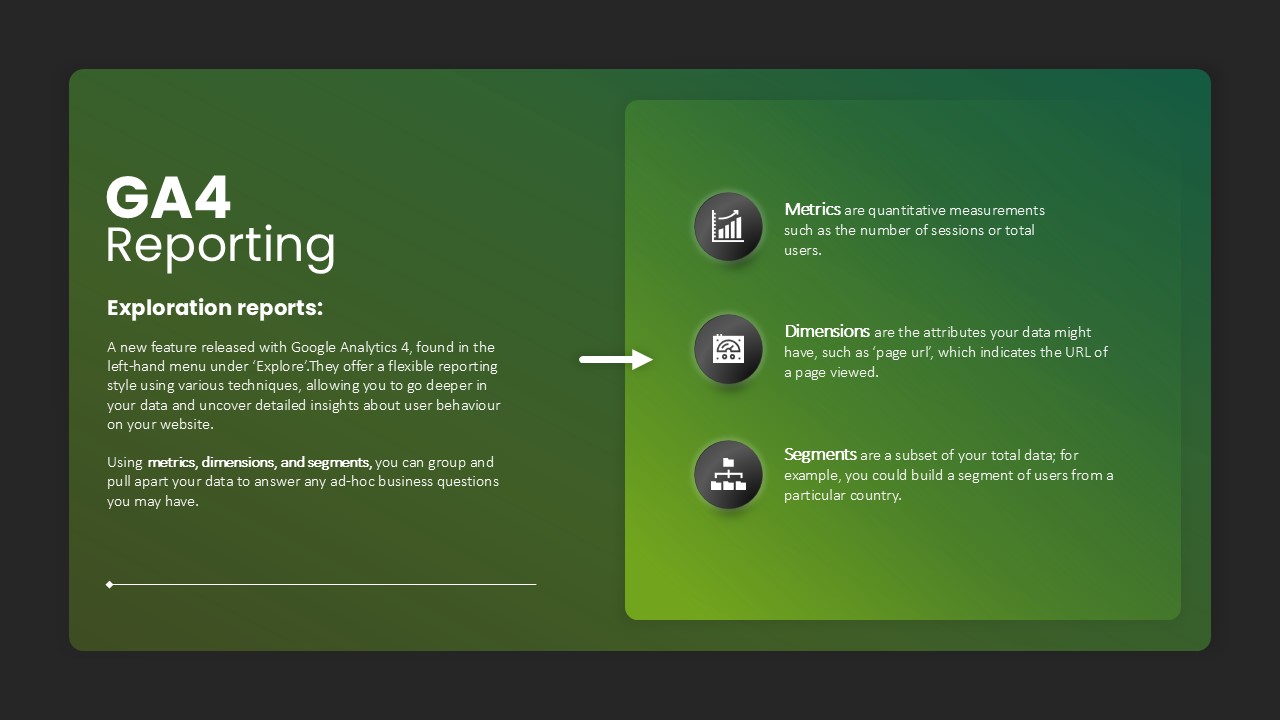
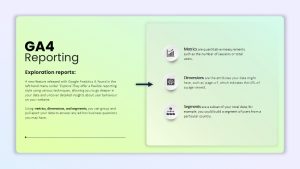
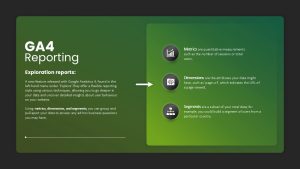
This GA4 Reporting slide template is designed to explain the Exploration reports feature available in Google Analytics 4 (GA4). These reports offer a flexible and detailed reporting style, allowing users to dive deeper into their website data and uncover insights regarding user behavior. The slide highlights key components of the exploration reports, including metrics, dimensions, and segments, which can be utilized to answer ad-hoc business questions. Metrics provide quantitative data, dimensions represent data attributes like URLs, and segments allow for the grouping of data subsets.
Perfect for marketing teams, analysts, or anyone working with GA4 data, this template is ideal for presentations where you need to explain the core elements of GA4 Exploration reports. It ensures clarity and helps audiences understand how to utilize metrics, dimensions, and segments to gain deeper insights into their website’s performance. The modern and clean design makes the information easy to digest, while icons and arrows guide the viewer through the GA4 reporting process.
Who is it for
This template is perfect for digital marketers, web analysts, product managers, and anyone responsible for analyzing or reporting website traffic using Google Analytics 4. It is also a great resource for those teaching GA4 reporting concepts, as it provides a clear, visual breakdown of the tools available in the platform.
Other Uses
Apart from Google Analytics 4 presentations, this template can be adapted for explaining other data analysis tools or reporting methods that involve metrics, dimensions, and segmentation. It can also be useful for educational purposes, training sessions, or as part of a larger digital marketing or analytics course.
Login to download this file

Item ID
SB05178