simple column chart powerpoint


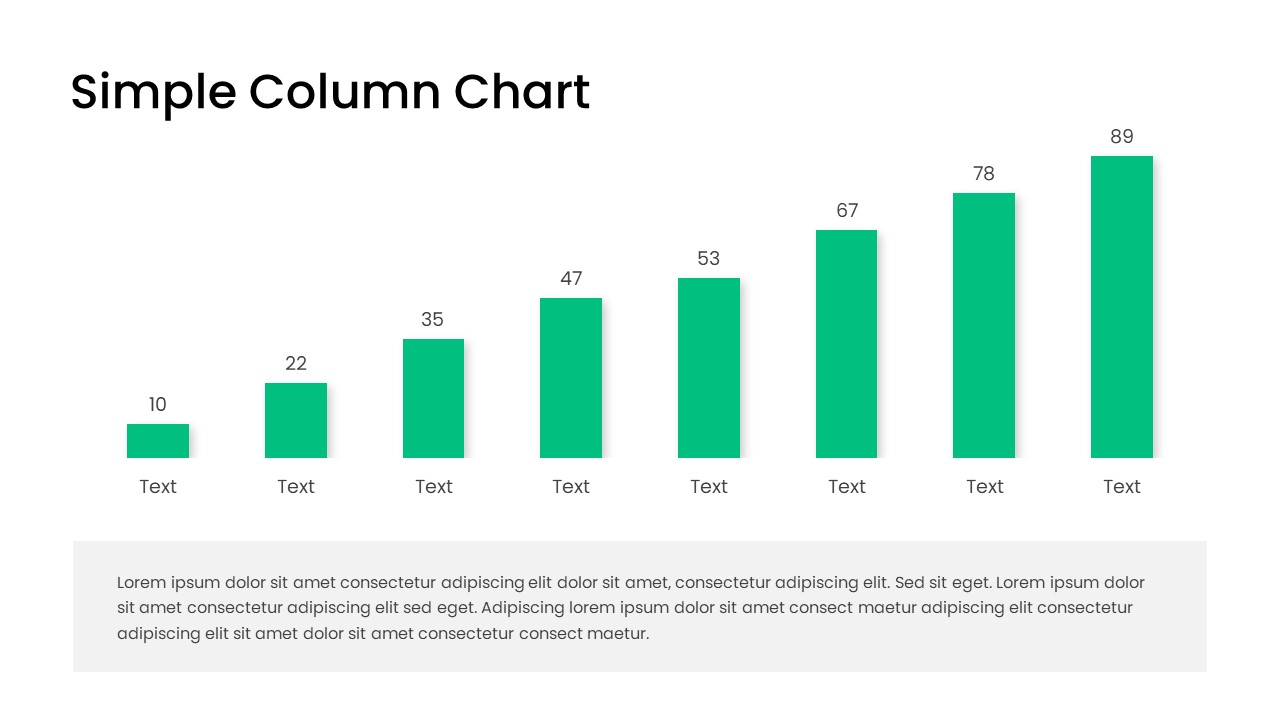
Enhance your data-driven presentations with this free, editable simple column chart slide for PowerPoint & Google Slides. This slide features eight vertical bars with customizable heights, colors, and category labels, enabling clear comparison across sequential data points. Each bar displays a data value above and placeholder text below, making it easy to input metrics like sales figures, survey results, or performance indicators. The minimalist flat design uses bold green bars on a white background with subtle shadows for depth, ensuring high contrast and readability on any device. A large note box beneath the chart offers space for descriptive insights, allowing presenters to highlight key trends, contextualize findings, or outline action items without cluttering the slide. Built with master slides and native chart objects, this asset maintains full editability, letting you adjust fonts, gridlines, and data ranges in seconds without losing resolution. You can quickly apply company color palettes or thematic gradients, adjust axis labels, and display data markers to match your presentation style. The built-in chart engine supports copy-paste data from Excel or Google Sheets for seamless updates.
Ideal for business meetings, board presentations, or client reports, this column chart template streamlines slide creation and facilitates data-driven storytelling. Whether you are tracking quarterly growth, comparing product performance, or visualizing survey outcomes, the intuitive layout quickly draws audience focus to your most critical metrics. Optimized for consistency, the chart inherits your theme colors and font styles, supporting both corporate branding and startup visuals. With seamless compatibility across PowerPoint and Google Slides, this slide guarantees flawless rendering and hassle-free collaboration, eliminating formatting discrepancies and version control issues. Save time and elevate your analytics communication by incorporating this polished simple column chart into your next presentation.
Who is it for
Business analysts, marketing teams, finance professionals, and project managers will benefit from this column chart slide to present performance data, benchmark results, and growth trends in a clear, concise format.
Other Uses
Beyond standard business reporting, use this slide to showcase academic research findings, track educational outcomes, visualize survey data, or illustrate experimental results. It also works well in training modules, quarterly reviews, and investor updates.
Login to download this file


