


free fishbone diagram ppt template

Description
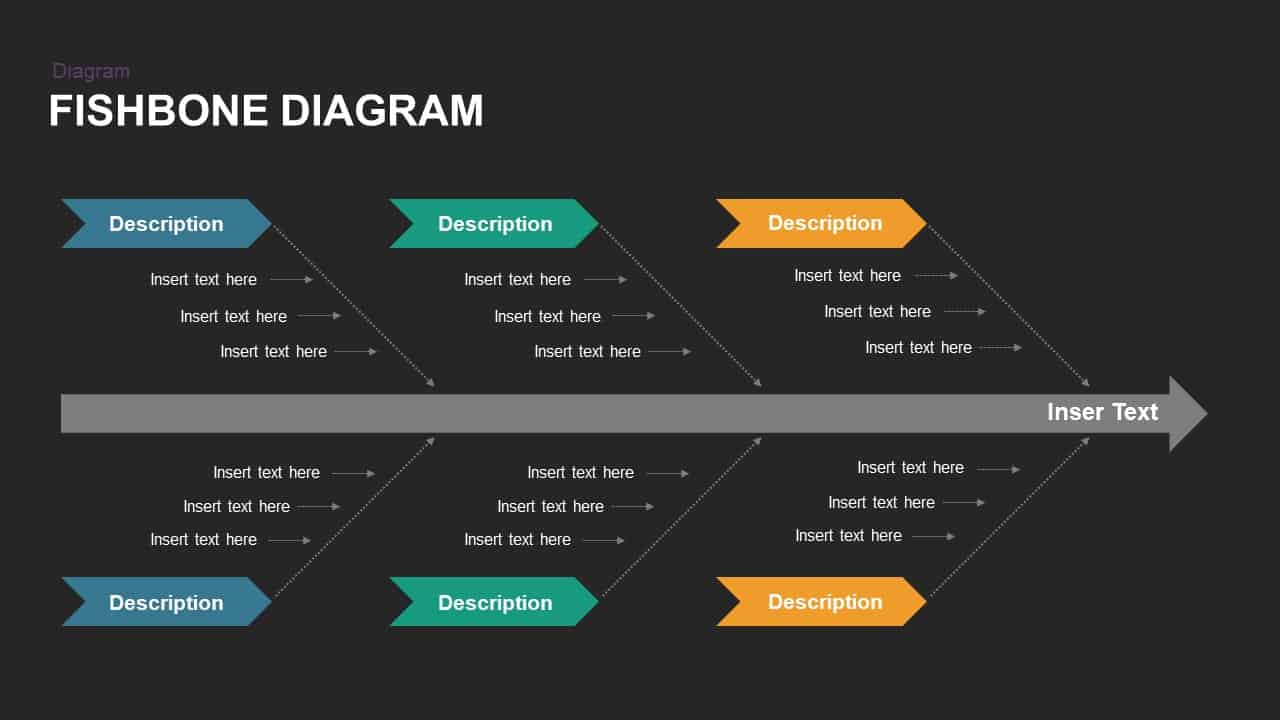
Identify root causes and streamline problem-solving discussions with this professional Fishbone Diagram template. Also known as an Ishikawa or cause-and-effect diagram, this slide uses a structured arrow format to visually categorize multiple contributing factors around a central problem or outcome. With six labeled branches—three on each side—color-coded in blue, green, and orange, users can easily distinguish between different categories of causes. Each branch includes multiple text placeholders for listing specific issues or contributing elements. The horizontal flow and clean layout support clear, logical communication during quality management presentations, root cause analysis, or strategic planning sessions.
Who is it for
This template is ideal for quality managers, process improvement teams, Six Sigma practitioners, engineers, analysts, and business consultants who need to identify and explain the root causes of issues in operational, product, or project environments. It’s also useful for educators teaching structured problem-solving methodologies.
Other Uses
In addition to traditional root cause analysis, use this diagram for project troubleshooting, brainstorming sessions, product development reviews, strategic planning, or risk assessments. It’s an effective tool for team workshops, training sessions, and executive presentations focused on continuous improvement or workflow optimization.
Login to download this file

Item ID
SBF00025