Free Timeline Infographics Dark


Description
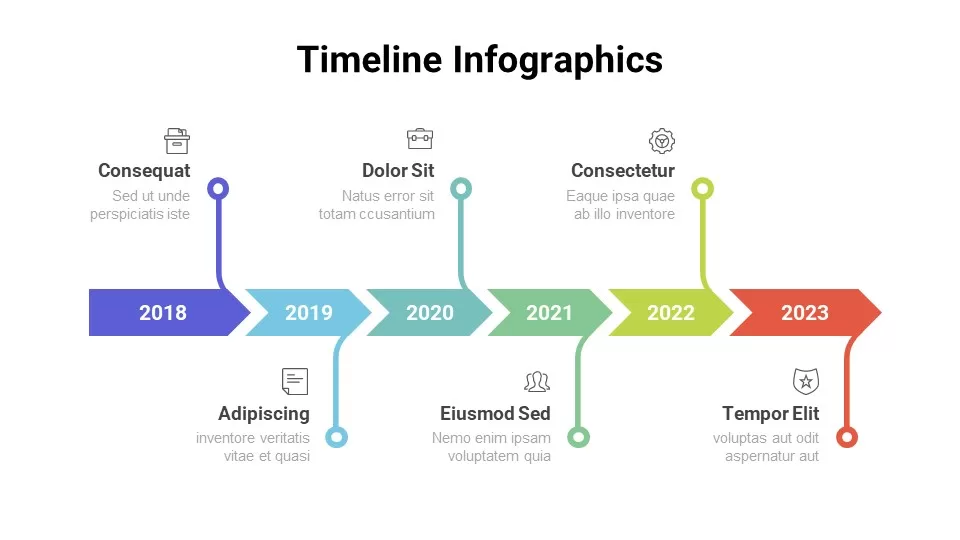
Leverage this multi-year arrow timeline infographic template to illustrate key milestones from 2018 to 2023 with vivid color-coded arrows and pinpointed callouts. Each year is represented by a distinct arrow segment—blue, teal, green, lime, and red—connected by a continuous path that guides viewers through six chronological stages. Minimalist icons and text placeholders above and below the arrows enable clear labeling of achievements, challenges, or metrics. The clean white background, subtle drop shadows, and consistent typography ensure maximum legibility while maintaining a modern, uncluttered look.
Built on fully editable master slides for both PowerPoint and Google Slides, you can easily swap icons, adjust arrow lengths, or modify colors to align with brand guidelines. Alignment guides guarantee pixel-perfect placement, while modular callout lines can be repositioned or duplicated for extra details. Whether you’re presenting project roadmaps, product launches, or historical overviews, this template streamlines slide creation and delivers professional results across platforms.
Who is it for
Project managers, marketing strategists, data analysts, and executive teams will benefit from this timeline when showcasing program milestones, campaign phases, or performance trends. Educators and training facilitators can also leverage the layout for academic timelines or workshop agendas.
Other Uses
Repurpose the arrow-based design for roadmap visualizations, process workflows, quarterly reports, or feature-release schedules. Use the versatile callouts for KPI dashboards, competitor comparisons, or strategic planning exercises.
Login to download this file


