search

Essentials

Must-have decks for quick wins

By Industry

Professionally tailored slides for every sector

By Style

Minimal, modern and creative designs

By Topic

Explore slides curated by purpose and theme

TimelineTimelineRoadmapRoadmapStrategyStrategyGoalsGoalsTableTableComparisonComparisonSWOTSWOTAgendaAgendaArrowArrowWorld MapWorld MapMapsMapsProcessProcessFunnelFunnelTeamTeamOrg ChartOrg ChartPyramidPyramidCircularCircular

Business PlanBusiness PlanBusiness StrategyBusiness StrategyBusiness ProposalBusiness ProposalBusiness ModelsBusiness ModelsDigital MarketingDigital MarketingMarketing FunnelMarketing FunnelCustomer ExperienceCustomer ExperienceProject StatusProject StatusGantt ChartGantt ChartRecruitmentRecruitmentEmployee PerformanceEmployee PerformanceLeadershipLeadershipAIAIMachine LearningMachine Learning

AI Presentation Maker

Install the Windows plugin for quick access to templates and design tools.

AI Infographics Maker

Use our Office 365 add - in to access templates directly from the cloud.

Exe Version

Install the Windows plugin for quick access to templates and design tools.

Office 365

Use our Office 365 add - in to access templates directly from the cloud.

Mac Version

Get the Mac plugin to easily browse, insert, and customize templates and visuals within PowerPoint.

four-stage-funnel-diagram-powerpoint-and-keynote-template
This template is part of a deck featuring multiple slides. To check out all slides, click on See All. See All round right arrow

Description

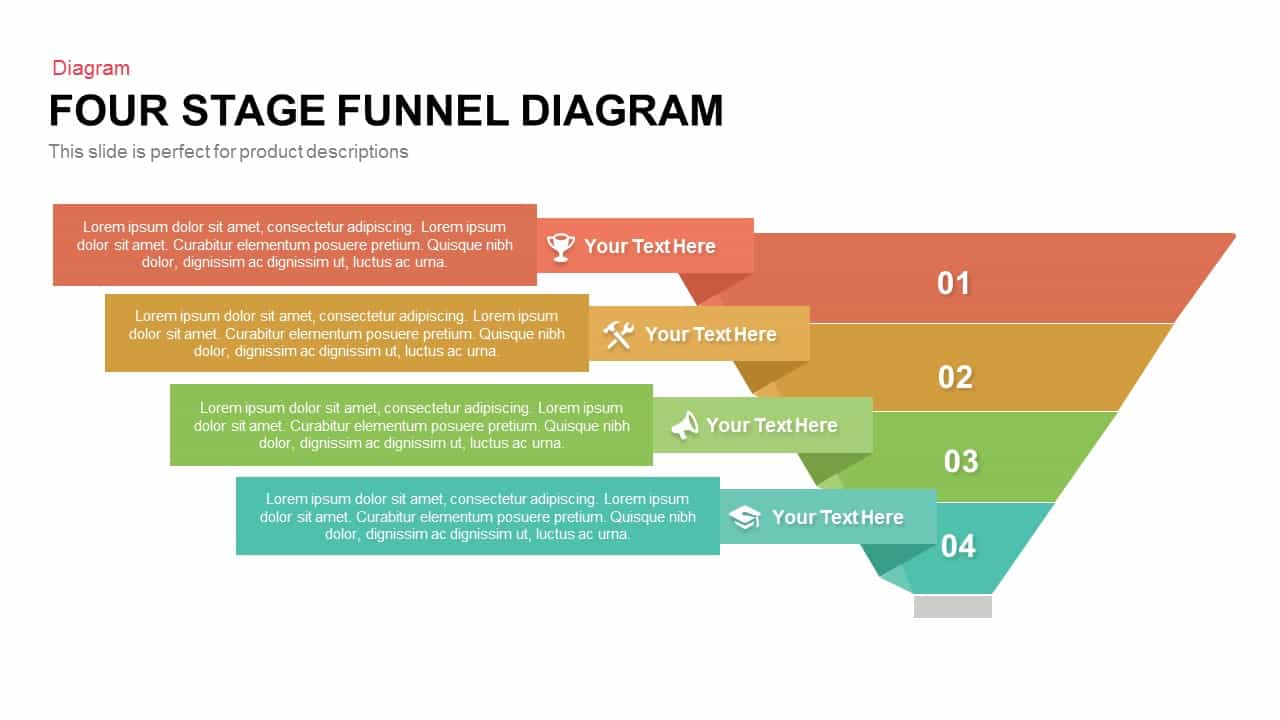
Leverage this four-stage funnel diagram slide to showcase data progression and conversion pathways with professional clarity and visual impact. The central graphic features a vertically stacked funnel segmented into four color-coded bands—red, orange, yellow, and green—each with a prominent percentage indicator and subtle gradient shading. Fine connector lines extend from each tier to editable text placeholders on the side, enabling concise annotations, KPI summaries, or process descriptions. The minimalist header section accommodates your title, subtitle, and supporting copy, while vector-based shapes ensure full customization and crisp rendering across devices.

Built on master slides for both PowerPoint and Google Slides, this template offers intuitive drag-and-drop functionality. Adjust segment hues, resize funnel sections, swap icons, and update data labels within seconds without quality loss. Preconfigured theme colors and slide background variants simplify branding consistency, and safe-zone guidelines prevent cropping issues during final edits. Optional entrance animations add dynamic flair, while formatted text styles maintain a cohesive look throughout your deck.

Ideal for presenting marketing conversion funnels, lead nurturing stages, or operational workflows, this versatile slide adapts to diverse contexts—from sales presentations and executive briefings to training sessions and investor pitches. Duplicate or reorder segments to suit three- or five-stage models, layer callout shapes for emphasis, or integrate with comparative diagrams for comprehensive storytelling. The balanced combination of conceptual imagery and data-focused elements empowers you to translate complex processes into clear, engaging narratives.

With its structured layout and flexible design controls, this asset streamlines collaboration by enabling easy slide duplication, seamless theme updates, and consistent branding across multi-slide decks. Compatible with a 16:9 aspect ratio and optimized for widescreen displays, it integrates smoothly into any presentation setting, from virtual meetings to large-scale conferences.

Who is it for

Marketing managers, sales leaders, and business analysts will benefit from this funnel diagram when illustrating conversion rates, customer journey stages, and performance metrics. Project managers, consultants, and C-suite executives can leverage its clear, tiered structure to align stakeholders and drive data-driven strategies.

Other Uses

Beyond traditional funnel visualizations, repurpose this slide to depict hierarchical breakdowns, resource allocation models, risk-assessment tiers, or phased project roadmaps. Adapt the segment count and labels to fit business process flows, product lifecycle stages, or educational frameworks with equal ease.

Login to download this file

Add to favorites

Add to collection