4 Section Pipe Diagram


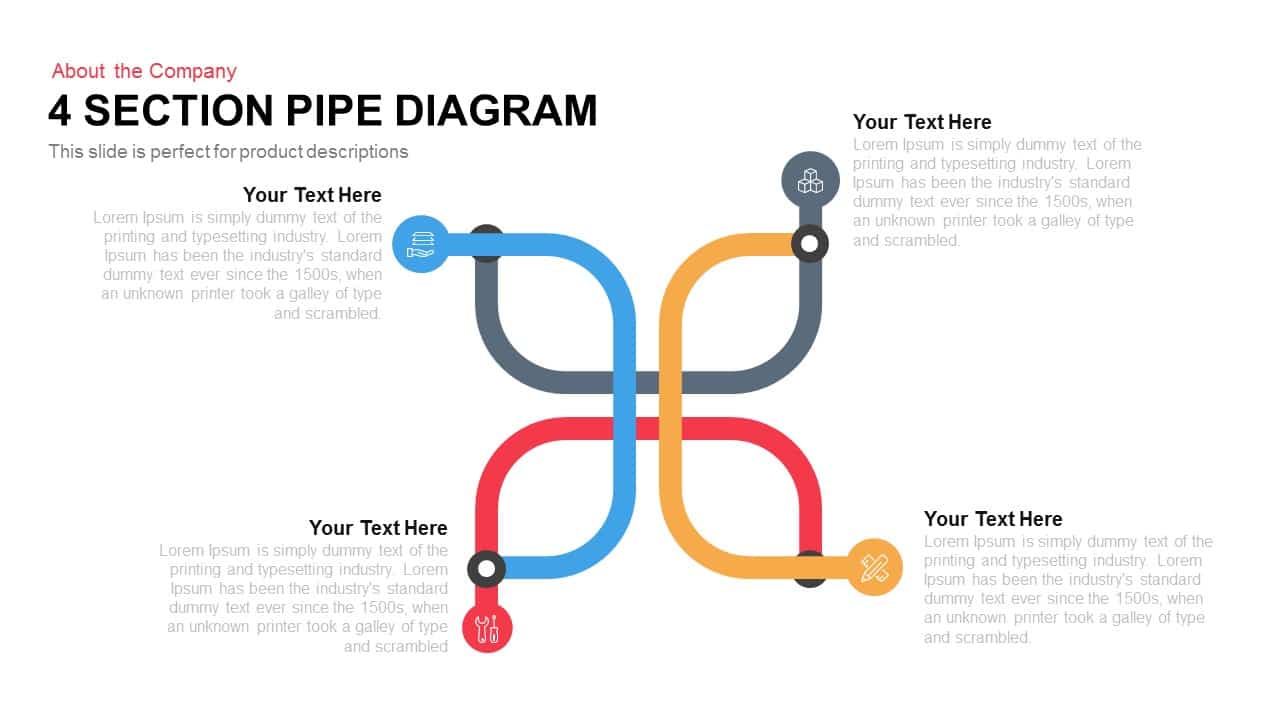
Utilize this dynamic 4 Section Pipe Diagram slide to illustrate sequential processes, intersecting pathways, or interconnected stages with clarity and impact. The layout features four bold, curved pipelines that converge in the center, forming a balanced cross-like structure against a clean white background. Each pipeline is color-coded—blue, dark gray, red, and orange—and terminates in a circular icon placeholder for custom visuals or segment identifiers. Adjacent to each icon, a headline placeholder (“Your Text Here”) and a text block accommodate concise descriptions of each segment, helping audiences quickly grasp the flow and key takeaways.
Engineered for versatility, this template offers fully editable vector shapes, transparent placeholders, and adjustable color schemes. Swap icons, reposition labels, or alter pipeline thickness in a few clicks to match your branding requirements. The master slide setup ensures consistent styling across your deck, while smart guides and grid alignment tools maintain pixel-perfect precision. Crisp typography and generous spacing enhance readability, ensuring your messaging remains the focal point.
Built for cross-platform reliability, this slide supports seamless integration with both PowerPoint and Google Slides. All graphic elements retain full-resolution clarity across various screen sizes, and built-in animations can be applied for engaging transitions. Whether you are outlining project phases, mapping supply chain routes, visualizing operational workflows, or highlighting parallel initiatives, this 4 Section Pipe Diagram provides a polished, professional framework that streamlines content creation and amplifies audience engagement.
Enhance your presentation with optional data labels and timeline markers positioned along the pipelines to annotate milestones, key metrics, or decision points. Vector-based construction ensures each element is fully scalable and can be recolored or resized without loss of quality, giving you complete control over the visual hierarchy.
Who is it for
Project managers, process engineers, supply chain specialists, business analysts, and team leads will find this slide invaluable when presenting workflows, multi-step processes, intersecting strategies, or logistical networks. Consultants and trainers can leverage the color-coded pipelines to maintain audience engagement and articulate complex sequences clearly.
Other Uses
Beyond process mapping, repurpose this diagram to visualize parallel initiatives, resource allocation, marketing funnels, risk mitigation pathways, or technical troubleshooting steps. Duplicate and recolor pipelines to highlight different departments, project streams, or operational scenarios for workshops, executive briefings, or client proposals.
Login to download this file


