4 Item Circular Diagram Concept for PowerPoint 1

Description
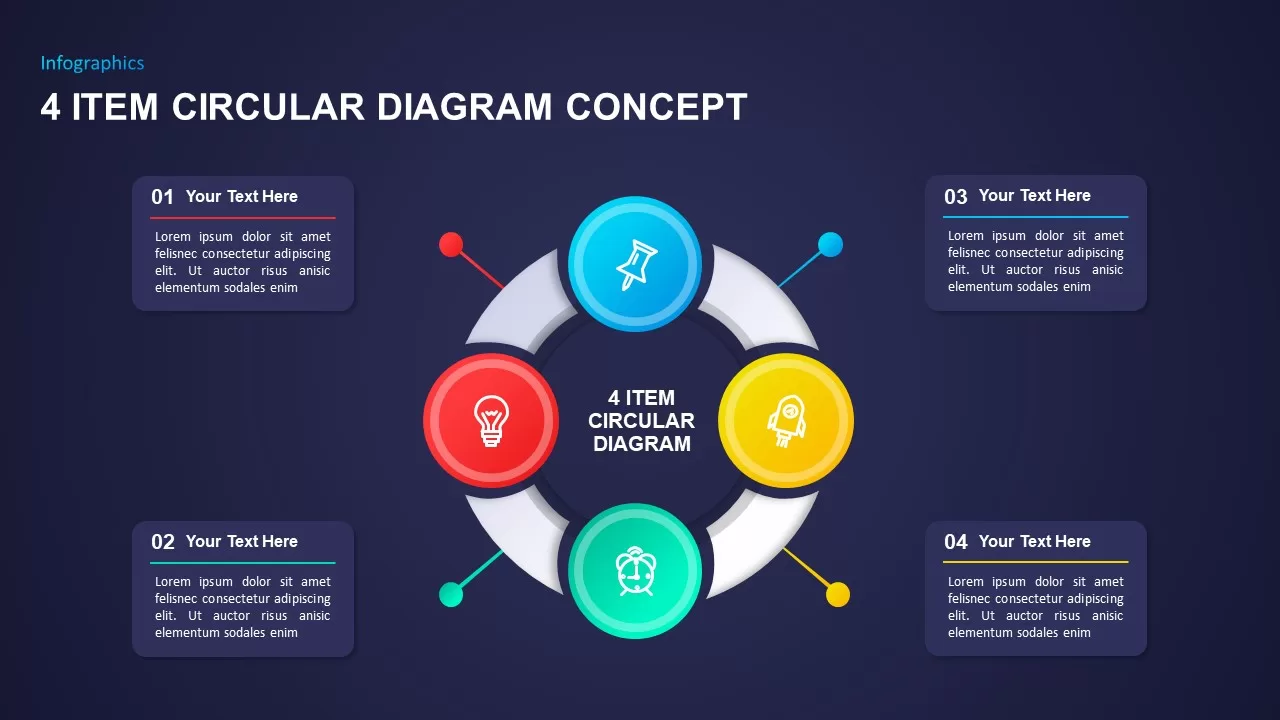
This four-item circular diagram infographic presents a seamless visual framework for sequential processes or concept clusters. At its core, a segmented ring connects four vibrant, gradient-filled nodes—each color-coded red, green, yellow, and blue—to a central placeholder. Crisp vector icons within each node highlight individual themes, while subtle drop shadows and a dark background deliver professional polish and depth.
Every element is built on master slides for both PowerPoint and Google Slides, ensuring full editability and consistent styling. Swap icons, adjust node labels, or update gradient hues with drag-and-drop ease. Snap-to-grid guides and grouped vector layers preserve precise alignment when resizing or repositioning components. The design supports additional callout lines and text boxes for detailed annotations, letting you annotate each step without cluttering the core diagram.
Use the layered format to animate segments sequentially, guiding audience focus through process stages, strategic initiatives, or product features. High-resolution artwork renders flawlessly across HD projectors, virtual meeting platforms, and printouts. The balanced mix of white space and bold accents ensures clarity in any lighting condition, making this template ideal for both in-person and remote presentations.
Whether you’re illustrating a marketing funnel, operational workflow, or innovation cycle, the four-node circular layout turns abstract concepts into an engaging, story-driven narrative. Duplicate or cascade the slide to compare multiple scenarios side by side, or collapse the ring to emphasize a single focal point. With global theme controls, you can integrate corporate fonts, apply custom color palettes, and maintain brand consistency across your entire deck in seconds.
Who is it for
Project managers, marketing strategists, consultants, and trainers who need to present multi-step processes, concept clusters, or comparison frameworks with clarity and visual impact.
Other Uses
Repurpose this circular diagram for feature roadmaps, risk assessments, customer journey stages, or balanced scorecard elements by relabeling nodes and swapping icons.
Login to download this file


