Venn Process Powerpoint and Keynote Diagram 1


Description
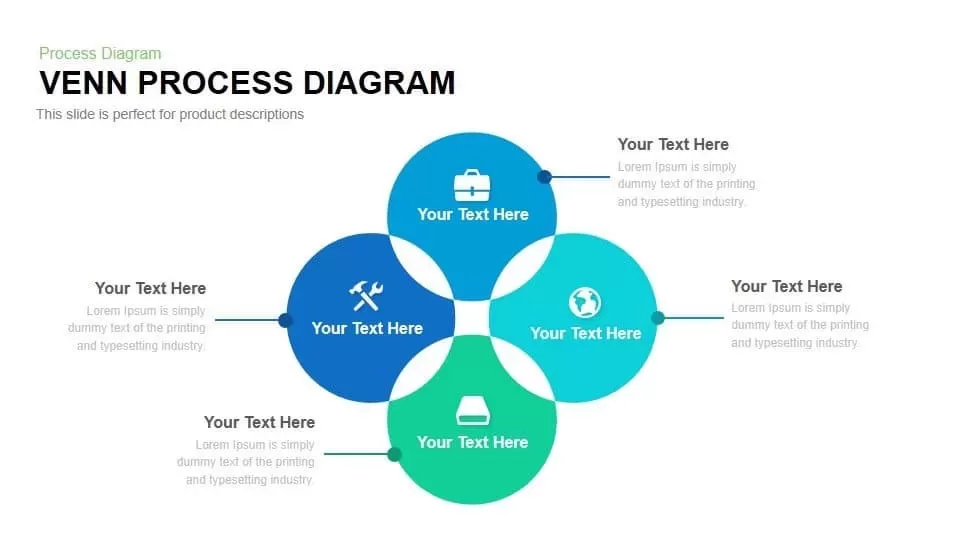
Use this versatile Venn process diagram slide to depict the relationships and intersections between four core elements in a clear, engaging format. The slide features four semi-transparent, color-coded circles arranged in a cloverleaf pattern, each containing a customizable icon placeholder and a bold text label. Elegant connectors extend from each circle to external text areas for detailed descriptions, enabling presenters to annotate individual and overlapping segments with context-specific information. A concise slide title and subtitle reinforce the theme, while the minimalist legend and uniform typography ensure visual coherence and focus on content. The balanced layout prioritizes symmetry and whitespace, maintaining clarity even when complex data points or multiple labels are introduced.
Built on fully editable master slides, the template allows you to swap icons, adjust circle sizes, change color themes, and reorganize connectors with ease. Ideal for illustrating product features, market segmentation, risk assessments, or strategic frameworks, the diagram scales seamlessly to fit anywhere in your deck. Vector-based elements guarantee crisp rendering on screens of all sizes, and compatibility across PowerPoint and Google Slides ensures consistent formatting and hassle-free sharing. Achieve professional-quality results in minutes rather than hours.
Whether you’re leading stakeholder workshops, academic presentations, or client proposals, this Venn process diagram streamlines the communication of complex interdependencies and highlights overlapping insights at a glance. Duplicate or combine circles to represent additional categories, or swap icons to match your industry context—no graphic design skills required. The flat-modern aesthetic pairs flawlessly with corporate branding or startup visuals, while subtle drop shadows and consistent iconography add depth without detracting from the core message.
Who is it for
Business analysts, project managers, marketing strategists, and product developers will find this slide invaluable for visualizing intersections between data sets, illustrating feature overlaps, or mapping collaborative workflows. Designers, educators, and consultants can also customize the diagram to showcase overlapping market segments, team skill matrices, or research findings.
Other Uses
Beyond process mapping, repurpose this diagram for audience segmentation, competitive analysis, risk overlap assessment, or portfolio comparison. Use the overlapping circles to illustrate shared responsibilities, cross-departmental initiatives, resource allocations, or thematic connections in training materials and reports.
Login to download this file


