Fishbone Diagram Keynote and PowerPoint


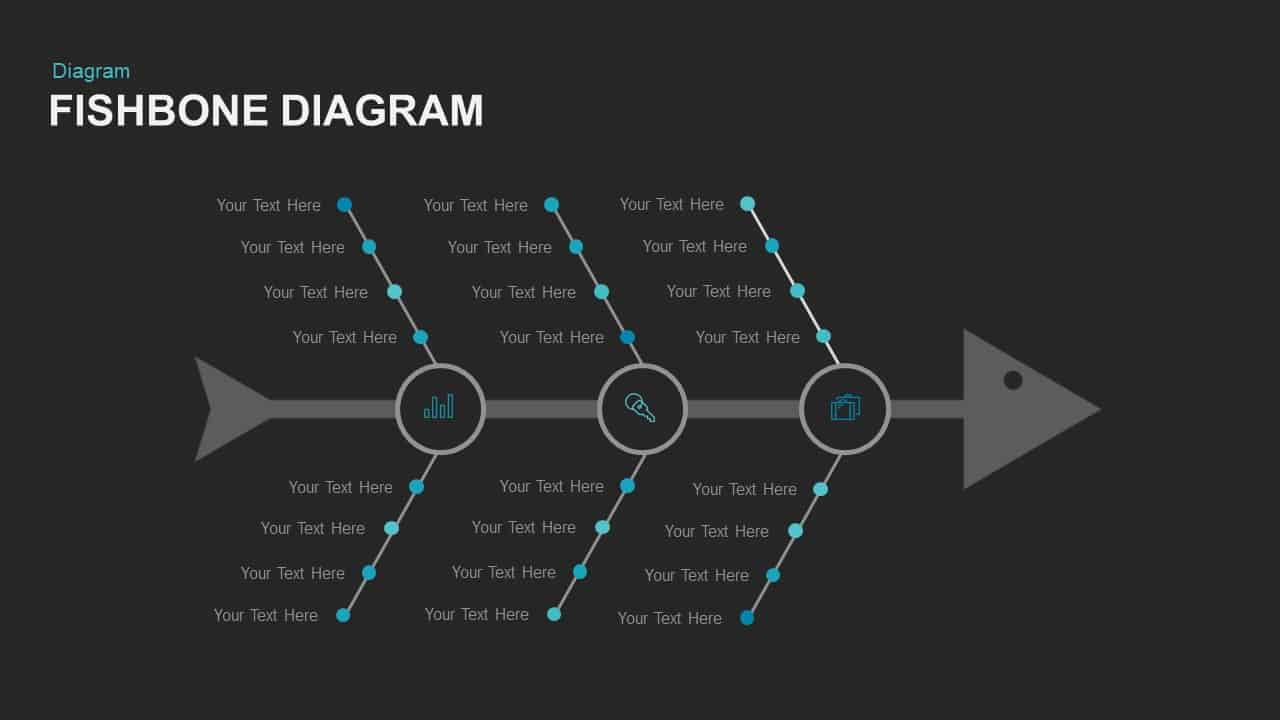
Leverage this versatile fishbone (Ishikawa) diagram slide to conduct root cause analysis and visualize complex cause-and-effect relationships with precision. The central horizontal spine represents the primary issue or effect, culminating in a prominent arrowhead placeholder for your main problem statement. Along the spine, four circular category markers house crisp line icons and differentiate key cause types—such as Man, Machine, Method, and Material—using subtle color variations. Each category branches into multiple diagonal bones with text placeholders and colored nodes, enabling you to systematically list sub-causes or contributing factors with clarity. Built on master slides with fully editable vector shapes, this template ensures you can resize elements, change line weights, swap icons, and update text styles in seconds while maintaining perfect alignment and resolution.
Designed for both PowerPoint and Google Slides, this slide supports collaborative editing and adapts seamlessly to corporate branding. Easily adjust the number of categories and bones by duplicating or hiding shape groups, and apply your organization’s color palette to reinforce brand identity. The minimalist layout employs a clean white background and muted grays for the spine, allowing colored nodes and labels to stand out and guide audience focus. Ideal for printed reports, digital presentations, or interactive workshops, the diagram’s structured format facilitates team brainstorming sessions, quality improvement initiatives, and process optimization projects. Use the master placeholder to insert data callouts or metrics alongside each branch, transforming the diagram into a live dashboard for performance tracking.
Featuring smooth vector lines and high-contrast typography, the diagram adapts to any theme, while optional drop shadows add depth without clutter. Presenters can animate individual bones or apply color emphasis to highlight priority causes, supporting dynamic slide transitions and interactive discussions. This fishbone template elevates cause analysis in strategic planning meetings, quality audits, or training sessions with professional polish and enhanced audience engagement.
Who is it for
Quality managers, process engineers, project leaders, and Six Sigma practitioners will find this fishbone diagram essential for root cause analysis. Teams engaging in continuous improvement, risk assessment, or troubleshooting sessions can leverage its clear structure to identify and categorize underlying issues efficiently.
Other Uses
Repurpose this fishbone layout for SWOT subcategory mapping, risk factor breakdowns, action item tracking, or decision trees. The branching format also suits brainstorming key drivers behind KPIs, feature prioritization, or stakeholder impact analysis in any corporate or educational setting.
Login to download this file


