search

Essentials

Must-have decks for quick wins

By Industry

Professionally tailored slides for every sector

By Style

Minimal, modern and creative designs

By Topic

Explore slides curated by purpose and theme

TimelineTimelineRoadmapRoadmapStrategyStrategyGoalsGoalsTableTableComparisonComparisonSWOTSWOTAgendaAgendaArrowArrowWorld MapWorld MapMapsMapsProcessProcessFunnelFunnelTeamTeamOrg ChartOrg ChartPyramidPyramidCircularCircular

Business PlanBusiness PlanBusiness StrategyBusiness StrategyBusiness ProposalBusiness ProposalBusiness ModelsBusiness ModelsDigital MarketingDigital MarketingMarketing FunnelMarketing FunnelCustomer ExperienceCustomer ExperienceProject StatusProject StatusGantt ChartGantt ChartRecruitmentRecruitmentEmployee PerformanceEmployee PerformanceLeadershipLeadershipAIAIMachine LearningMachine Learning

AI Presentation Maker

Install the Windows plugin for quick access to templates and design tools.

AI Infographics Maker

Use our Office 365 add - in to access templates directly from the cloud.

Exe Version

Install the Windows plugin for quick access to templates and design tools.

Office 365

Use our Office 365 add - in to access templates directly from the cloud.

Mac Version

Get the Mac plugin to easily browse, insert, and customize templates and visuals within PowerPoint.

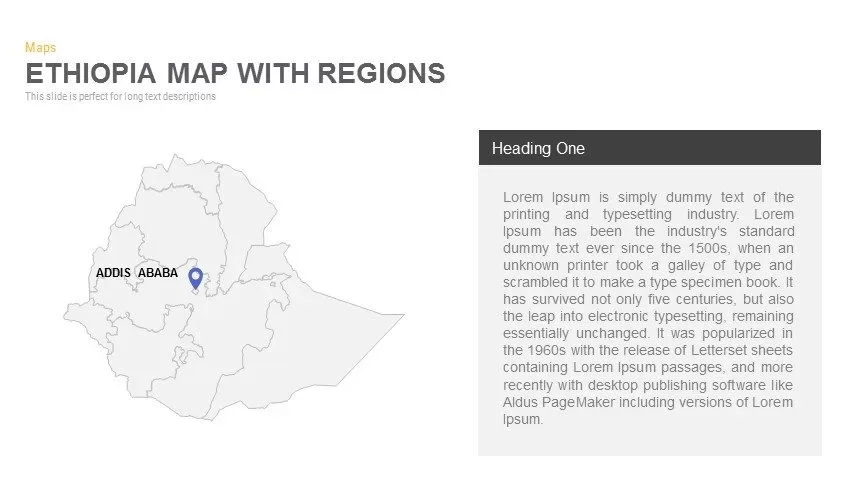
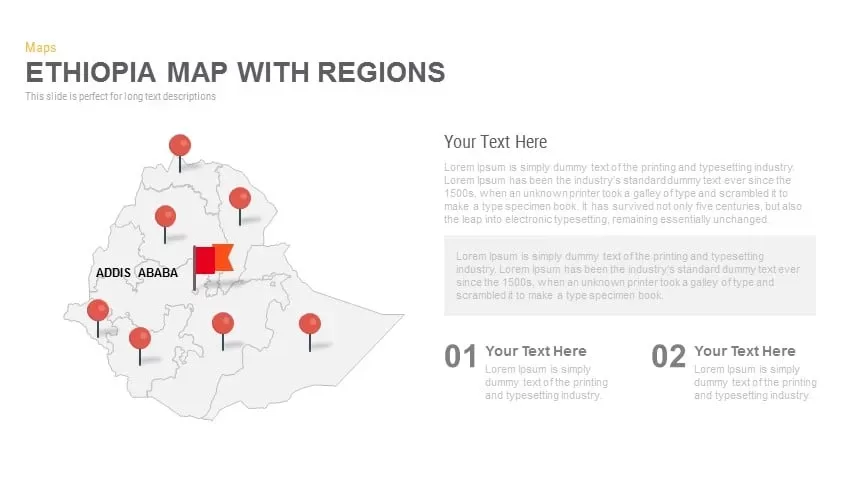
Ethiopia Map With regions Powerpoint and Keynote template 2

This template is part of a deck featuring multiple slides. To check out all slides, click on See All. See All round right arrow
Ethiopia Map With regions Powerpoint and Keynote template

Description

This five-slide pack delivers versatile Ethiopia map layouts complete with regional boundaries and customizable markers for data-driven storytelling. The opening slide features a clean outline map accented with uniform push-pins and a prominent offset callout panel for highlighting a key region like Addis Ababa. The second layout pairs the map with a shaded text block and header banner for detailed regional narratives or strategic insights. The third slide integrates a multi-series bar chart alongside the map, enabling direct comparisons of regional metrics—population, resource allocation, or sales volume—across all regions. The fourth variation displays vibrant color-coded pins for each region, supported by dual numbered callouts to outline two priority areas or initiatives. Finally, the pack concludes with percentage hexagon callouts—orange and red—paired with icon-based demographic statistics for gender splits or market penetration. All slides use vector shapes for razor-sharp clarity on HD screens, projectors, and mobile devices. Editable master layouts let you recolor regions, reposition pins, swap icons, or update chart data in seconds without reformatting. Snap-to-guide alignment and consistent padding ensure professional, balanced layouts throughout your deck. The neutral white background and subtle drop shadows keep focus on your visuals, while seamless compatibility between PowerPoint and Google Slides eliminates formatting headaches and accelerates collaborative editing.

Who is it for

Sales managers, market analysts, and regional planners will find this template indispensable for visualizing regional performance, highlighting strategic locations, and guiding data-driven discussions.

Other Uses

Use these layouts for academic research, election result breakdowns, tourism development plans, resource allocation reports, or public policy presentations to illustrate geographic insights across Ethiopia’s regions.

Login to download this file