Engineering Efficiency Diagram for PowerPoint


Improve Engineering Performance with a Clear Visual Framework
Engineering efficiency plays a critical role in helping organizations optimize resources, reduce downtime, and improve overall operational performance. Whether presenting process improvement initiatives, maintenance strategies, or workforce development plans, a well-structured visual can make complex engineering concepts easier to understand. The Engineering Efficiency Diagram provides a professional way to communicate key priorities through an engaging illustration and a clean four-point layout.
What is Engineering Efficiency?
Engineering efficiency refers to the ability to achieve desired outcomes while minimizing wasted time, effort, materials, and operational costs. It involves improving workflows, enhancing equipment reliability, adopting innovative technologies, and ensuring teams have the skills needed to maintain high performance. Organizations that focus on engineering efficiency often experience better productivity, improved asset utilization, and more consistent operational results.
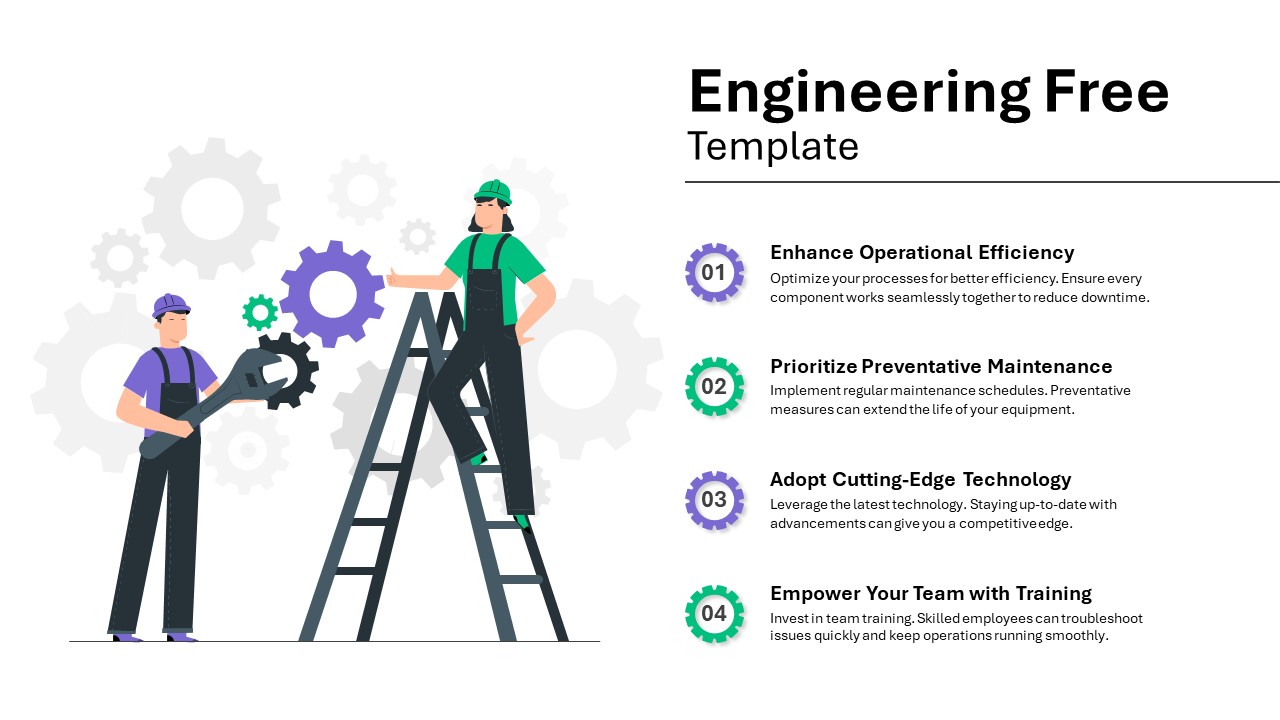
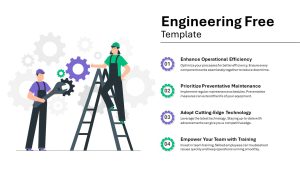
Designed around this concept, the Engineering Efficiency Diagram template helps presenters showcase four strategic initiatives in a visually organized format. The slide features an illustration of engineers working alongside gears, symbolizing collaboration, systems optimization, and operational excellence. On the right, four color-coded icon sections provide a structured way to highlight priorities such as process enhancements, preventive maintenance programs, technology adoption, and employee training. Fully editable elements allow users to customize icons, text, colors, and branding while maintaining a polished and professional appearance.
This Google Slides template is ideal for operations managers, engineering directors, plant supervisors, maintenance teams, reliability engineers, and technical consultants who need to communicate efficiency initiatives clearly. It is equally useful for project reviews, operational planning sessions, performance improvement meetings, and training presentations. With its flexible design and easy customization options, the Engineering Efficiency Diagram template helps teams present actionable strategies that drive continuous improvement and long-term operational success.
Login to download this file

Item ID
SB04519