Map Of World PowerPoint Template Dark


Description
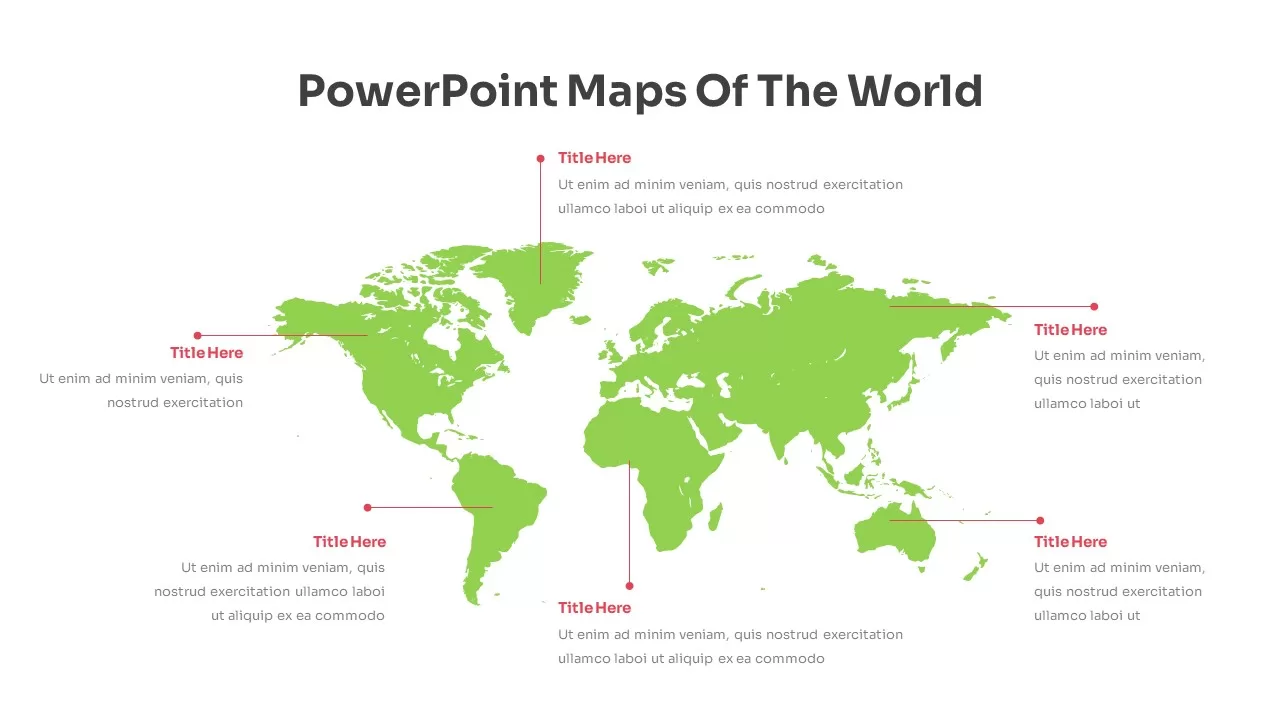
Download this fully editable world map callout infographic to showcase regional insights, highlight key markets, and annotate geographic data in a single, visually impactful slide. The centerpiece is a vector-based world map rendered in a vibrant green hue, overlaid with customizable red pin markers connected by thin lines to clear text boxes for titles and descriptions. Each of the six callouts can be repositioned, recolored, or relabeled to suit your specific data points—from sales territories and market research findings to supply-chain nodes and project sites.
Built on master slides for both PowerPoint and Google Slides, every element is vector-friendly for seamless scaling and color adjustments without losing resolution. Swap placeholder text, replace icon markers, or adjust pin shapes in seconds. The default light-theme design uses clean typography, subtle drop shadows, and ample white space for maximum legibility, while an included dark-theme variant maintains contrast in all presentation environments.
Ideal for global business reviews, international sales reports, and strategic planning sessions, this infographic accelerates slide creation and drives clear storytelling. Duplicate the slide to compare multiple datasets, layer additional callouts for emerging markets, or integrate it into broader executive decks. Whether you’re presenting to C-suite stakeholders, aligning cross-functional teams, or reporting to investors, this world map callout template equips you to deliver data-driven narratives with confidence and clarity.
Who is it for
Marketing managers, international business analysts, and strategy consultants will leverage this slide to visualize global performance and opportunities. Sales directors, operations teams, and executive stakeholders benefit from its concise callout format.
Other Uses
Beyond market analyses, repurpose the map for supply-chain overviews, client distribution networks, NGO impact mapping, or educational geographic studies. Add region-specific metrics, overlay trend lines, or convert callouts into interactive buttons for digital presentations.
Login to download this file


