Editable Gantt Chart 1


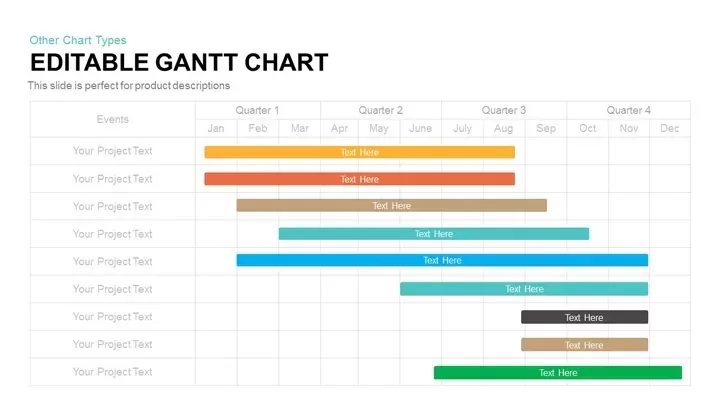
Leverage this fully editable Gantt Chart slide to visualize detailed project schedules across four quarters with utmost clarity. The slide features a clean grid layout with months segmented under Quarter 1 through Quarter 4, ensuring precise temporal alignment of tasks. Each row corresponds to an event or deliverable, with color-coded bars that span relevant months to depict start and end dates. Text placeholders within bars allow for concise naming of tasks, while the left-hand events column can be customized to label project phases or team responsibilities.
Built on native PowerPoint and Google Slides master slides, this template uses vector shapes and editable table structures to simplify updates. Easily adjust bar lengths to reflect shifting timelines, swap default colors to match brand palettes, and insert additional rows or columns to accommodate project complexity. The unobtrusive typography and grid lines maintain readability, while the absence of external plugins ensures seamless functionality across platforms.
Ideal for tracking milestones, resource allocation, or cross-functional workflows, this Gantt Chart empowers stakeholders to grasp project progress at a glance. Use color variation and text alignment to highlight critical paths, dependencies, or phases requiring escalation. Whether mapping software sprints, marketing campaigns, or construction schedules, the modular design allows duplication and rearranging of rows without disrupting the overall layout.
Optimize team collaboration by integrating this slide into status reports, steering-committee presentations, or client updates. The intuitive placeholders and consistent formatting reduce manual editing time, enabling you to focus on strategic insights and decision-making. With full-resolution fidelity across devices, this Gantt Chart slide elevates any presentation by converting complex timelines into an engaging visual narrative.
Who is it for
Project managers, program coordinators, marketing teams, and operations leads will benefit from this Gantt Chart when planning timelines, tracking milestones, or coordinating cross-functional tasks. Business analysts, consultants, and PMO offices can also leverage this slide for stakeholder presentations, status updates, and resource-planning discussions.
Other Uses
Beyond project planning, repurpose this slide to visualize marketing campaign schedules, product development roadmaps, or event timelines. The modular bar layout also works for tracking training programs, resource capacity planning, or production workflows.
Login to download this file


