Donut Slide PowerPoint Template

Description
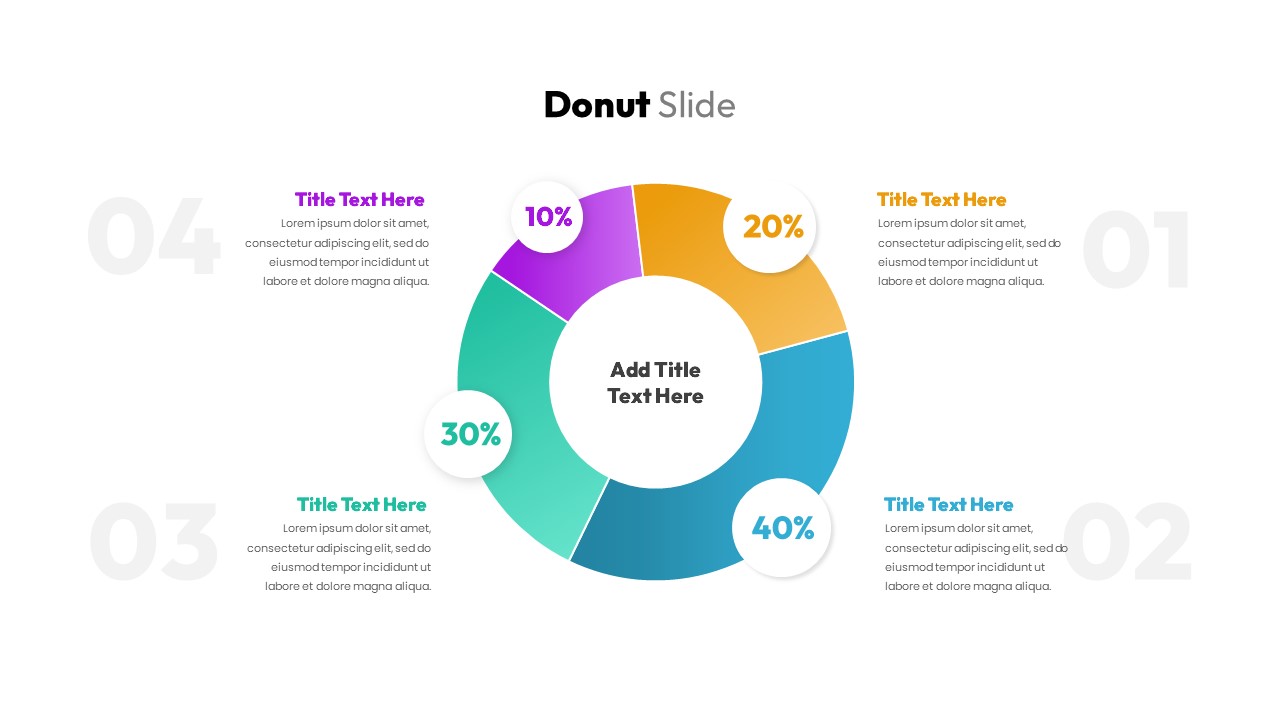
This visually engaging Donut Chart slide is perfect for presenting percentage-based data in a clean, colorful, and easy-to-understand format. The chart is divided into four sections, each represented by a distinct color—purple, yellow, orange, and blue—allowing for quick differentiation between data points. With percentage values clearly labeled within each section (10%, 20%, 30%, 40%), this design allows for a dynamic and informative presentation of any data analysis or comparative statistics.
The layout includes ample space around the donut chart to add detailed descriptions for each data segment. These text boxes can be customized to provide context for each percentage or describe the key takeaways, making it suitable for business presentations, sales meetings, or project reports. The vibrant colors and clear typography ensure your audience will be able to follow the data presentation with ease, while the donut chart design keeps the focus on the percentages and their significance.
Fully editable and compatible with both PowerPoint and Google Slides, this template allows for easy customization, enabling you to adjust the colors, text, and layout to best fit your presentation needs.
Who is it for
This slide is ideal for data analysts, business professionals, project managers, and marketing teams who need to present data in an engaging, digestible format. It is well-suited for performance reviews, sales presentations, project status updates, and business strategy meetings.
Other Uses
Beyond data analysis, this slide can be adapted for budget breakdowns, market share comparisons, resource allocation presentations, and goal-setting reviews. It’s also useful for illustrating customer demographics, survey results, or any other situation where segmented data needs to be clearly conveyed.
Login to download this file


