DNA Structure template for PowerPoint & Google Slides


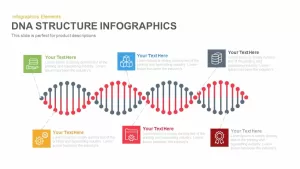
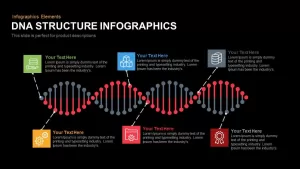
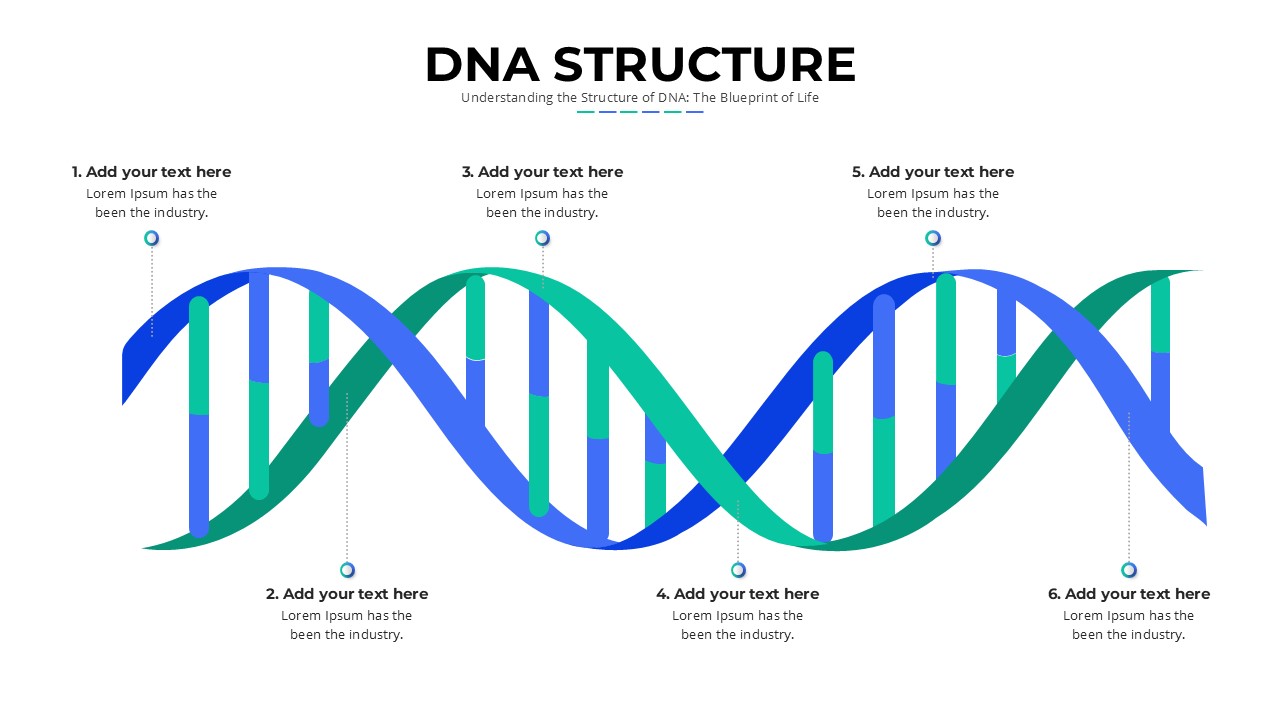
This DNA Structure template for PowerPoint & Google Slides features a stylized double-helix infographic composed of alternating nodes and connectors. Two sinuous strands of circular markers—one in a neutral gray and the other in vivid red—spiral across the slide, forming four distinct bulges. Each bulge anchors a dashed-line callout that leads to a color-coded rectangular text box with editable icons and placeholders. Three callouts sit above the helix (in green, blue, and dark gray) and three appear below (in yellow, red, and deep crimson), each ready to display concise headlines and descriptive paragraphs. The vector-based design uses flat icons to represent stack layers, modular cubes, data storage, gear settings, folder workflows, and achievement badges, making it simple to swap in custom graphics. Built on flexible master layouts, the template supports both widescreen (16:9) and standard (4:3) aspect ratios. Users can effortlessly change colors, adjust line styles, and resize or duplicate nodes to match brand guidelines or thematic needs. The clean white background provides high contrast for text and graphics, ensuring readability even in print or when scaled to small thumbnails. All shapes, lines, and text elements are fully editable, eliminating the need for third-party plugins. Whether presenting genetic data, process workflows, or multi-stage concepts, this slide enables seamless alignment and professional polish. Subtle typography settings maintain visual hierarchy, while consistent spacing preserves balance across the composition. With intuitive drag-and-drop editing and preconfigured placeholders, assembling a customized helix infographic takes minutes, letting presenters focus on narrative rather than formatting. Prebuilt color themes and icon libraries further accelerate customization.
Who is it for
Biologists, geneticists, and life-science researchers can leverage this slide to illustrate DNA structures, study phases, or molecular processes. Biotech startup founders and lab managers will find it ideal for pitching research milestones and pipeline visuals. Educators and academic presenters can use the infographic to teach molecular biology concepts, while marketing and product teams in pharmaceutical or diagnostics firms can customize the template to showcase product development stages and data highlights in investor decks or technical reports.
Other Uses
Beyond molecular visuals, repurpose the helix nodes as process steps or data checkpoints. Replace icons to map sequential stages in quality control pipelines, product development cycles, or regulatory workflows. The alternating color-coded callouts can highlight key performance metrics, milestones, or departmental responsibilities. By duplicating or removing nodes, you can adapt the layout for training modules, experiment roadmaps, or project status updates, making this infographic a versatile tool across industries.
Login to download this file

Item ID
SB00132
Related Templates

DNA Structure Infographic Template for PowerPoint & Google Slides
Health
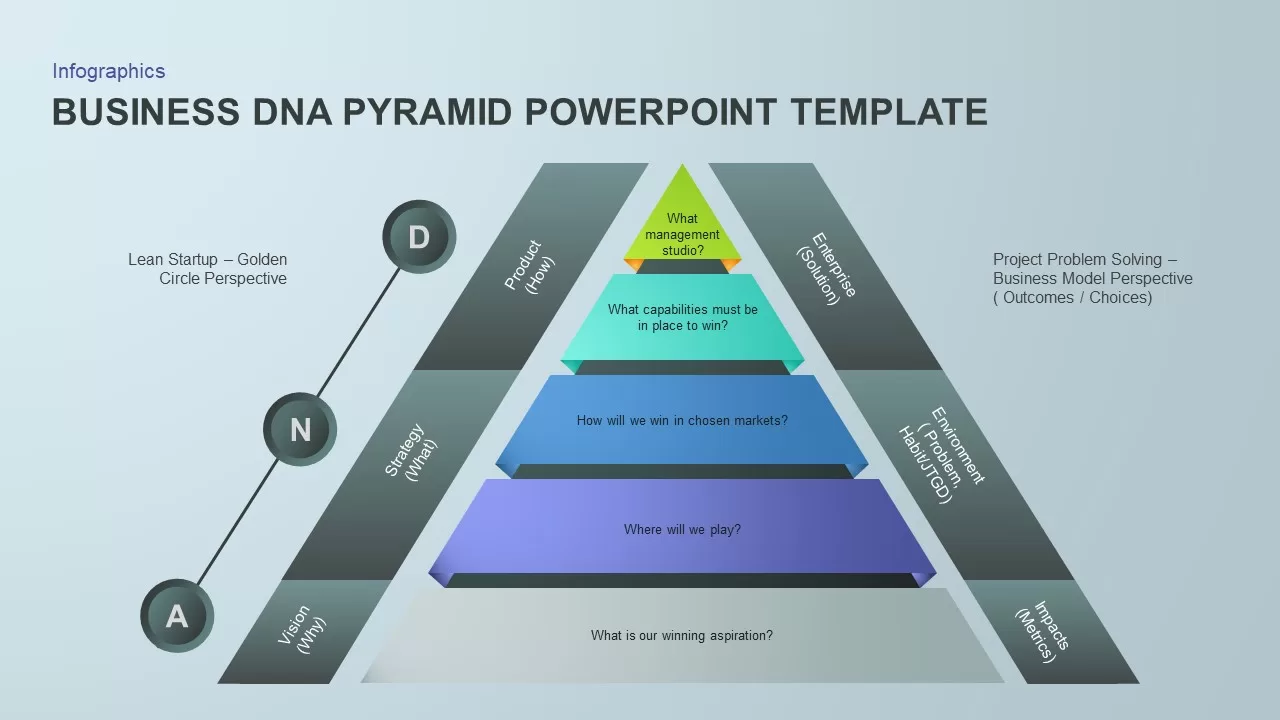
Business DNA Pyramid PowerPoint Template for PowerPoint & Google Slides
Pyramid
Puzzle DNA Diagram for Product Features Template for PowerPoint & Google Slides
Process
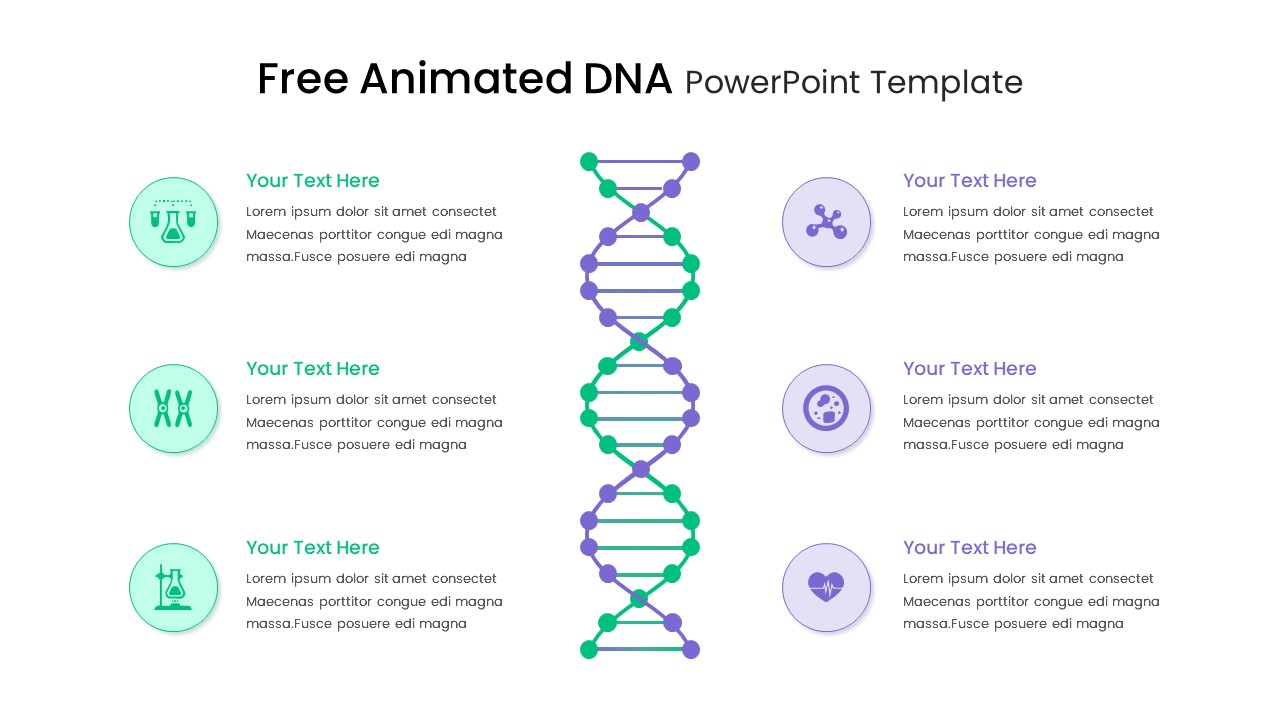
Free Animated DNA Infographic Diagram Template for PowerPoint & Google Slides
Infographics
Free
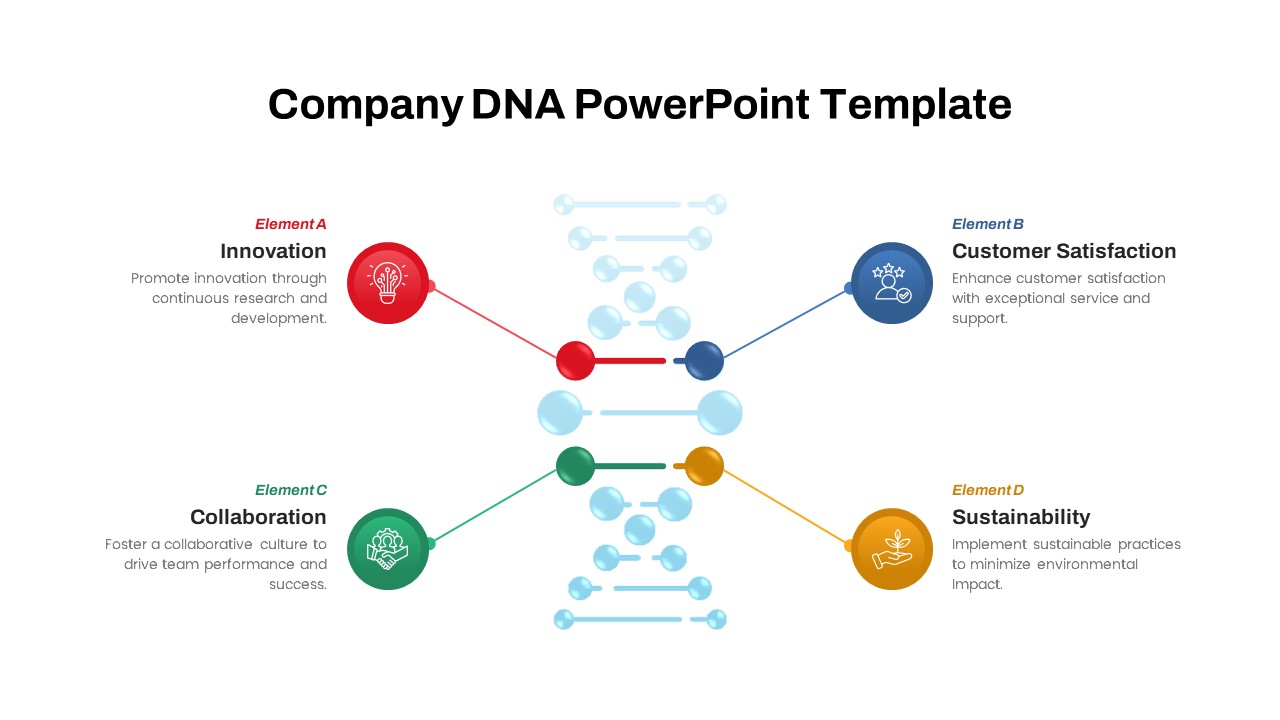
Company DNA Framework Slide Deck Template for PowerPoint & Google Slides
Circular
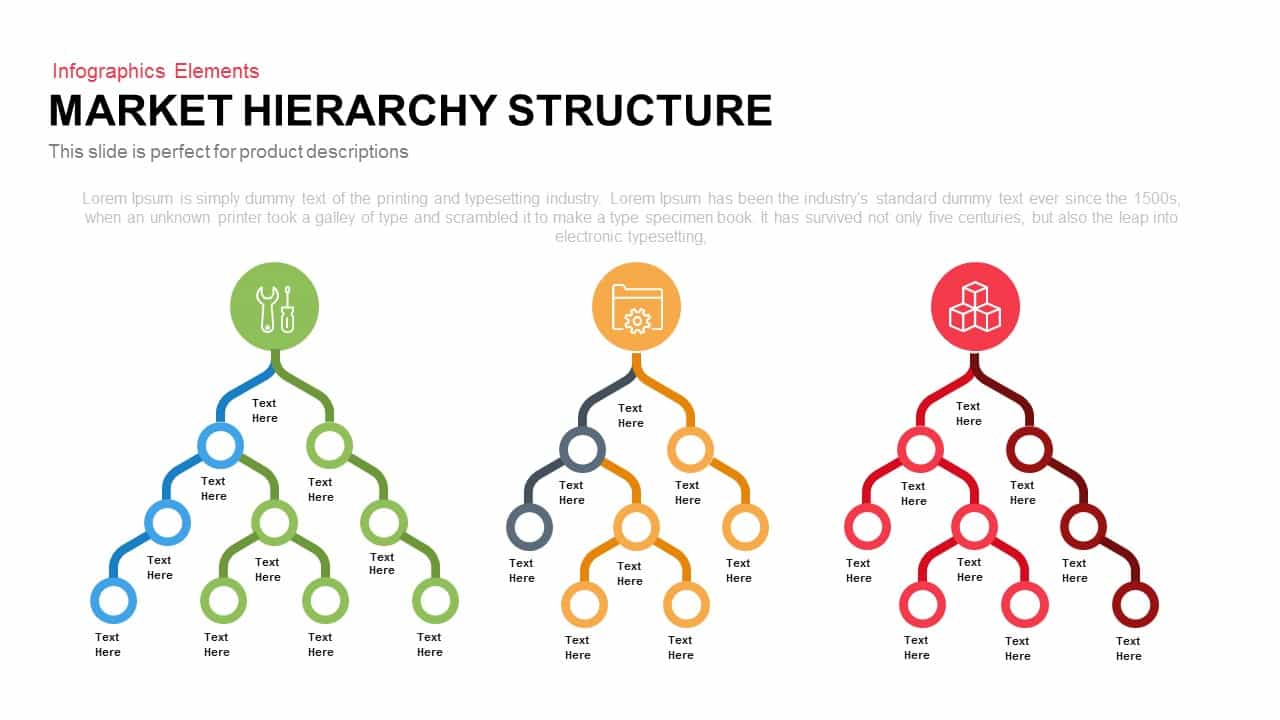
Market Hierarchy Structure Infographic template for PowerPoint & Google Slides
Org Chart
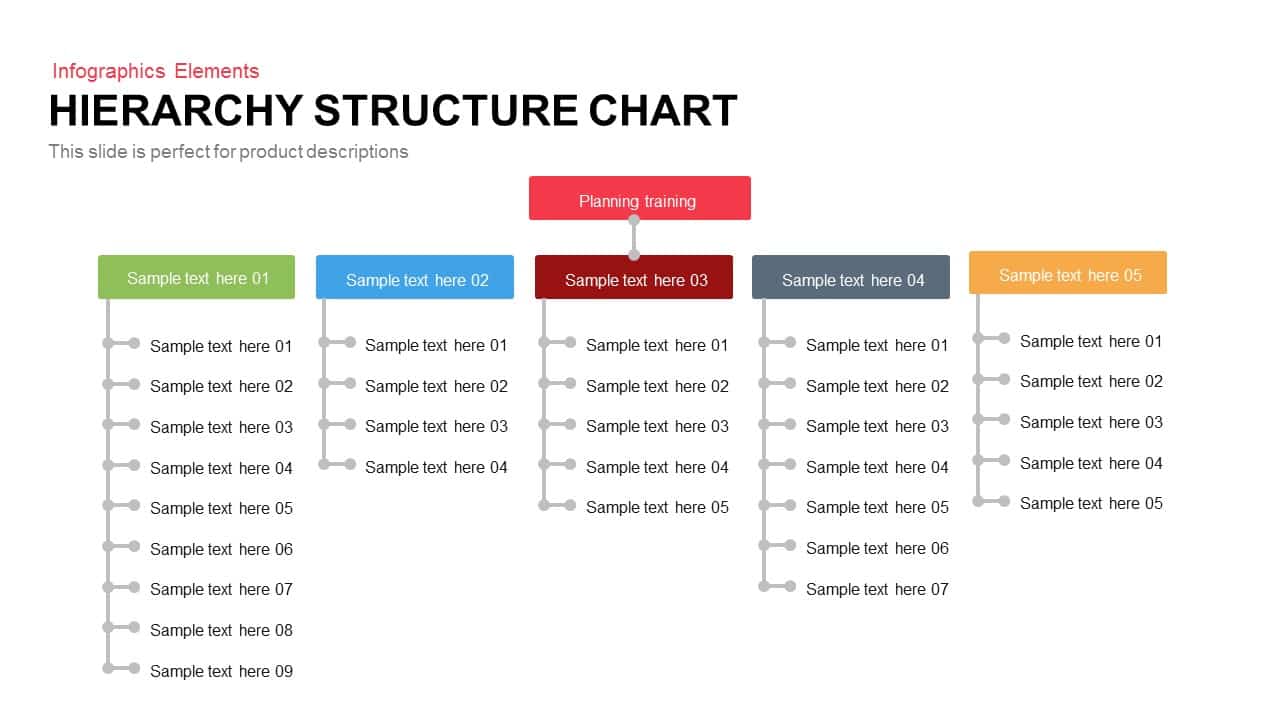
Five-Branch Hierarchy Structure Chart template for PowerPoint & Google Slides
Org Chart
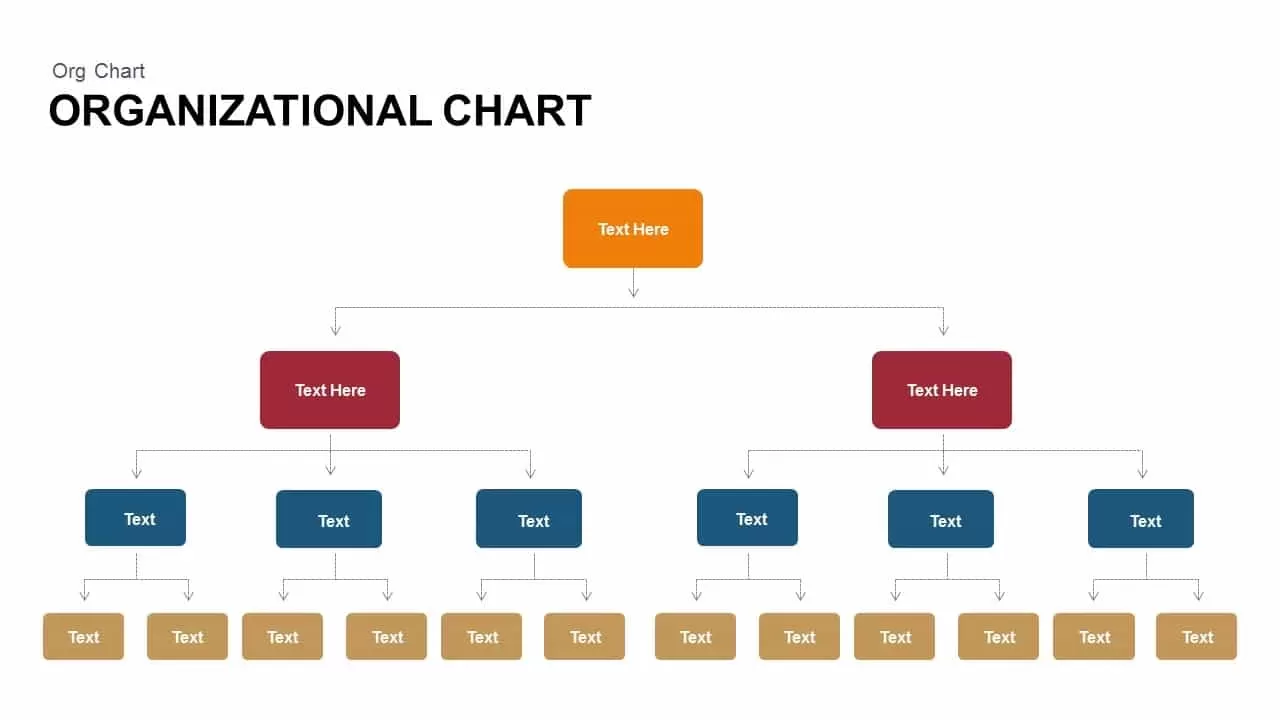
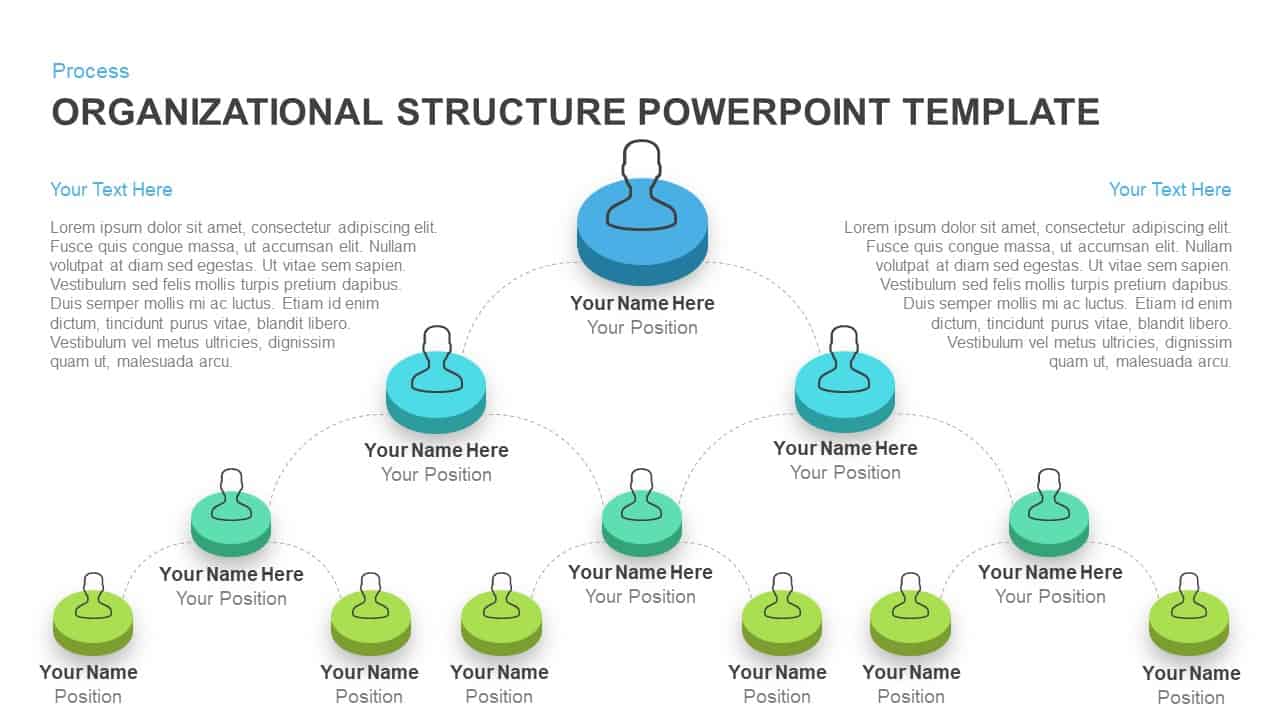
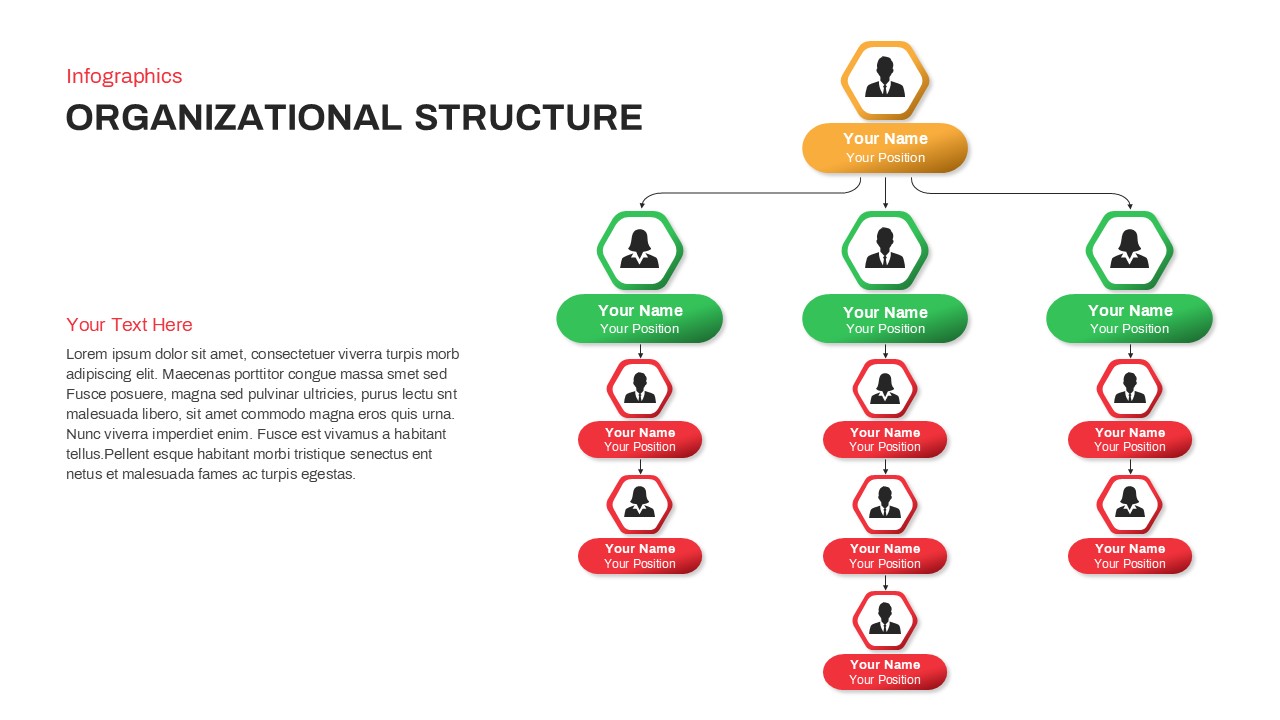
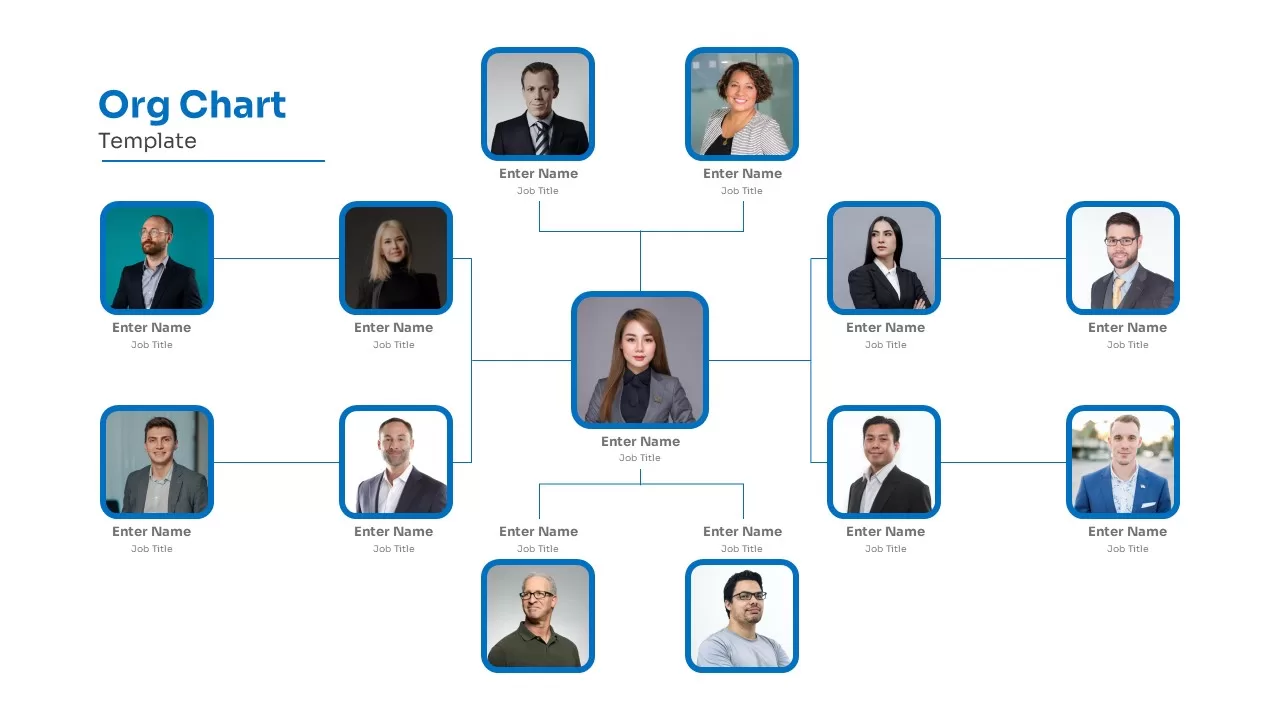
Organizational Structure Org Chart Template for PowerPoint & Google Slides
Org Chart
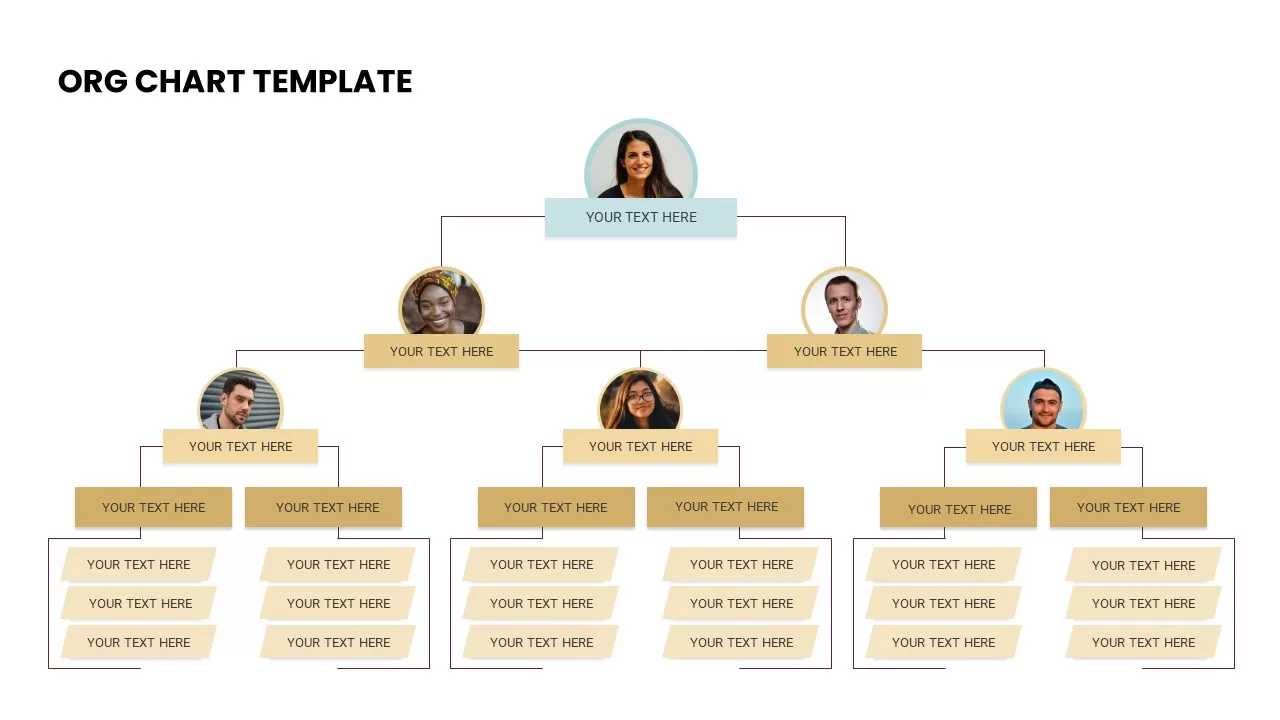
Organizational Chart Structure template for PowerPoint & Google Slides
Org Chart
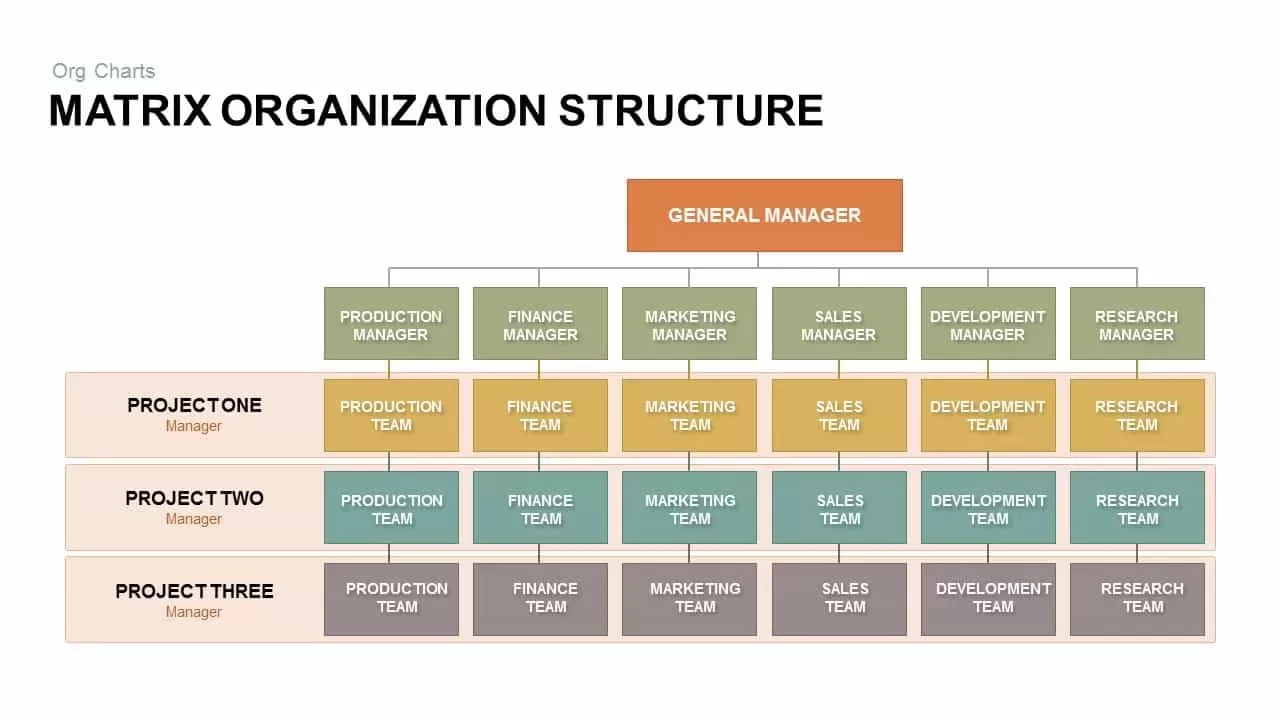
Matrix Organization Structure template for PowerPoint & Google Slides
Org Chart
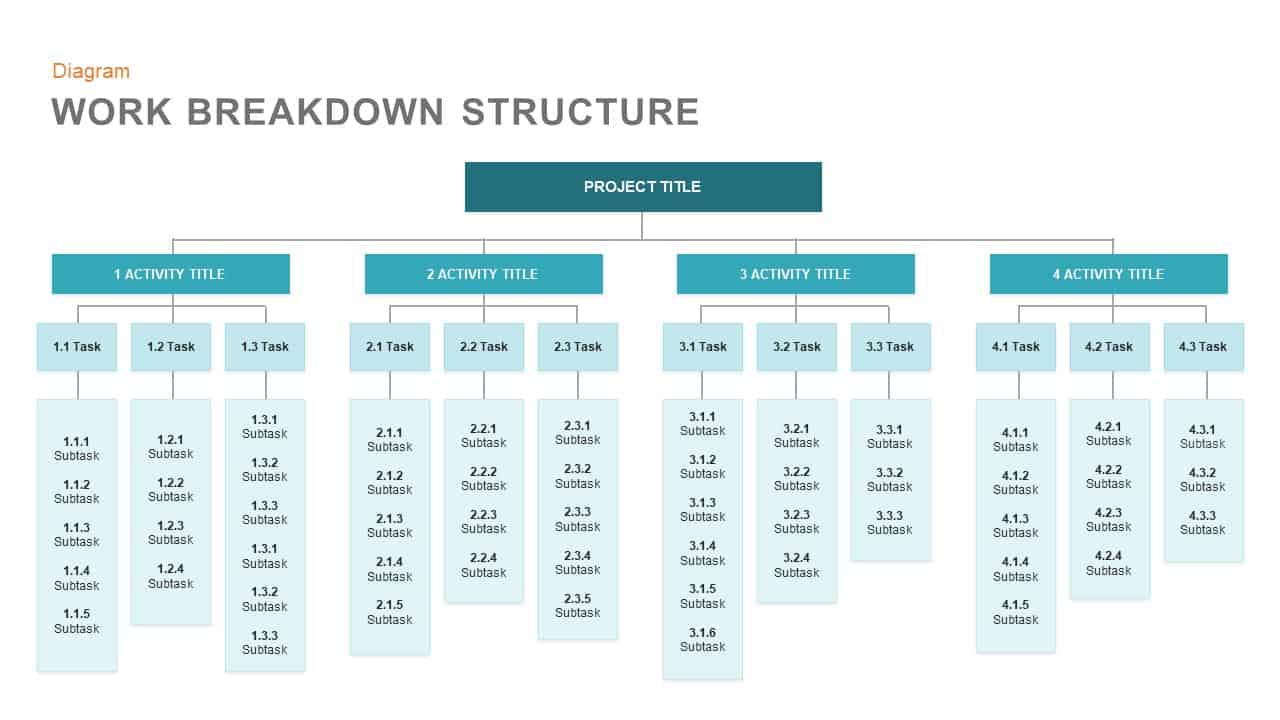
Work Breakdown Structure Diagram Template for PowerPoint & Google Slides
Diagrams
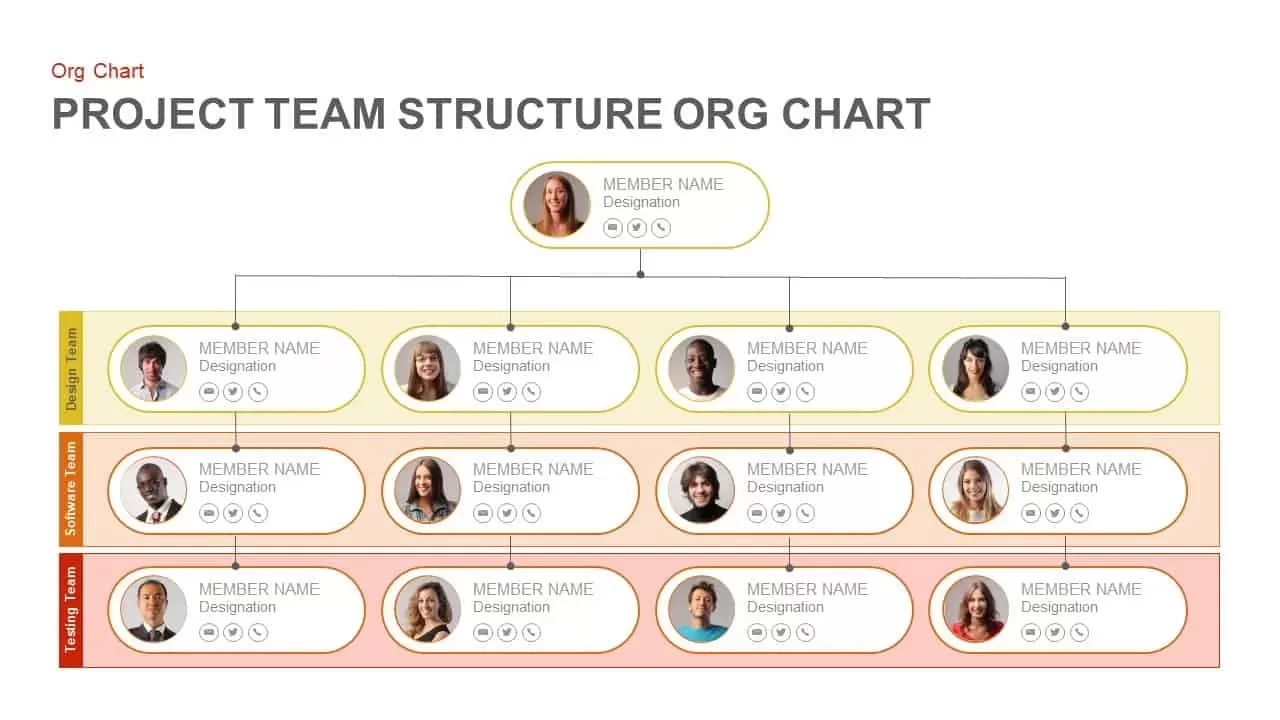
Project Team Structure Org Chart Template for PowerPoint & Google Slides
Org Chart
Isometric Organizational Structure Chart Template for PowerPoint & Google Slides
Org Chart
Hierarchical Organizational Structure Template for PowerPoint & Google Slides
Org Chart
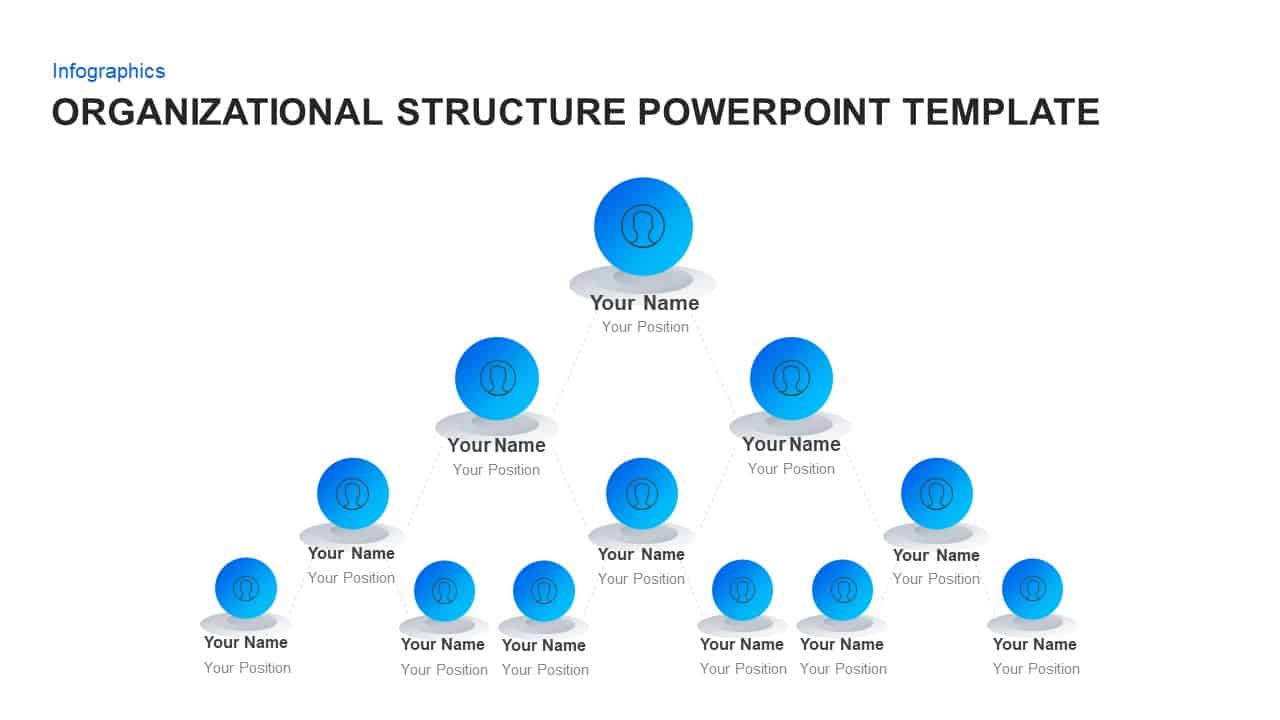
Organizational Structure Hierarchy Chart Template for PowerPoint & Google Slides
Org Chart
Organizational Structure Diagram Template for PowerPoint & Google Slides
Org Chart
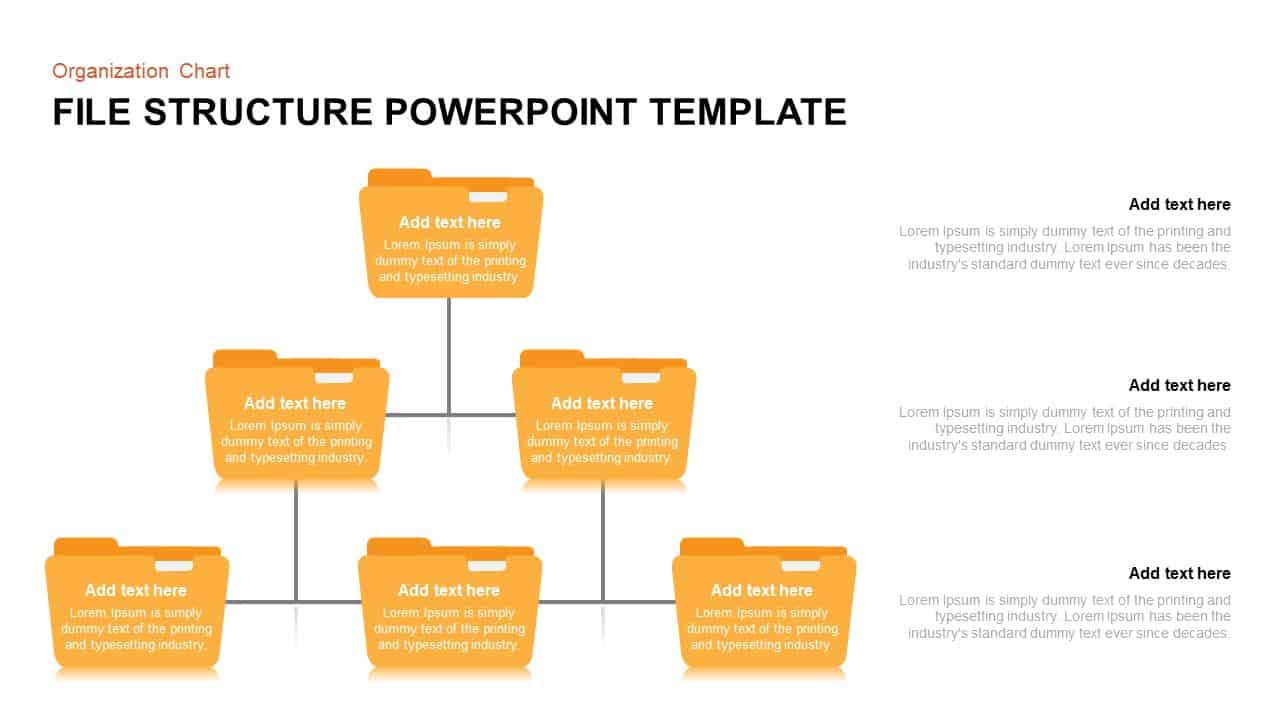
File Structure Organization Chart Template for PowerPoint & Google Slides
Org Chart
Four Business Structure Types Comparison Diagram Template for PowerPoint & Google Slides
Business Strategy
Capital Structure Dynamic Split Chart Template for PowerPoint & Google Slides
Comparison Chart
Org Chart Structure template for PowerPoint & Google Slides
Org Chart
Organizational Chart Structure template for PowerPoint & Google Slides
Business Plan
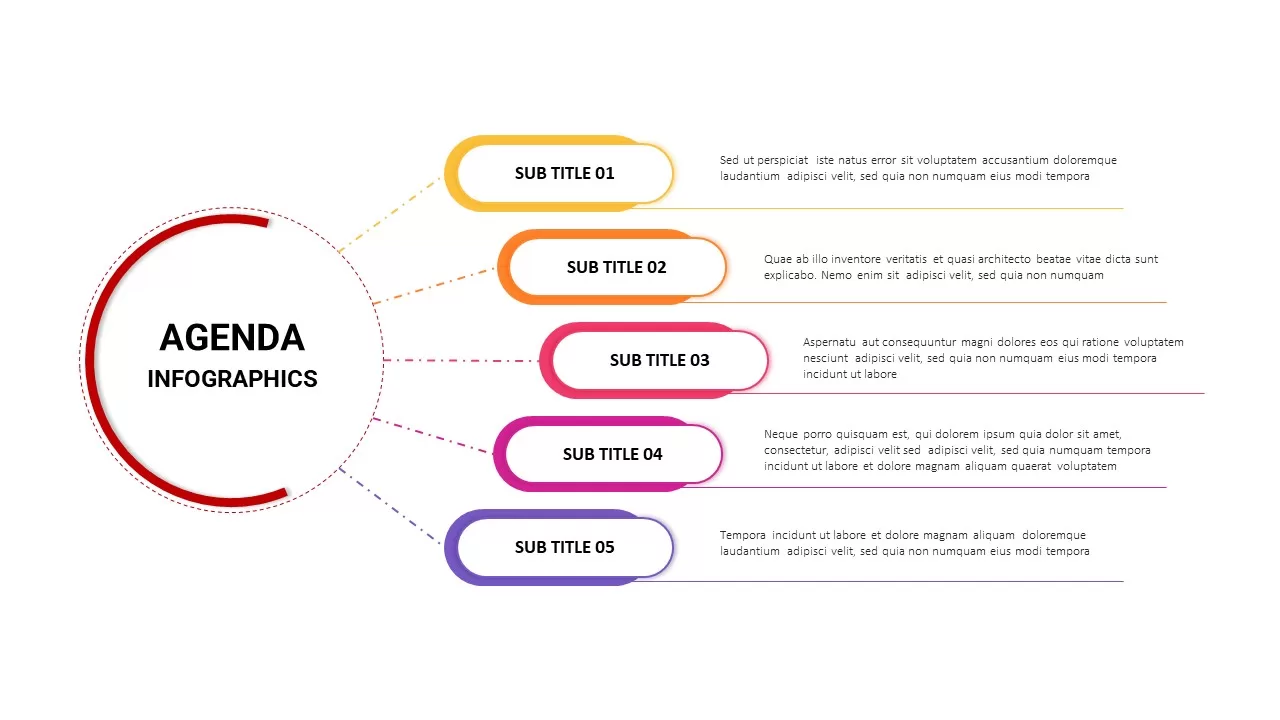
Agenda Infographics Structure template for PowerPoint & Google Slides
Business Plan
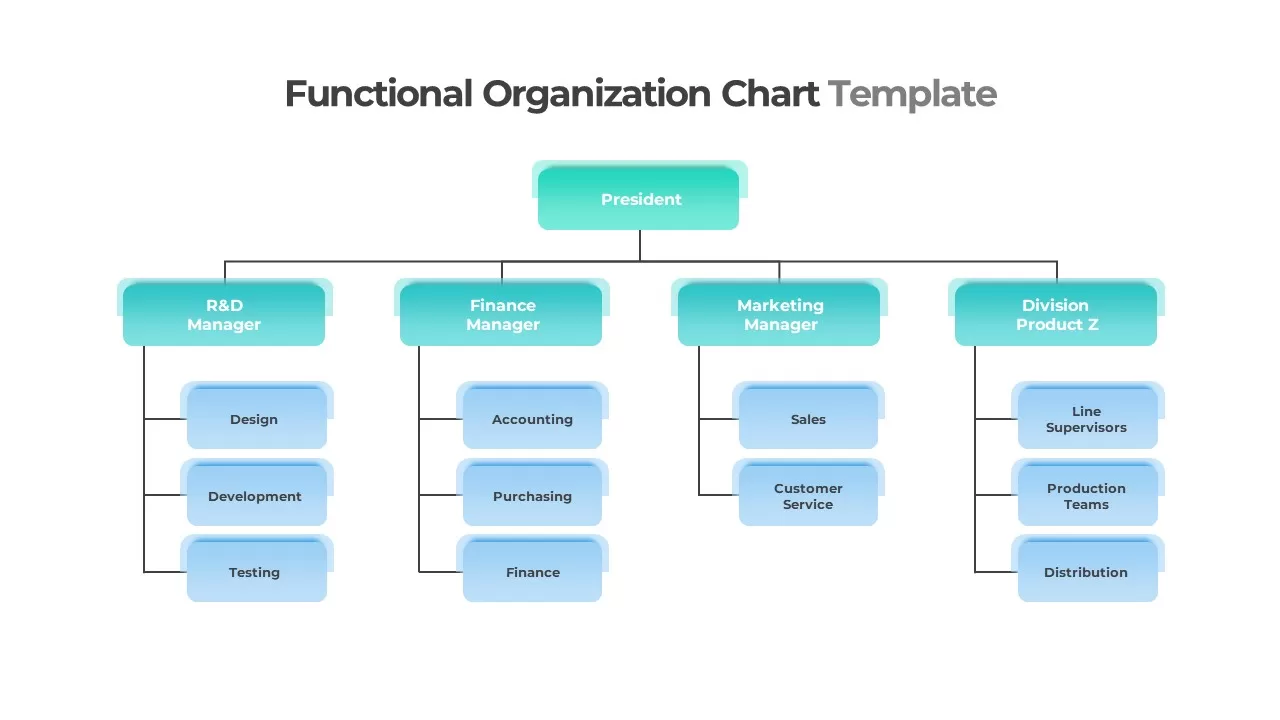
Functional Organization Chart Structure Template for PowerPoint & Google Slides
Org Chart
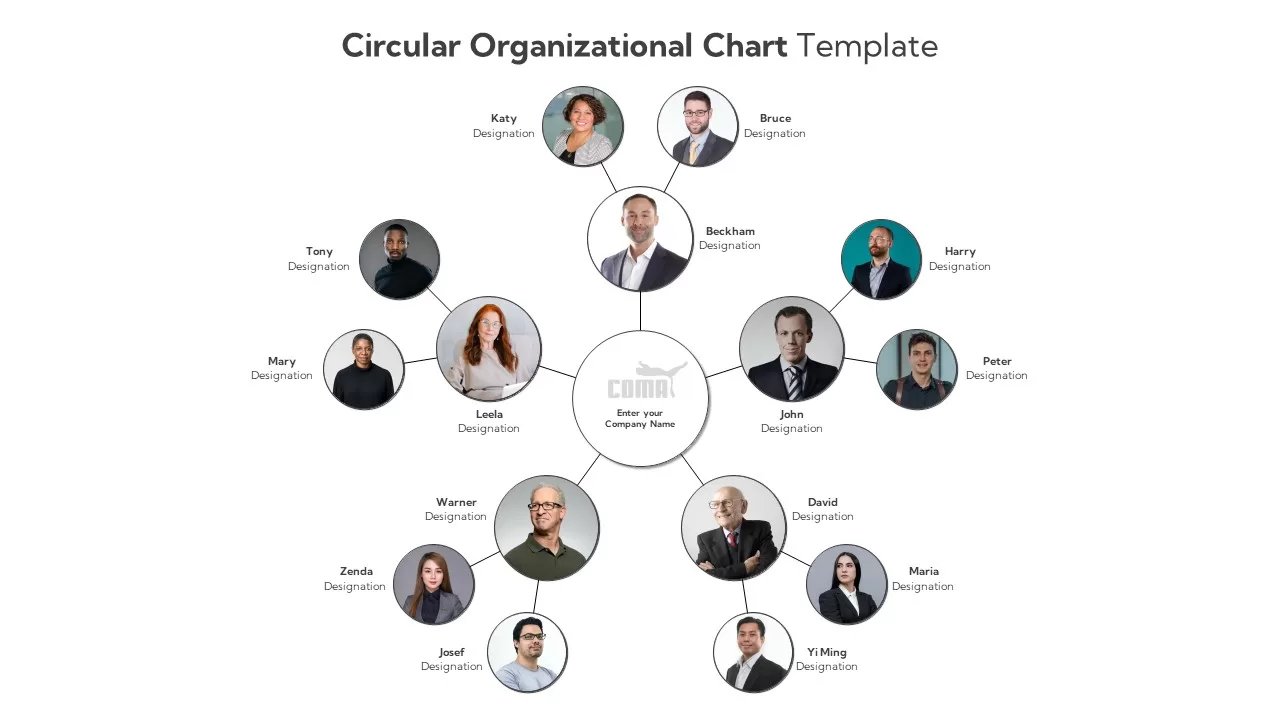
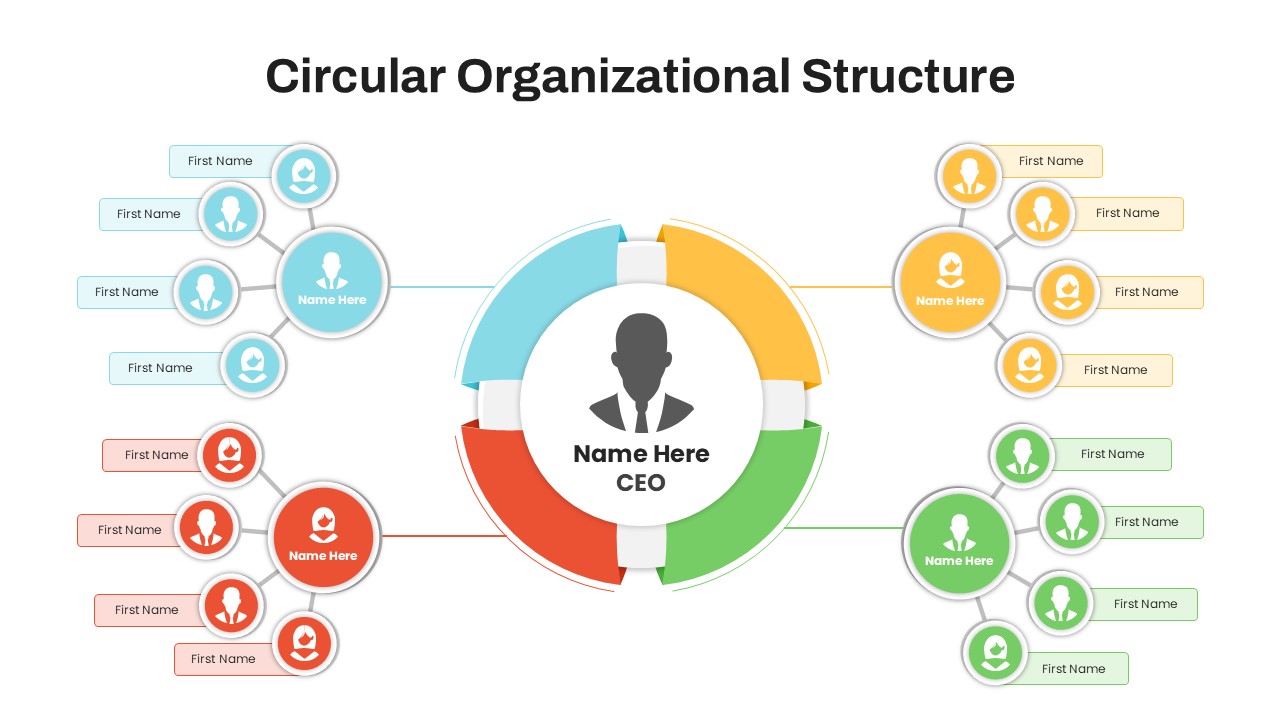
Circular Organizational Structure Layout Template for PowerPoint & Google Slides
Org Chart
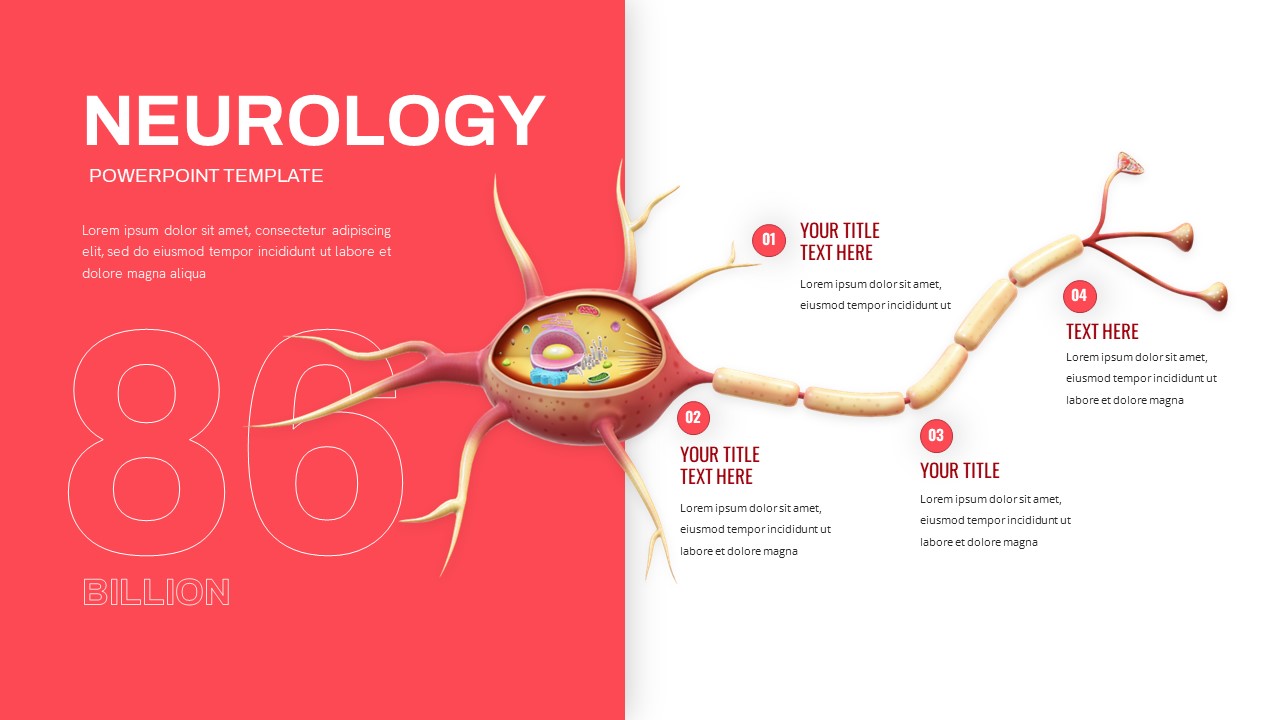
Neurology Neuron Structure Process Flow Template for PowerPoint & Google Slides
Health
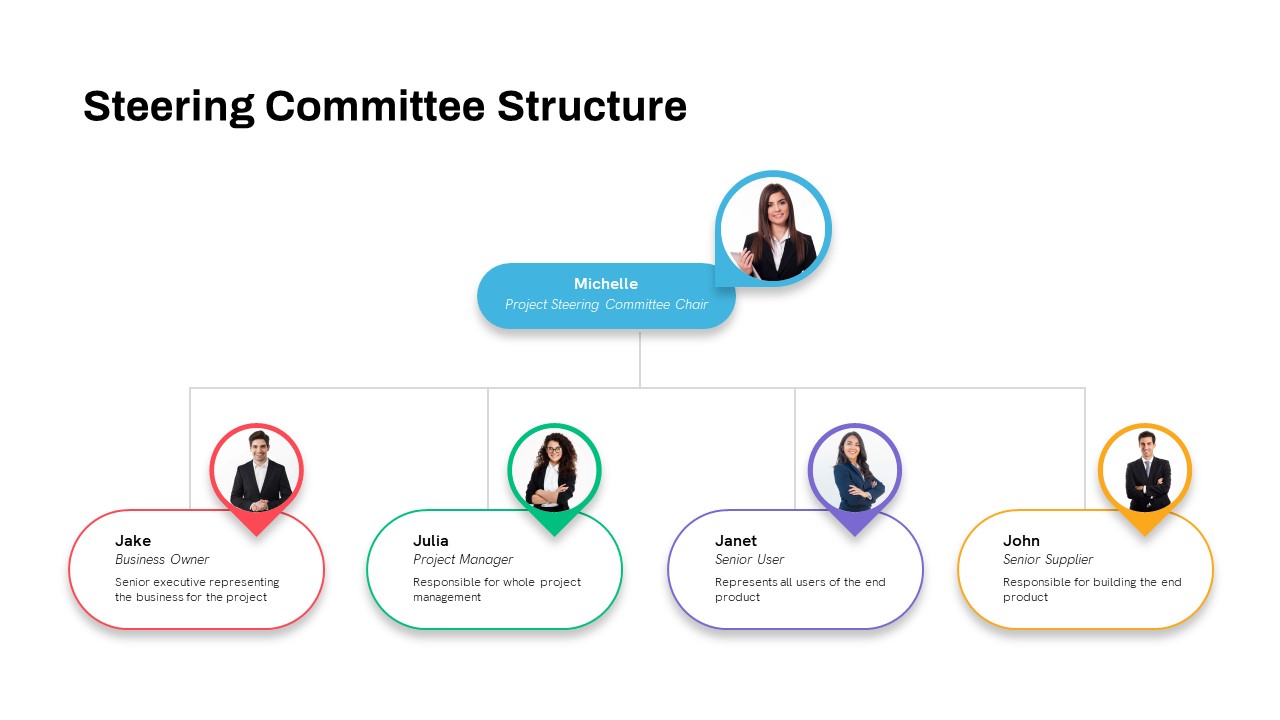
Steering Committee Structure and Roles Template for PowerPoint & Google Slides
Decks
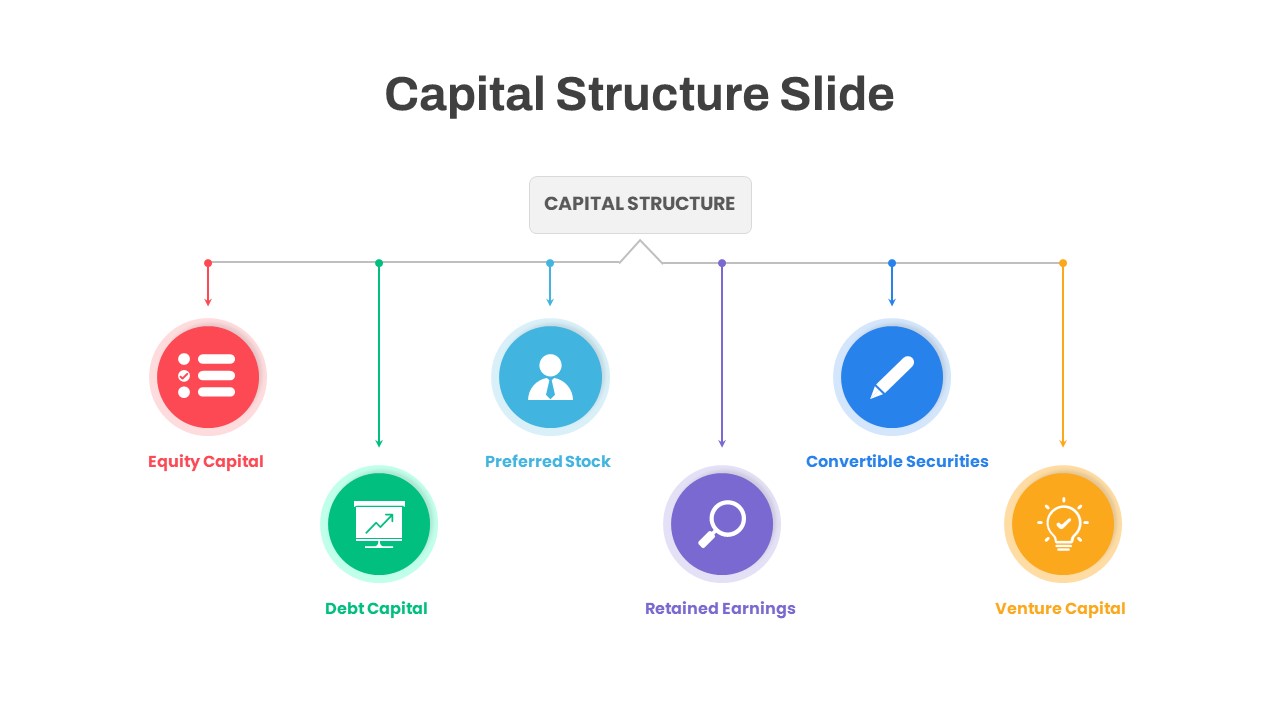
Capital Structure Hub & Spoke Diagram Template for PowerPoint & Google Slides
Process
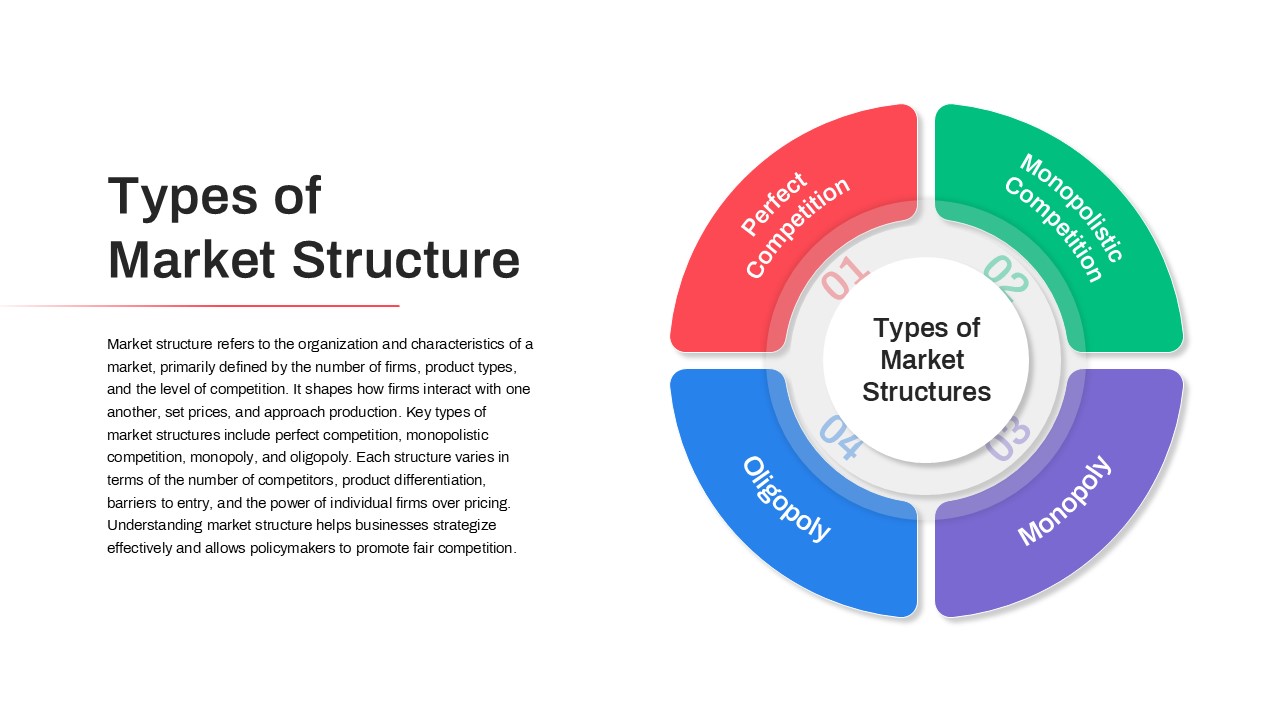
Types of Market Structure Infographic Template for PowerPoint & Google Slides
Comparison
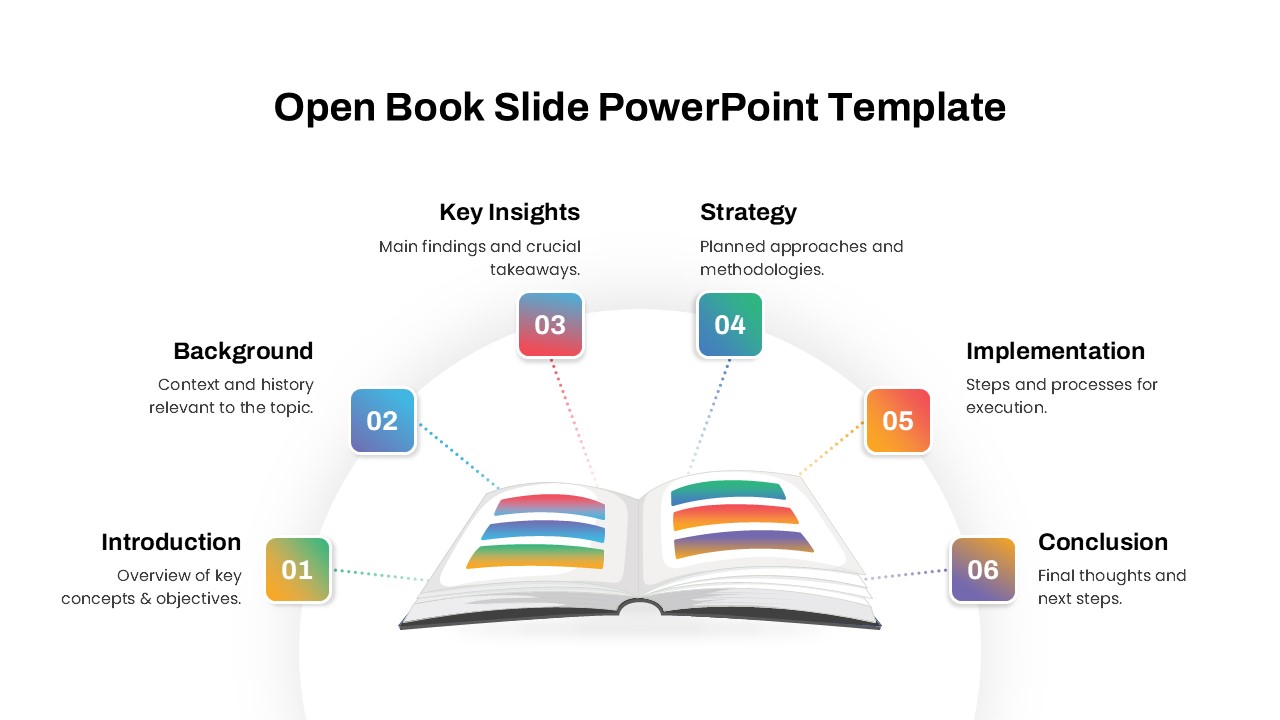
Open Book Chapter Agenda and Structure Template for PowerPoint & Google Slides
Infographics
Circular Organizational Structure Template for PowerPoint & Google Slides
Org Chart
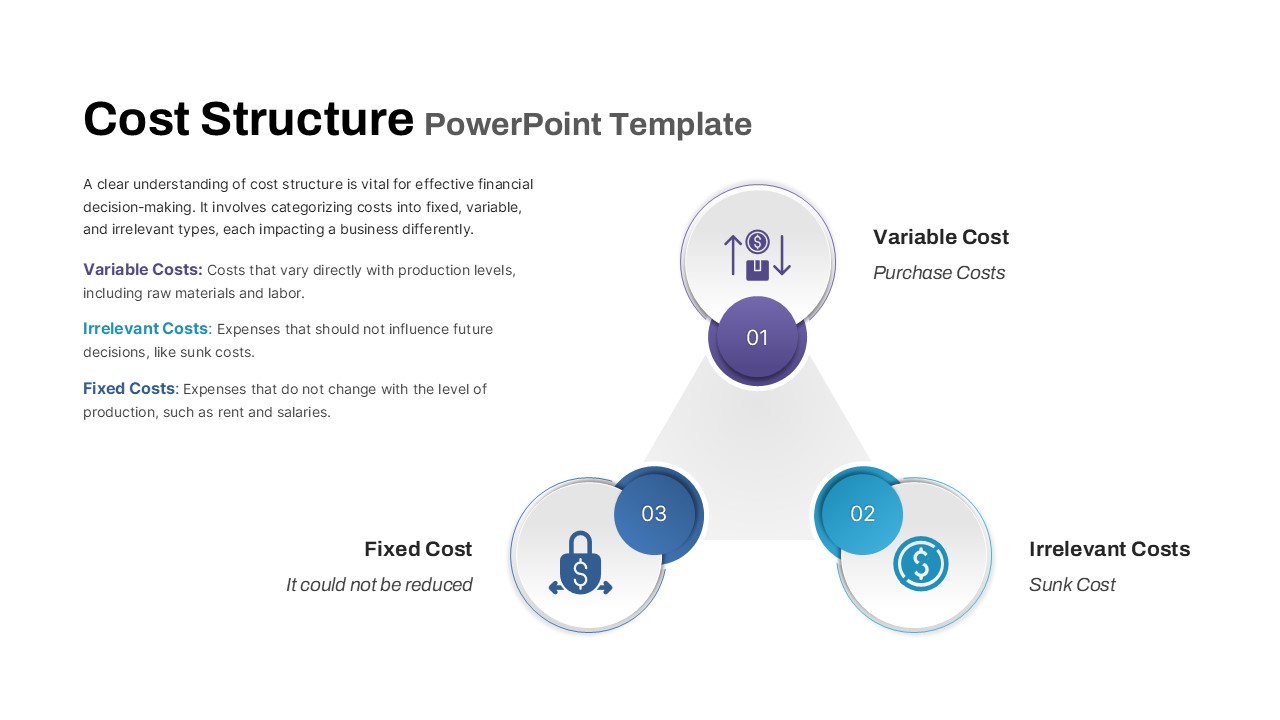
Cost Structure Triangle Diagram Template for PowerPoint & Google Slides
Finance
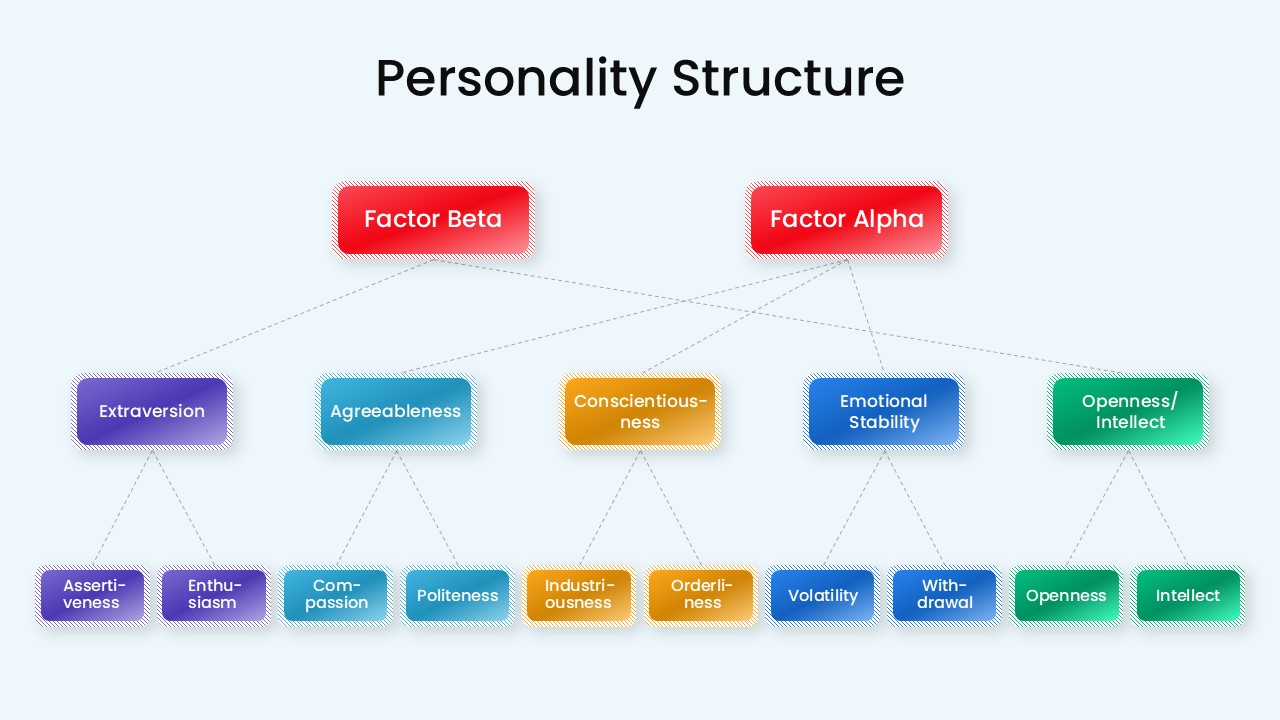
Personality Structure Hierarchy Diagram Template for PowerPoint & Google Slides
Org Chart
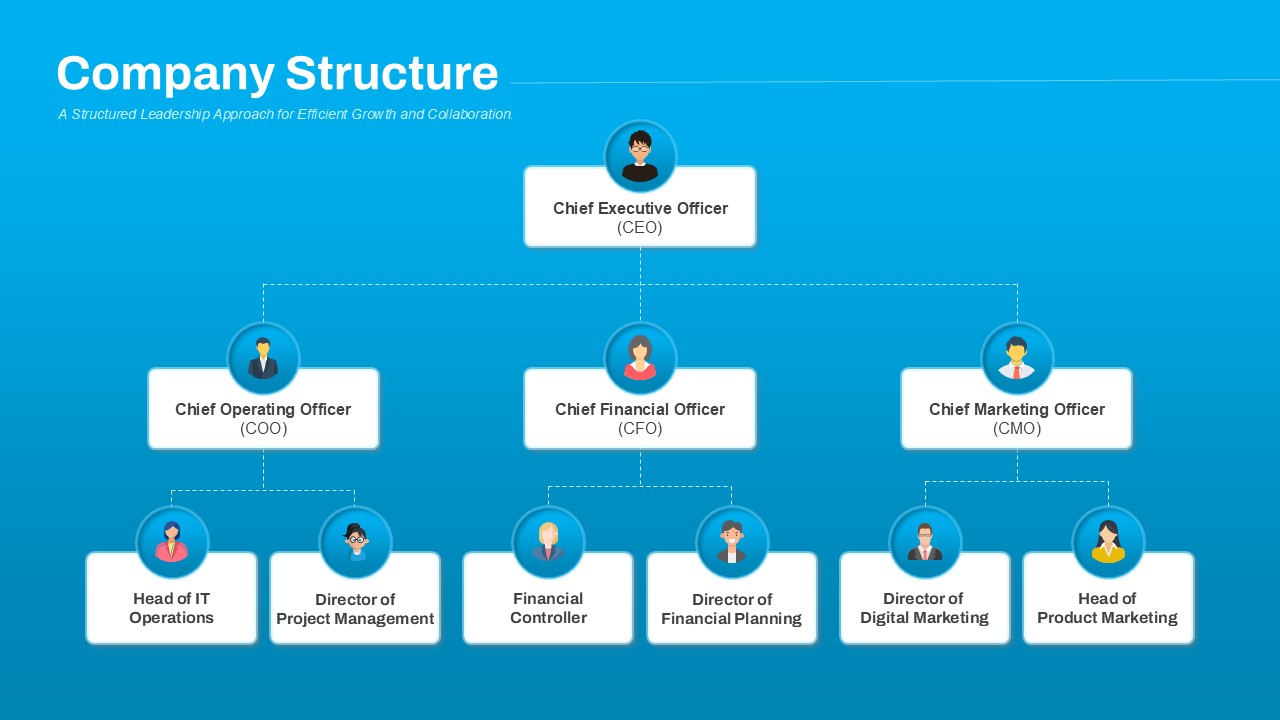
Company Structure Hierarchical Org Chart Template for PowerPoint & Google Slides
Org Chart
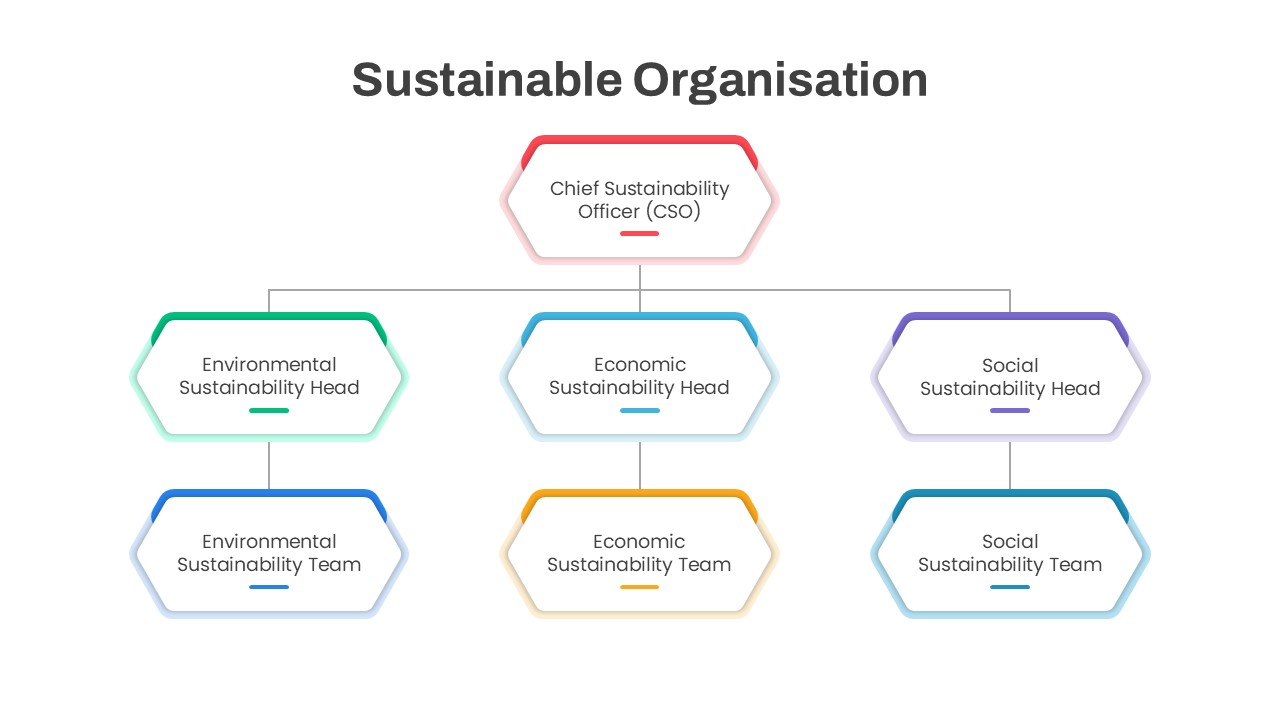
Sustainable Organisation Structure template for PowerPoint & Google Slides
Business
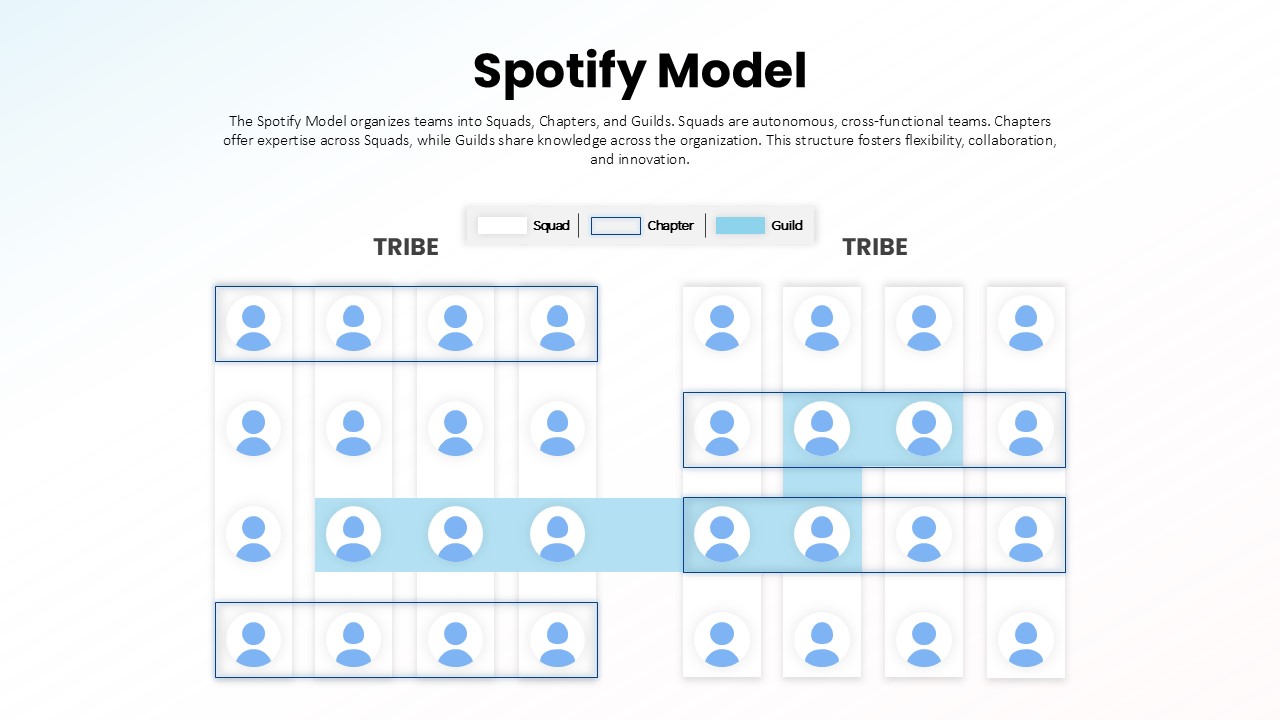
Spotify Model Organizational Structure template for PowerPoint & Google Slides
Business Strategy
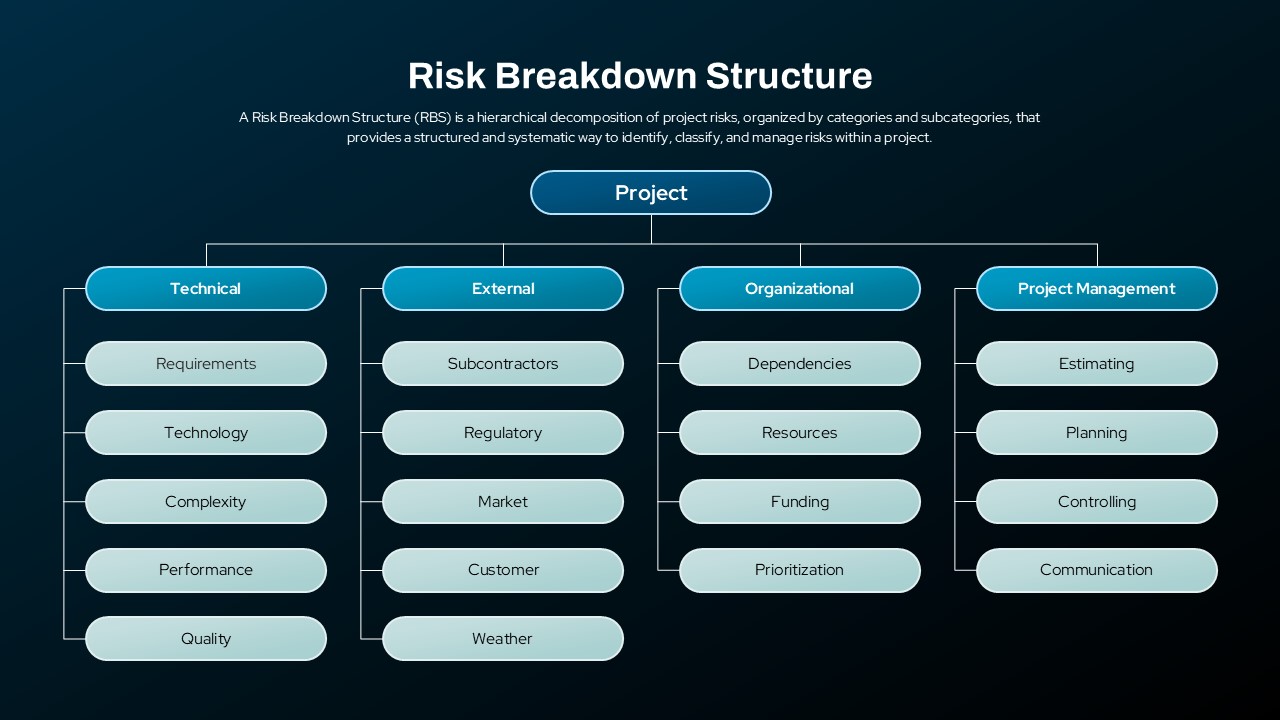
Risk Breakdown Structure Diagram Template for PowerPoint & Google Slides
Org Chart
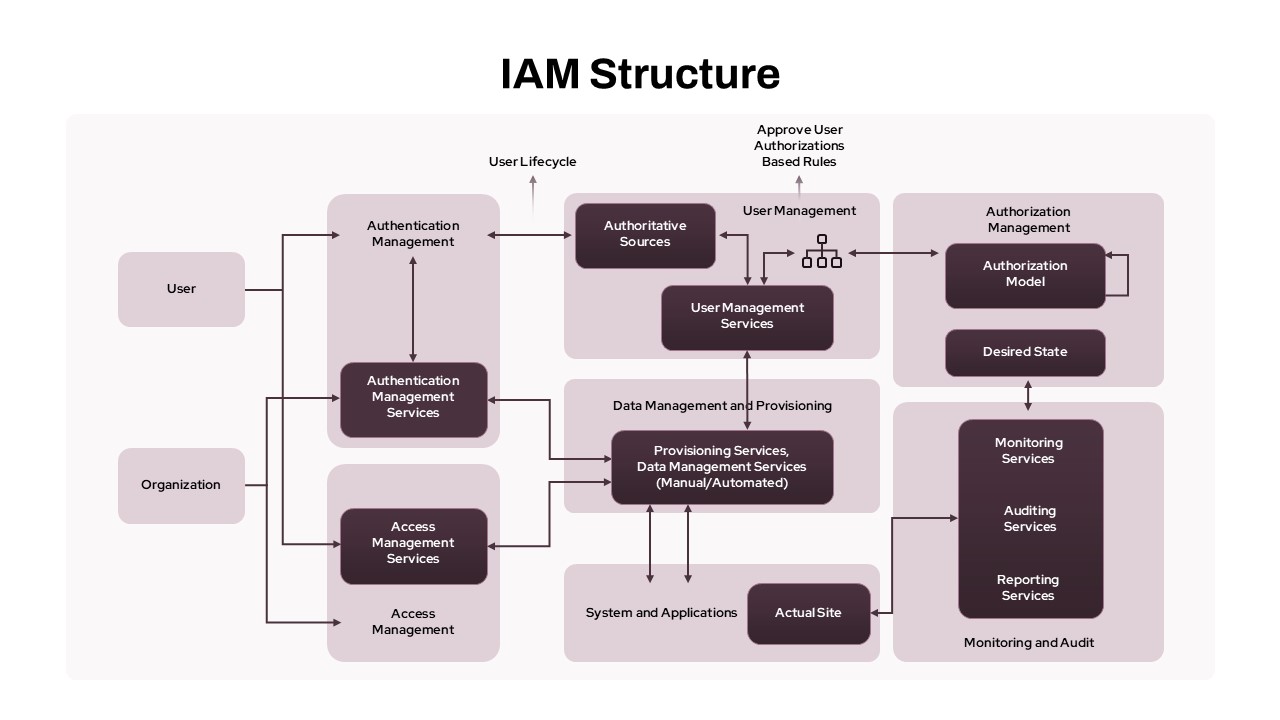
IAM Access Management Structure Diagram Template for PowerPoint & Google Slides
Flow Charts
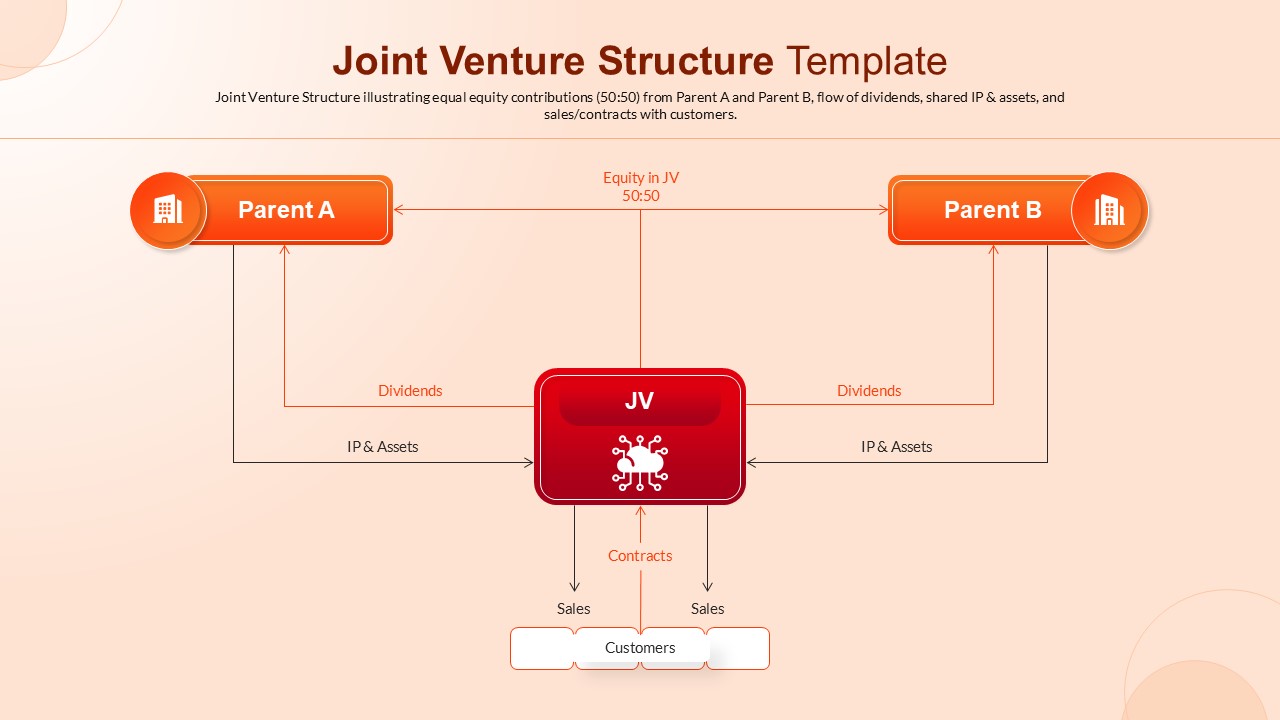
Joint Venture Structure Diagram Template for PowerPoint & Google Slides
Flow Charts

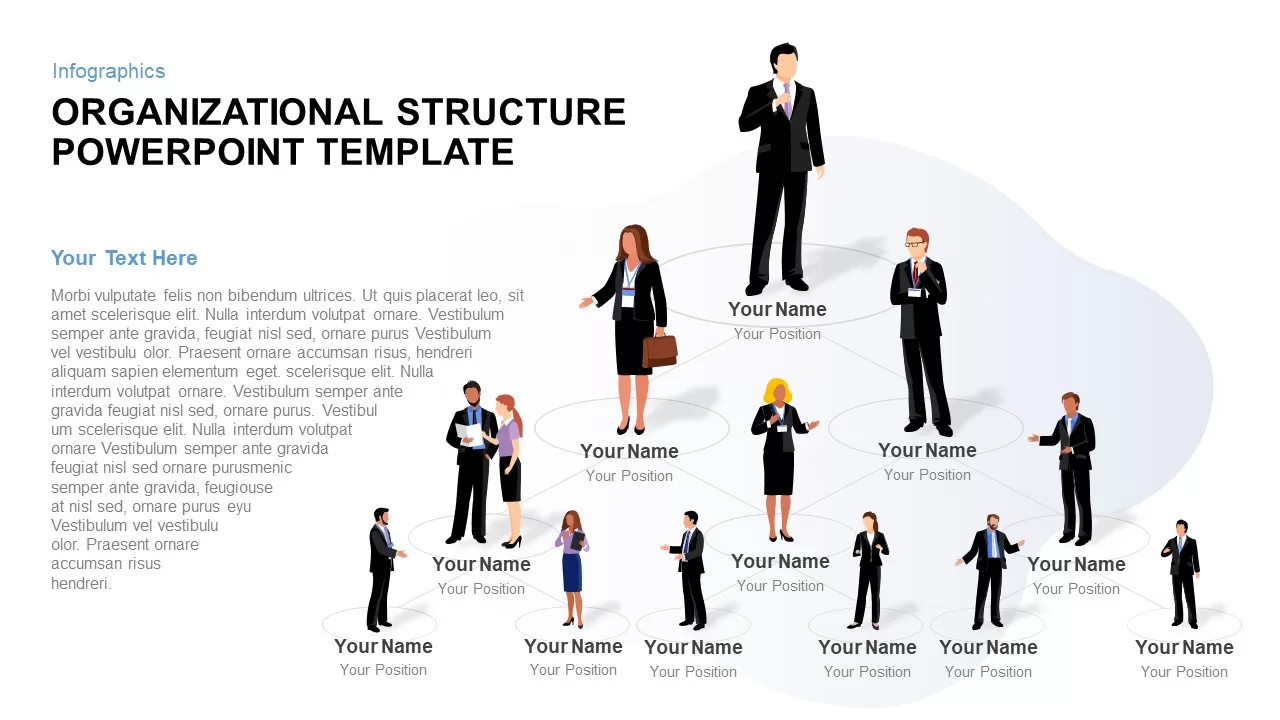
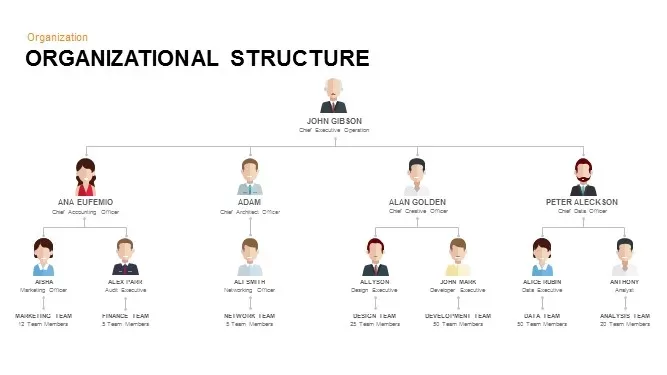
Organizational Structure Diagram for PowerPoint & Google Slides
Org Chart