Distribution Channel Flowchart Template for PowerPoint & Google Slides
Description
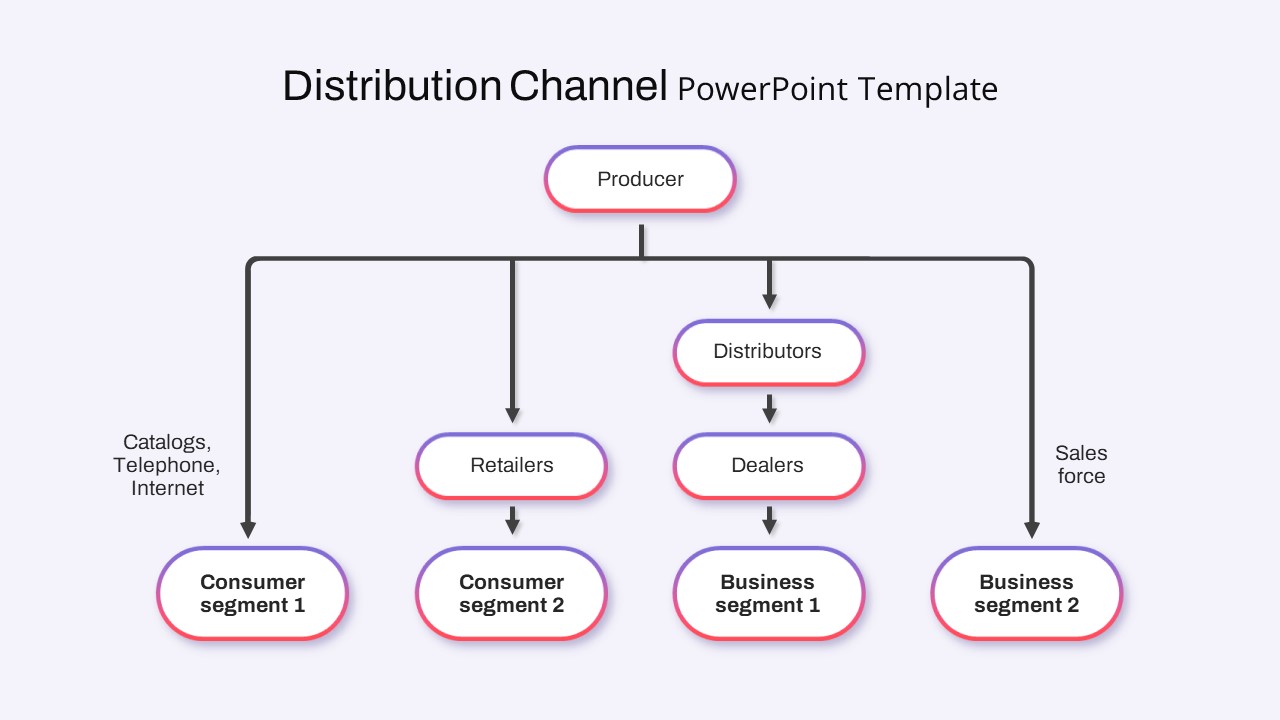
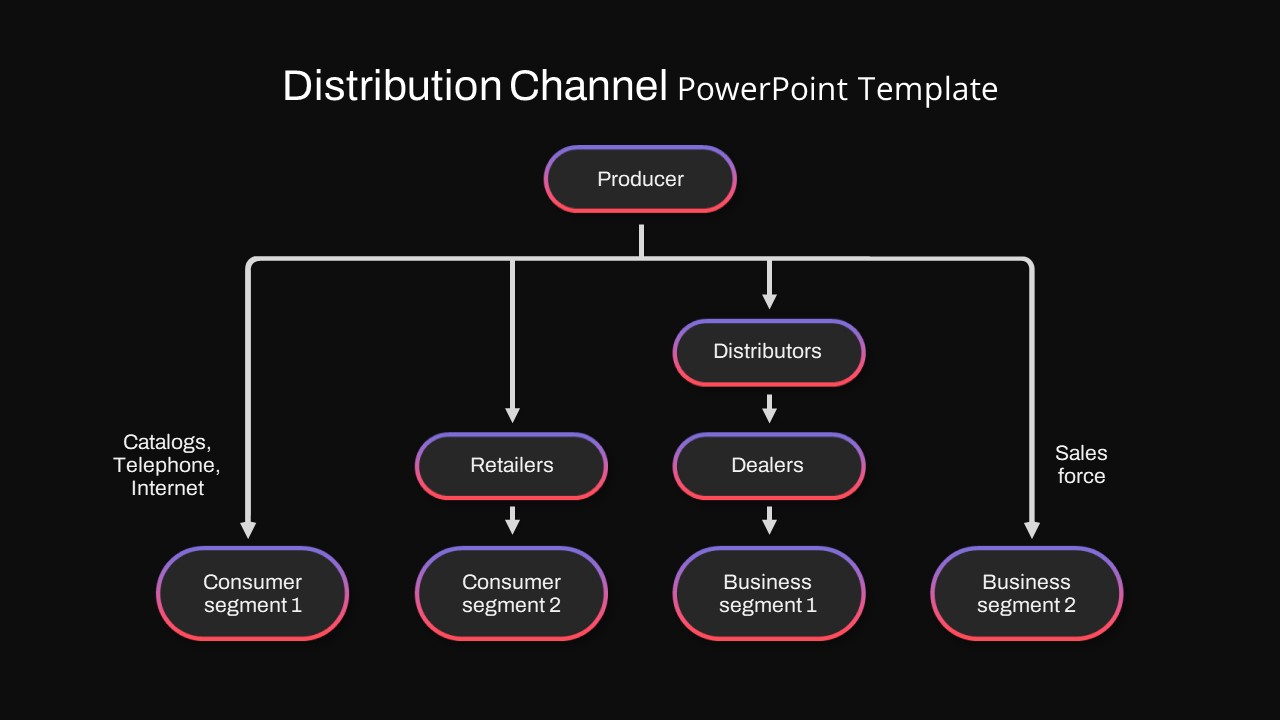
Visualize your product’s journey from producer to end-user with this Distribution Channel Flowchart slide template for PowerPoint & Google Slides. The clean white canvas features a top-down diagram: a “Producer” node feeding into “Distributors” and “Retailers,” which then branch into “Dealers,” “Consumer segments,” and “Business segments.” Direct pathways labeled “Catalogs, Telephone, Internet” and “Sales force” highlight alternate distribution methods. Each node is a fully editable vector shape with gradient borders, and directional arrows maintain clear flow. Master slide support lets you swap labels, adjust connector styles, and recolor nodes in seconds, ensuring seamless alignment with your brand palette. Ample text zones beneath the chart allow for concise descriptions of channel roles, strategies, or KPIs. Optimized for both PowerPoint and Google Slides, this template preserves layout integrity across devices and projection setups, while built-in alignment guides and drag-and-drop icon placeholders streamline customization. Whether you’re presenting supply-chain strategies, go-to-market plans, or sales channel analyses, this flowchart transforms complex network structures into an intuitive, engaging visual narrative.
Who is it for
Supply chain managers, sales directors, marketing strategists, and business consultants who need to illustrate multi-tiered distribution networks, channel strategies, or segmentation models to stakeholders, clients, or executive teams.
Other Uses
Repurpose this slide to map organizational hierarchies, project workflows, decision trees, or customer journey stages. The modular design also suits partner ecosystems, franchise models, and logistics process diagrams.
Login to download this file

Item ID
SB04166
Related Templates

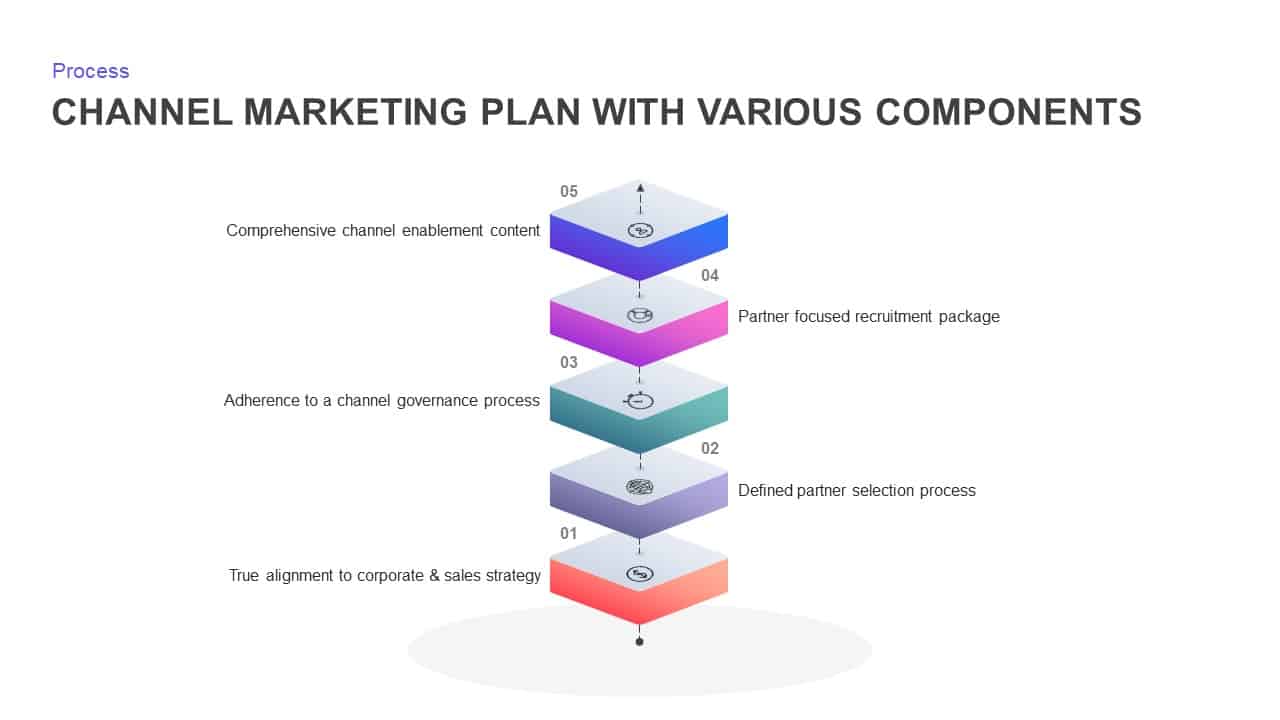
Channel Marketing Plan Layered Diagram Template for PowerPoint & Google Slides
Process
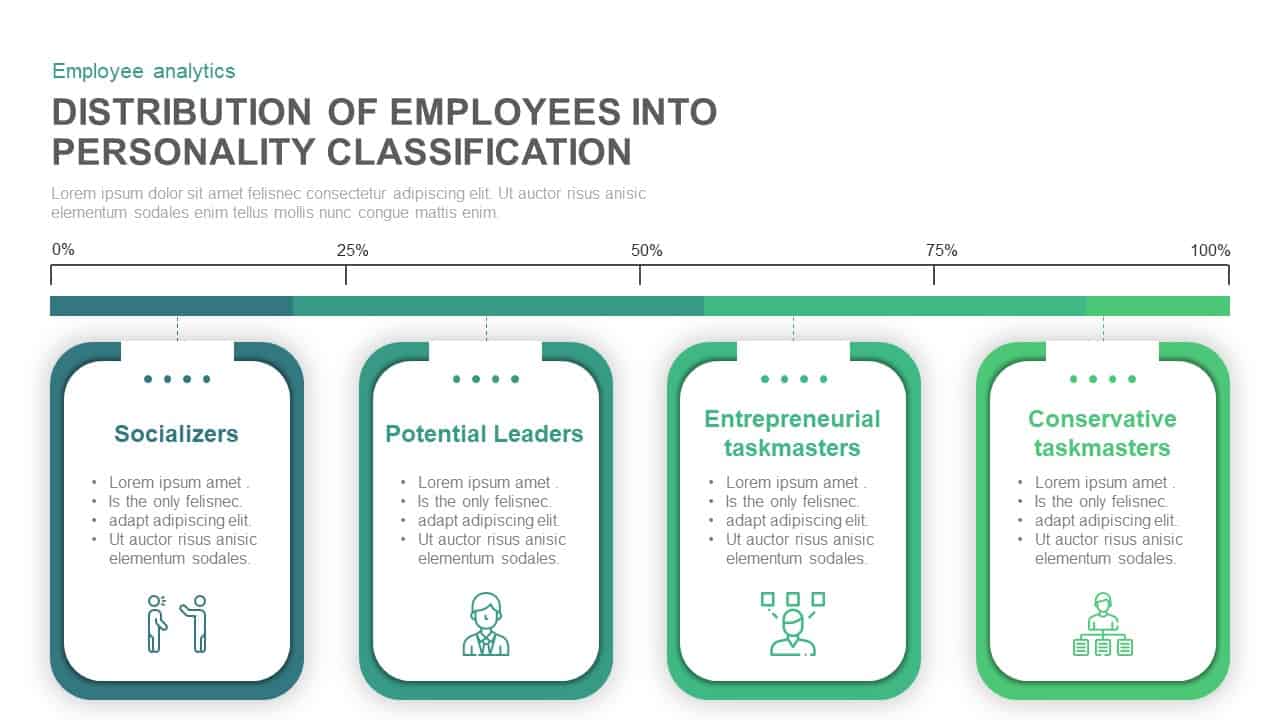
Employee Personality Distribution Chart Template for PowerPoint & Google Slides
Bar/Column
Free Global Market Distribution Map Template for PowerPoint & Google Slides
World Maps
Free
Population Age Distribution Pyramid Chart Template for PowerPoint & Google Slides
Pyramid
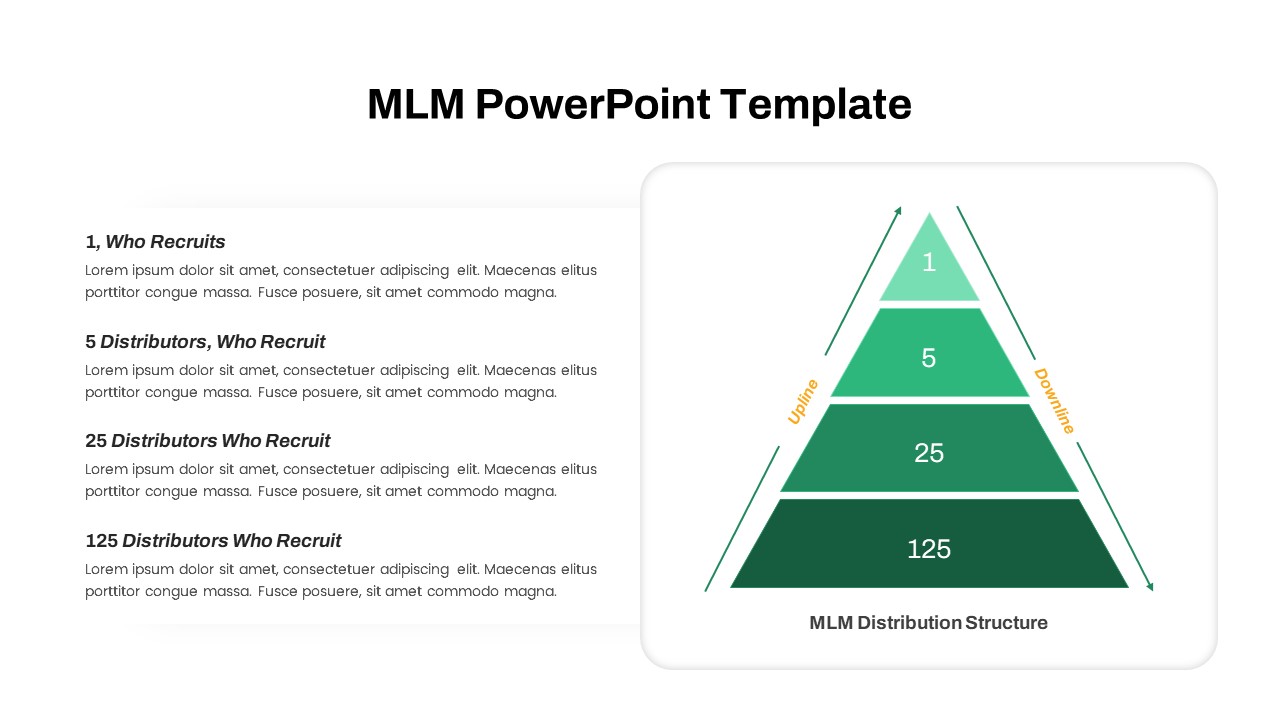
MLM Distribution Pyramid Diagram Template for PowerPoint & Google Slides
Business Models
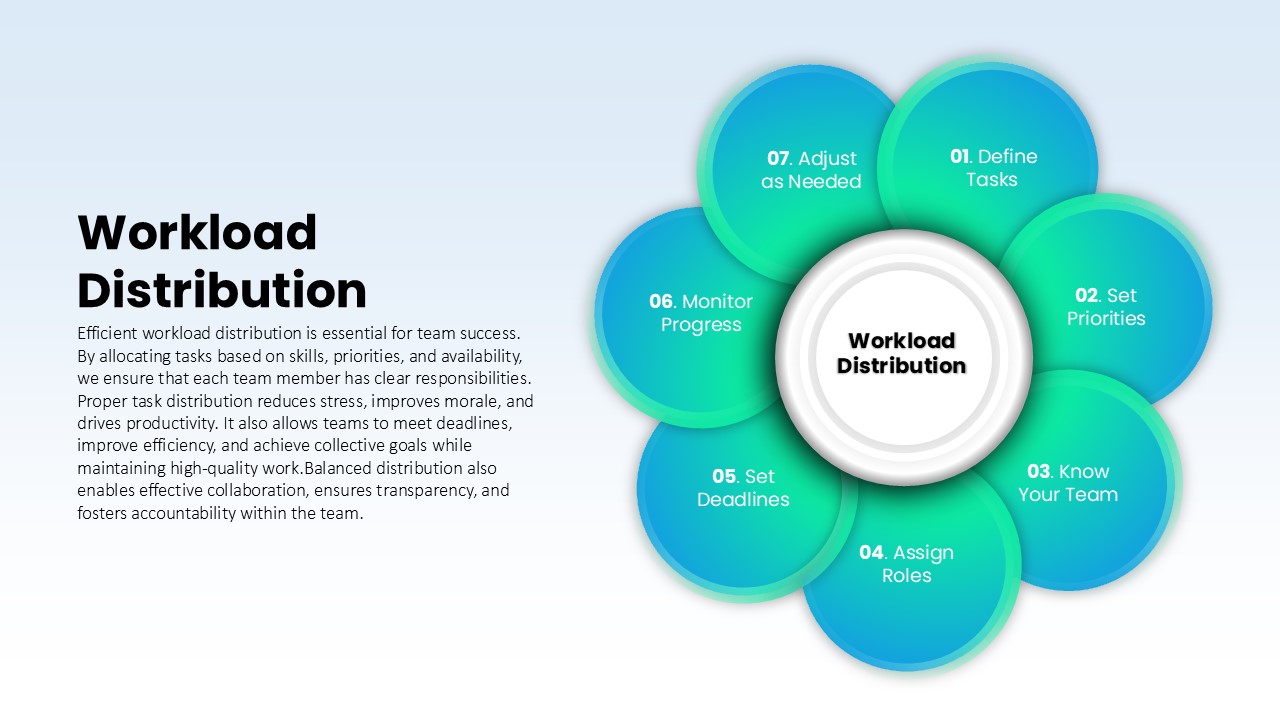
Workload Distribution Circular Diagram Template for PowerPoint & Google Slides
Circular
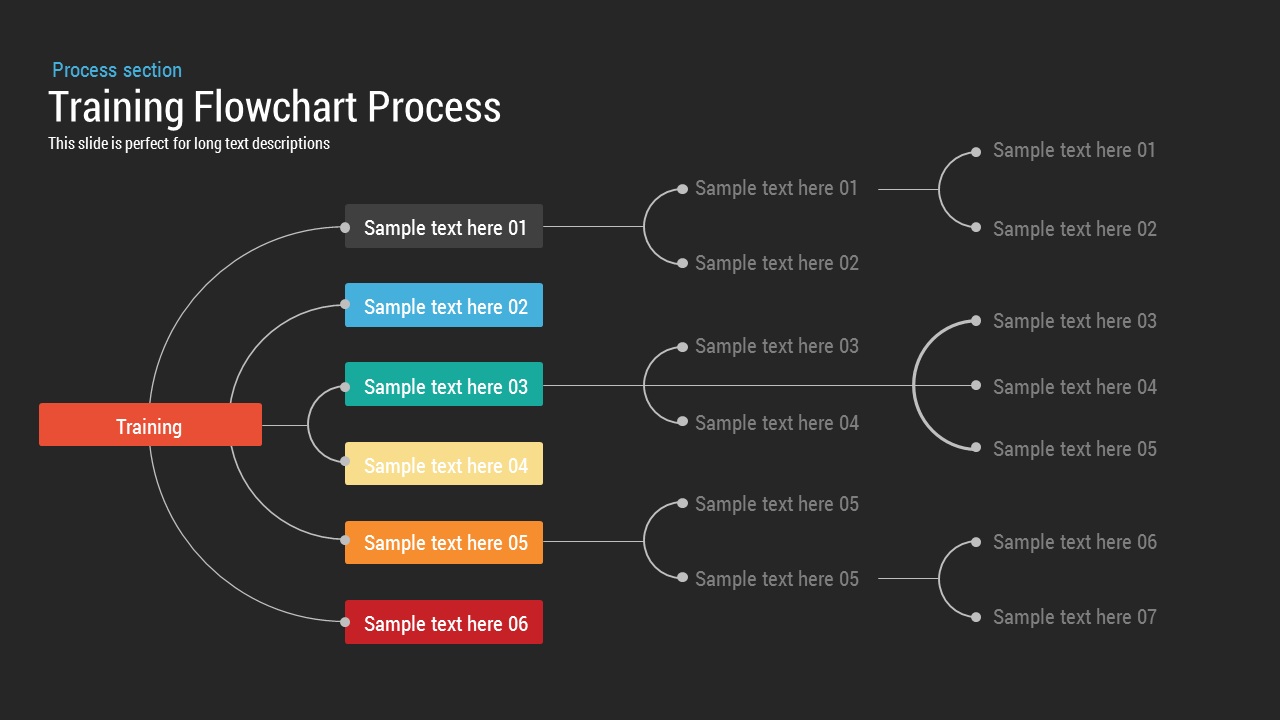
Training Flowchart template for PowerPoint & Google Slides
Flow Charts
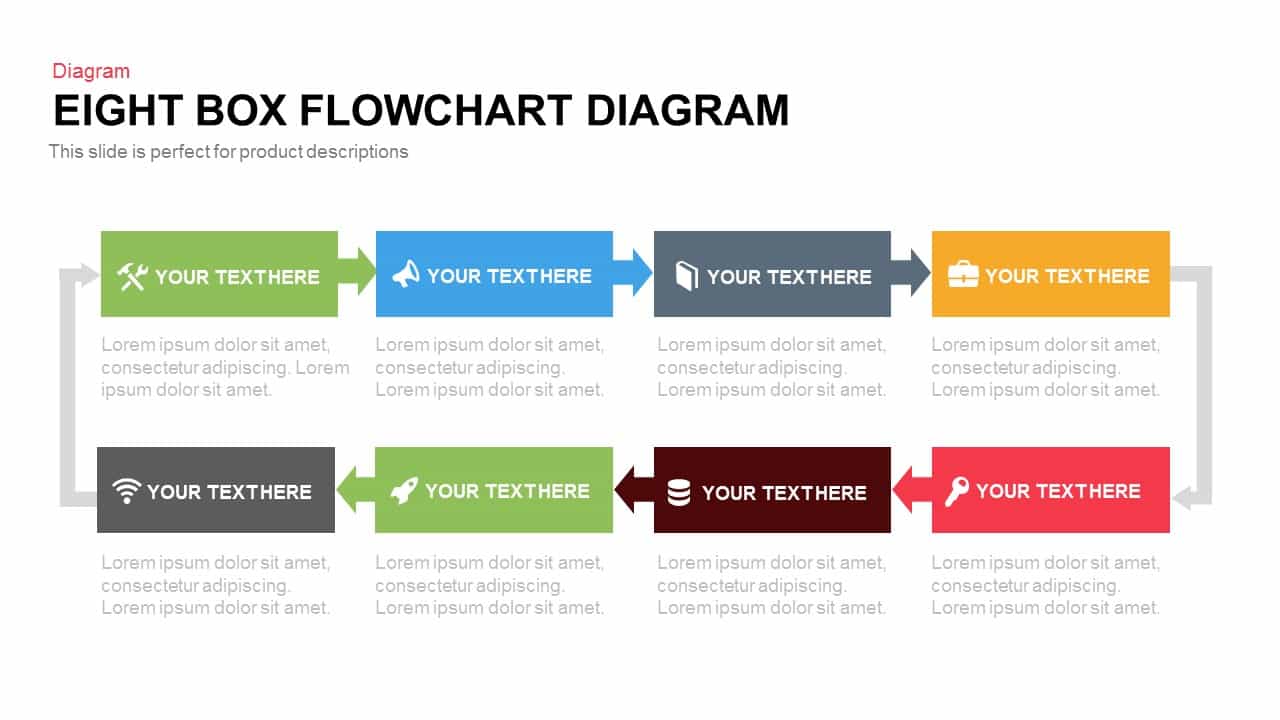
Eight Box Flowchart template for PowerPoint & Google Slides
Flow Charts

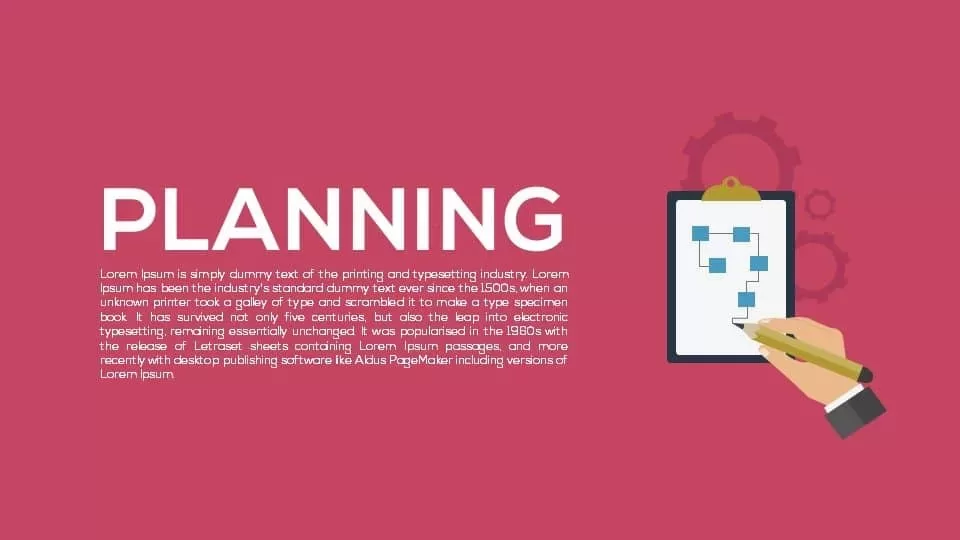
Planning Metaphor Flowchart Slide Template for PowerPoint & Google Slides
Process
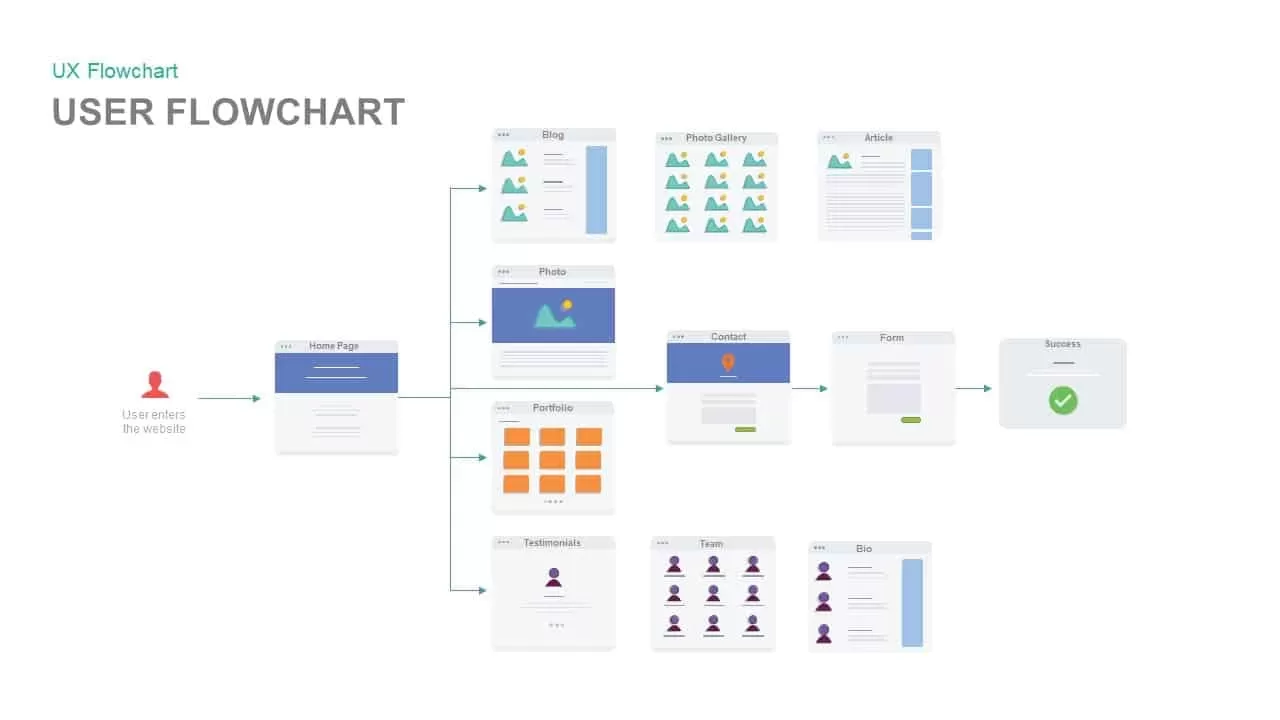
Website User Flowchart Diagram Template for PowerPoint & Google Slides
Process

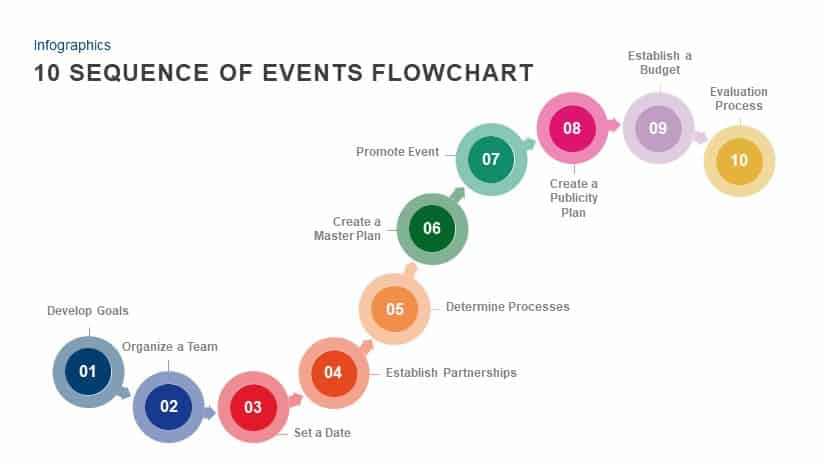
10 Sequence of Events Flowchart template for PowerPoint & Google Slides
Flow Charts
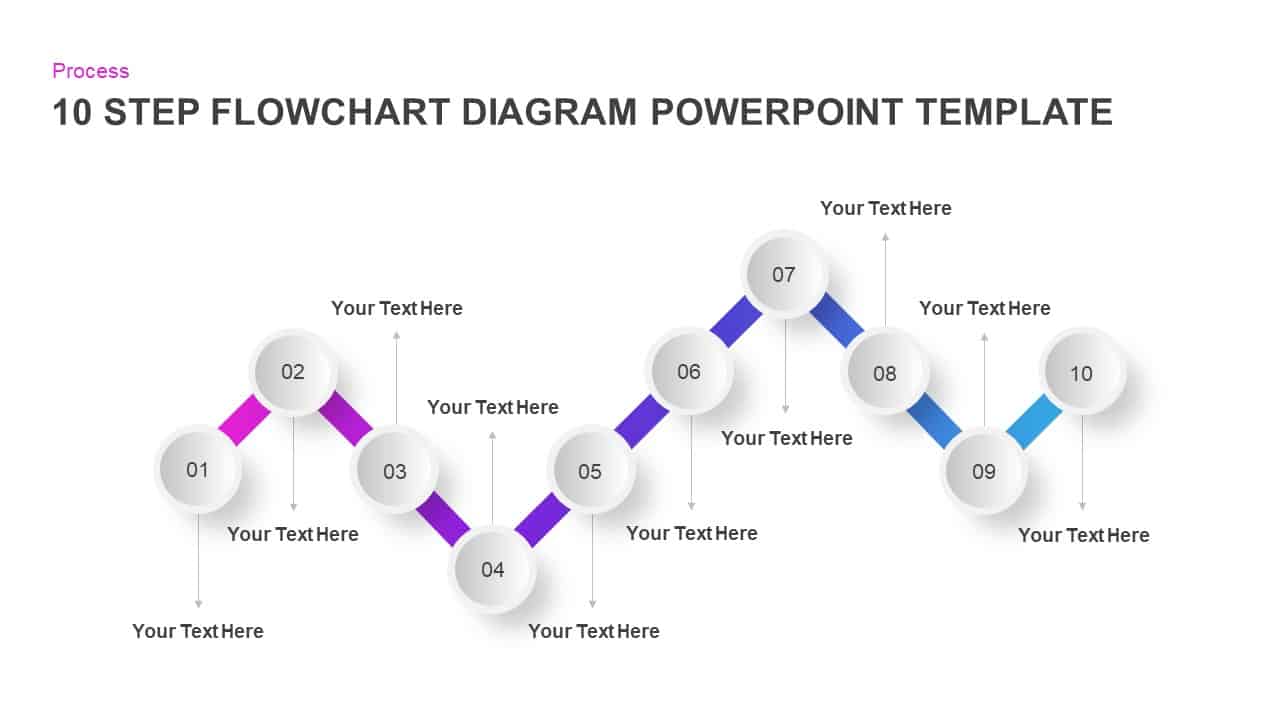
Gradient Ten-Step Flowchart Diagram Template for PowerPoint & Google Slides
Process
Three-Step Flowchart Process Diagram Template for PowerPoint & Google Slides
Flow Charts
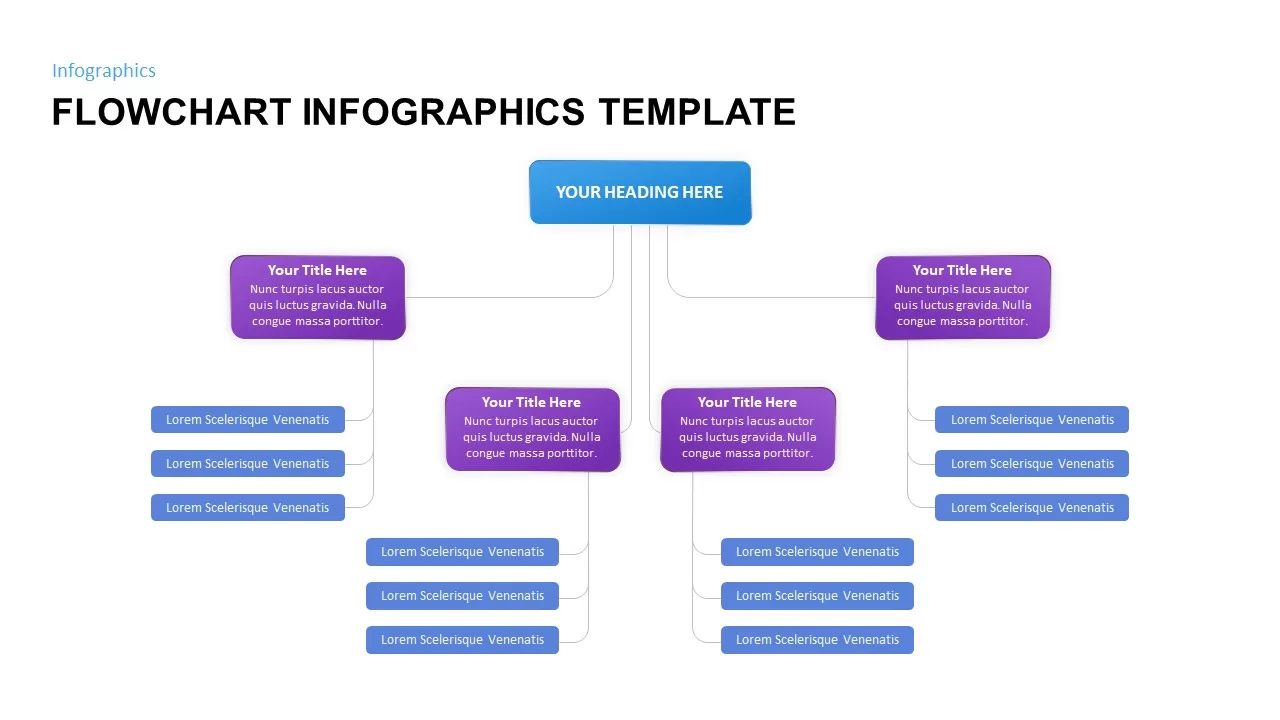
Flowchart Infographics Template for PowerPoint & Google Slides
Infographics
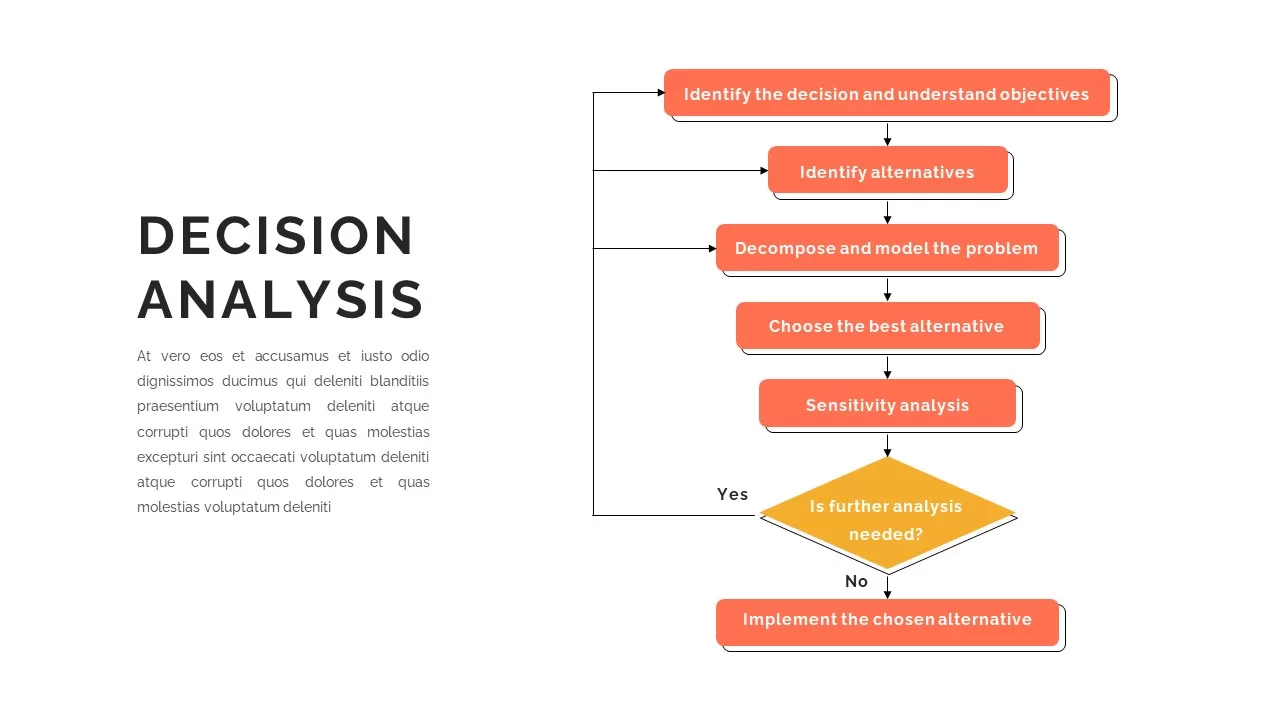
Decision Analysis Process Flowchart Template for PowerPoint & Google Slides
Flow Charts
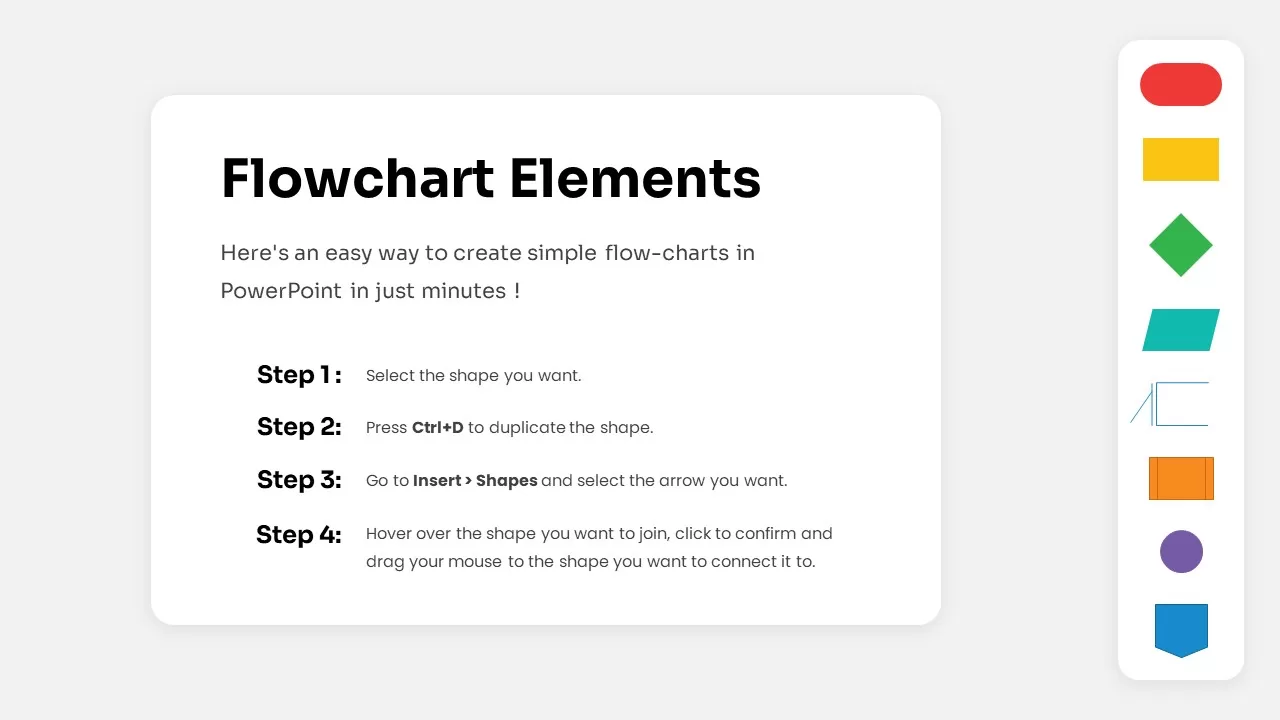
Free Flowchart Elements Tutorial Slide Template for PowerPoint & Google Slides
Flow Charts
Free
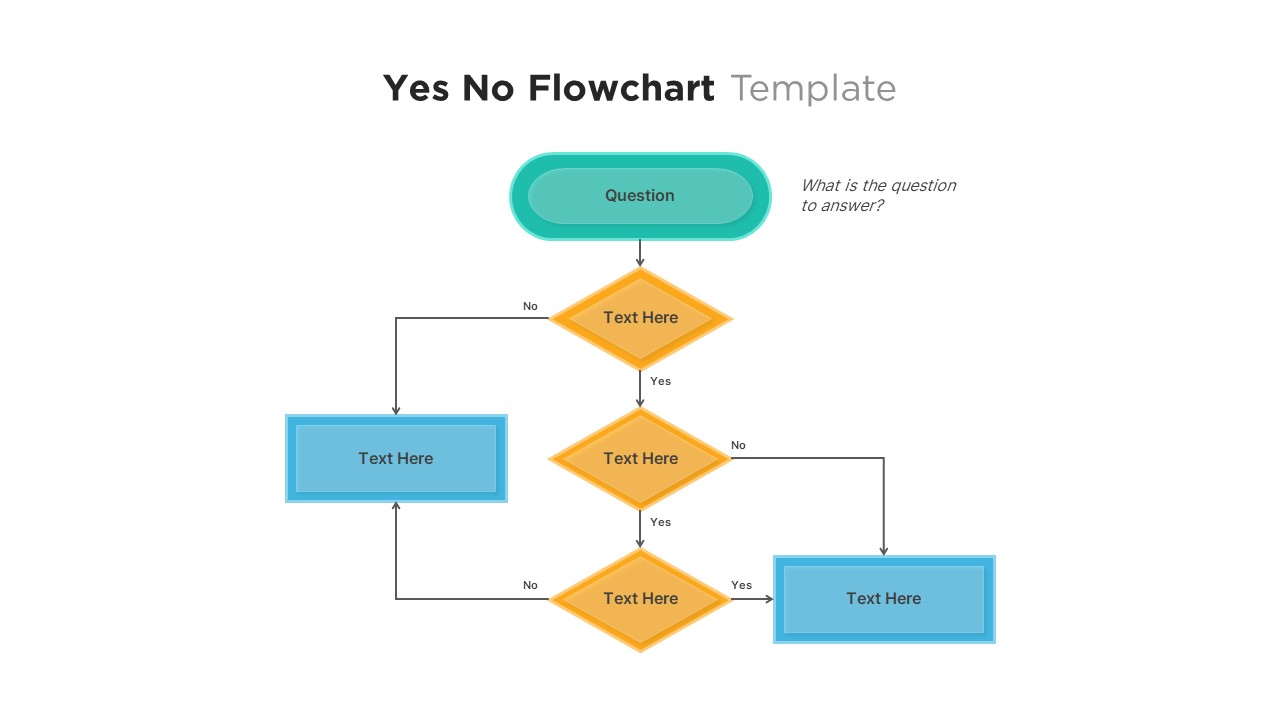
Professional Yes No Decision Flowchart Template for PowerPoint & Google Slides
Flow Charts
Simple Flowchart Process Diagram Template for PowerPoint & Google Slides
Flow Charts
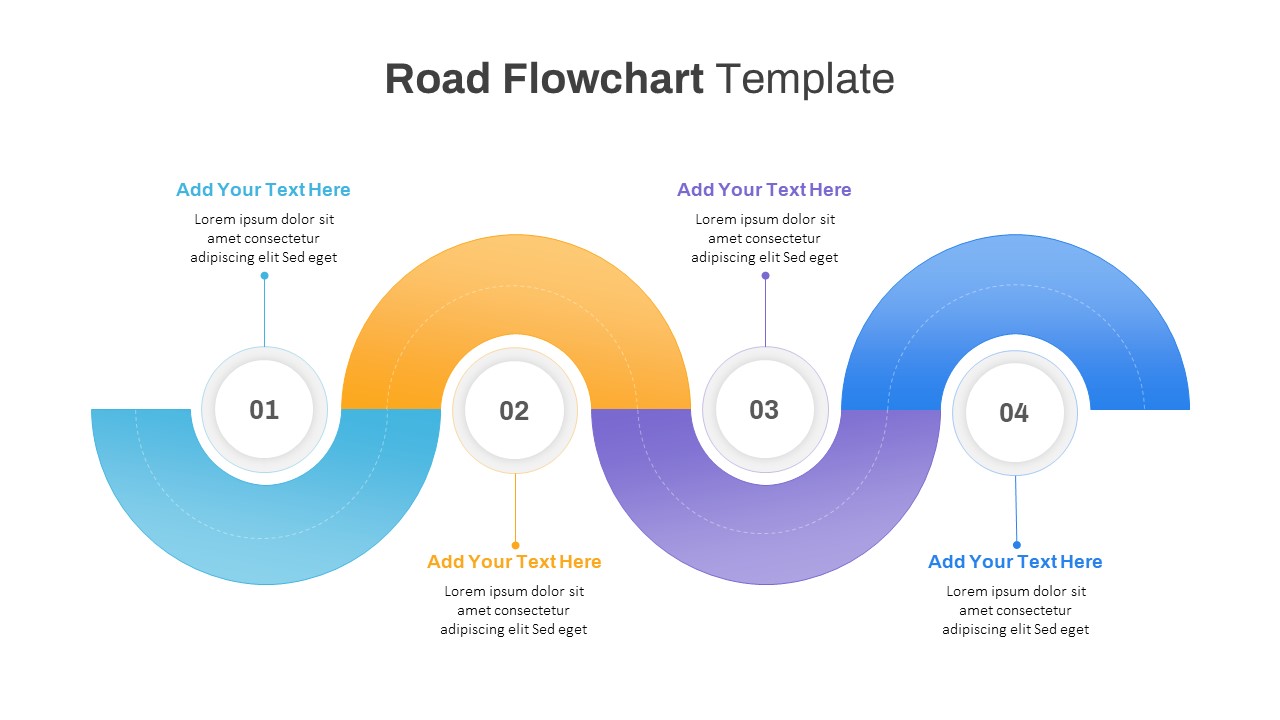
Road Flowchart Process with Four Steps Template for PowerPoint & Google Slides
Flow Charts
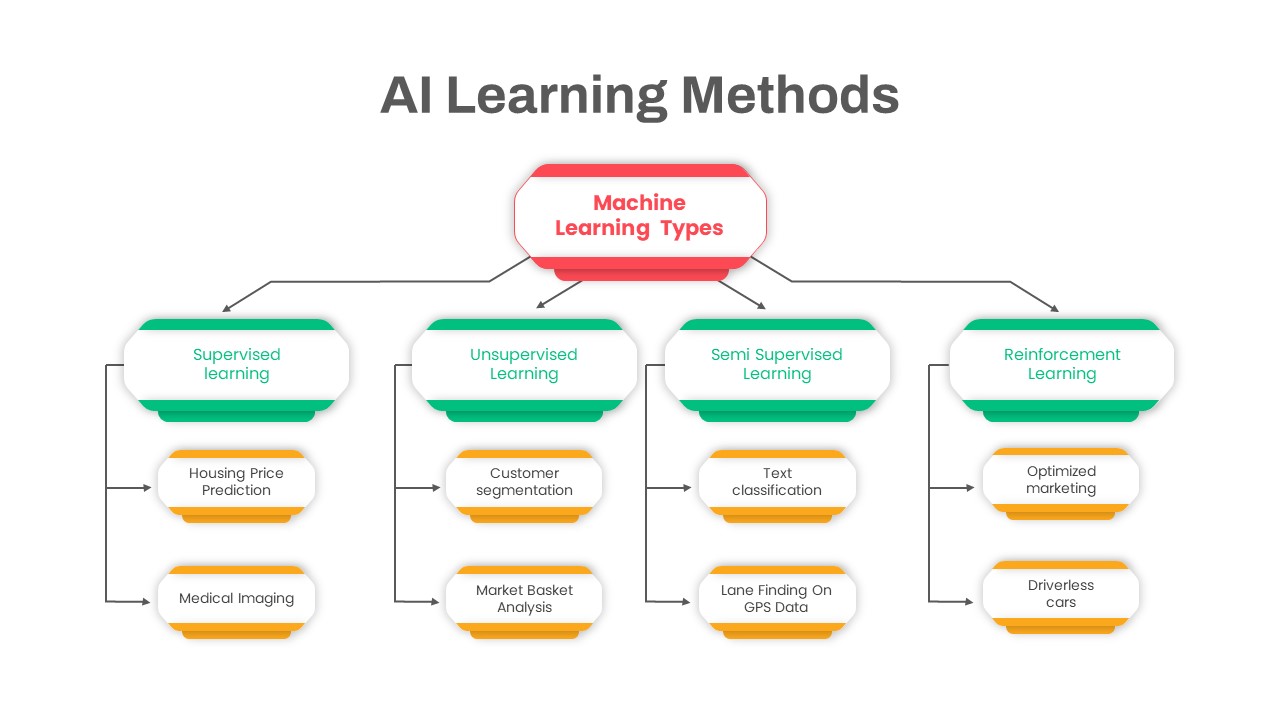
AI Learning Methods Flowchart Diagram Template for PowerPoint & Google Slides
Flow Charts
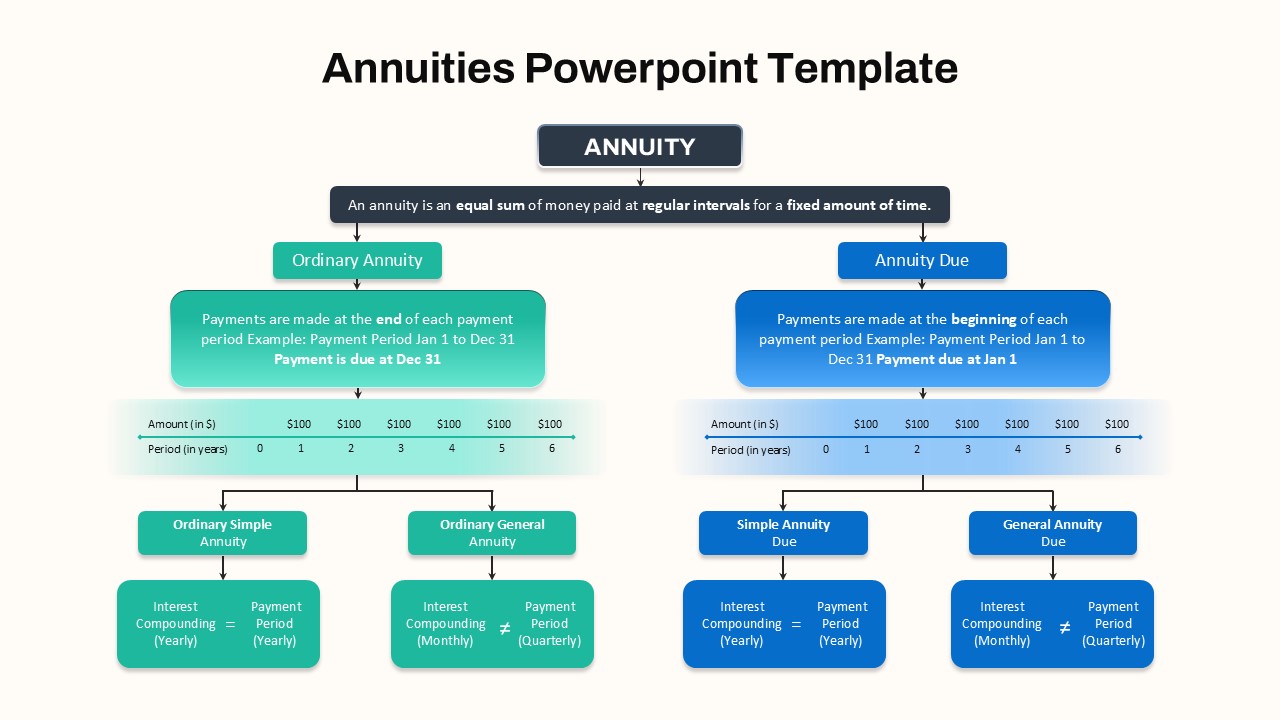
Hierarchical Annuity Comparison Flowchart Template for PowerPoint & Google Slides
Business Report
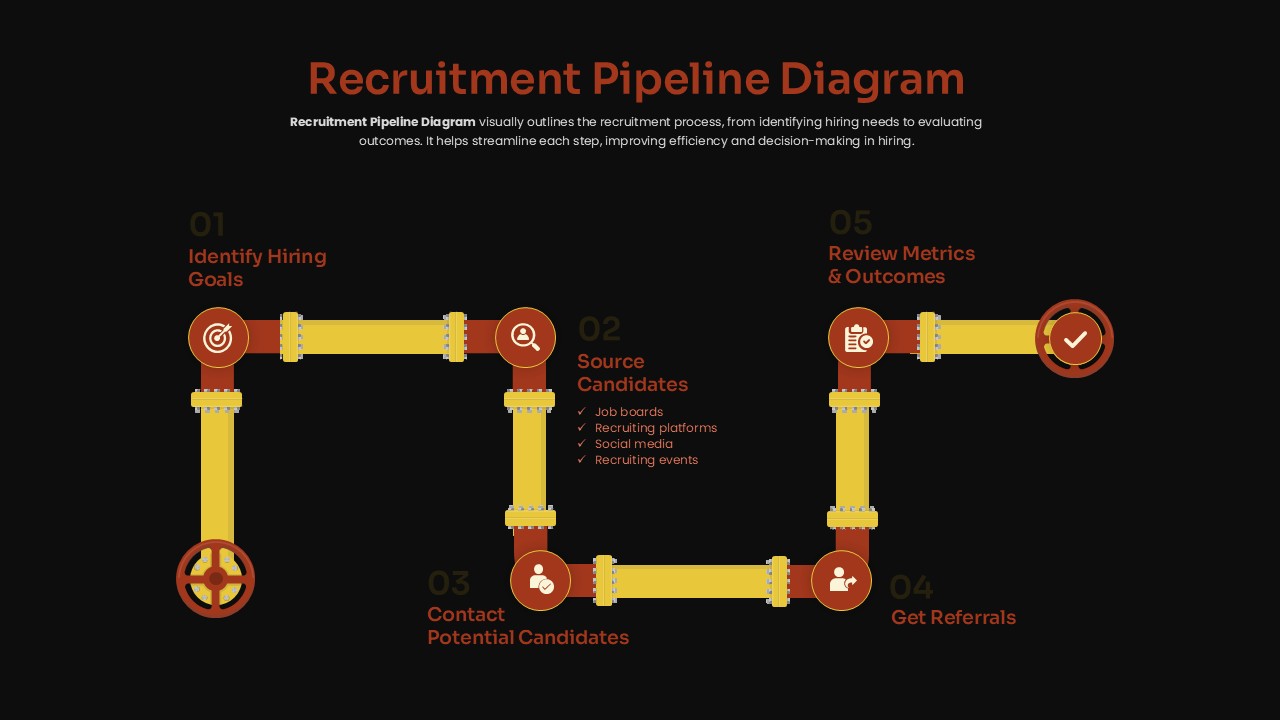
Recruitment Pipeline Flowchart Diagram Template for PowerPoint & Google Slides
Process
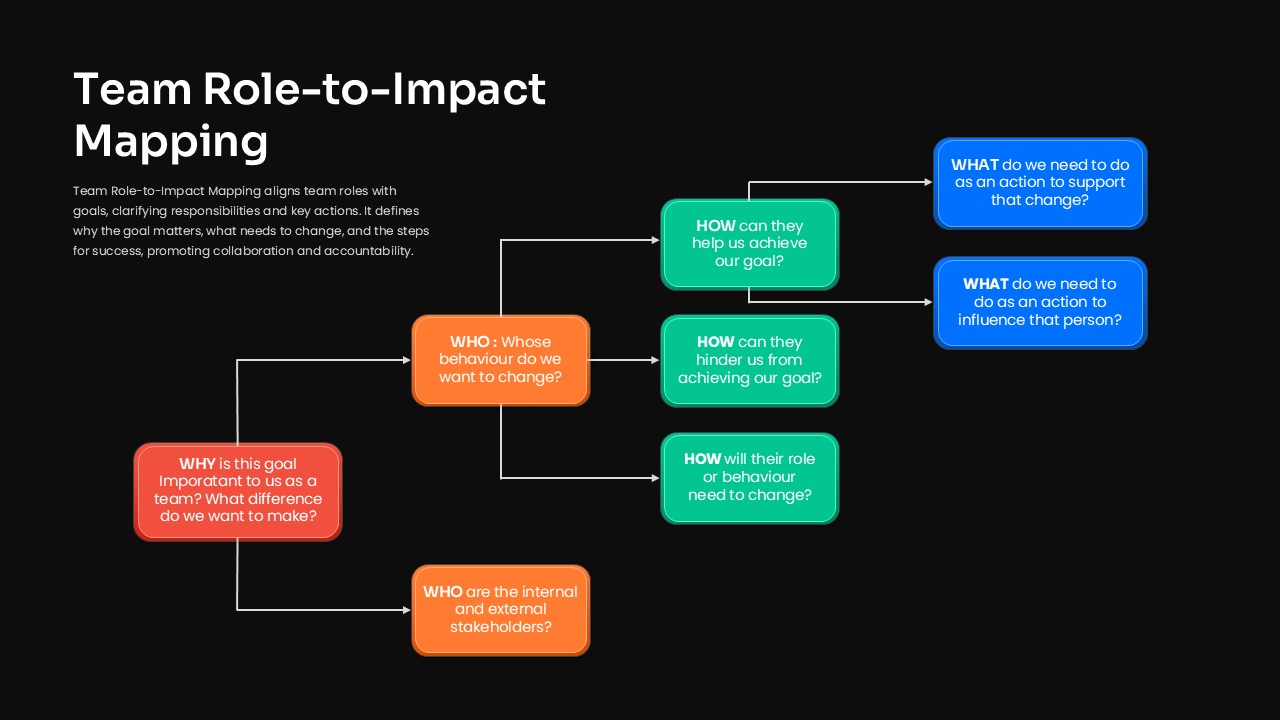
Team Role-to-Impact Mapping Flowchart Template for PowerPoint & Google Slides
Process
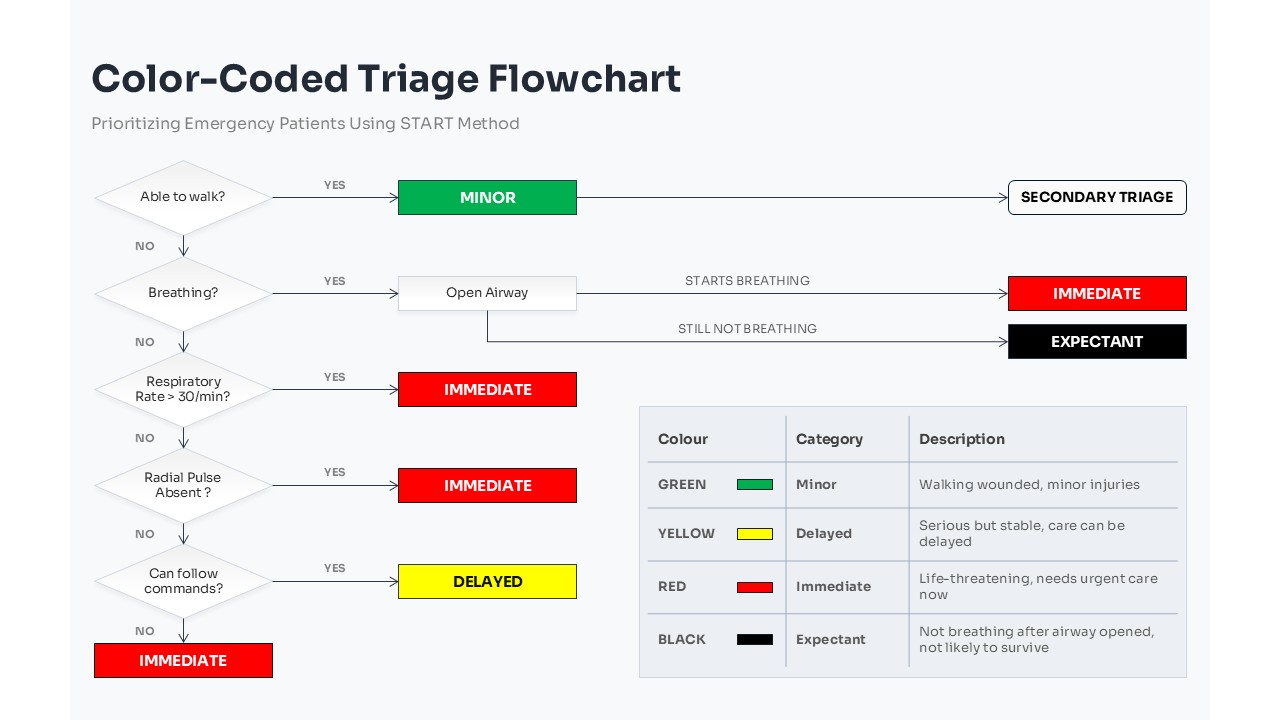
Color-Coded Medical Triage Flowchart Template for PowerPoint & Google Slides
Flow Charts
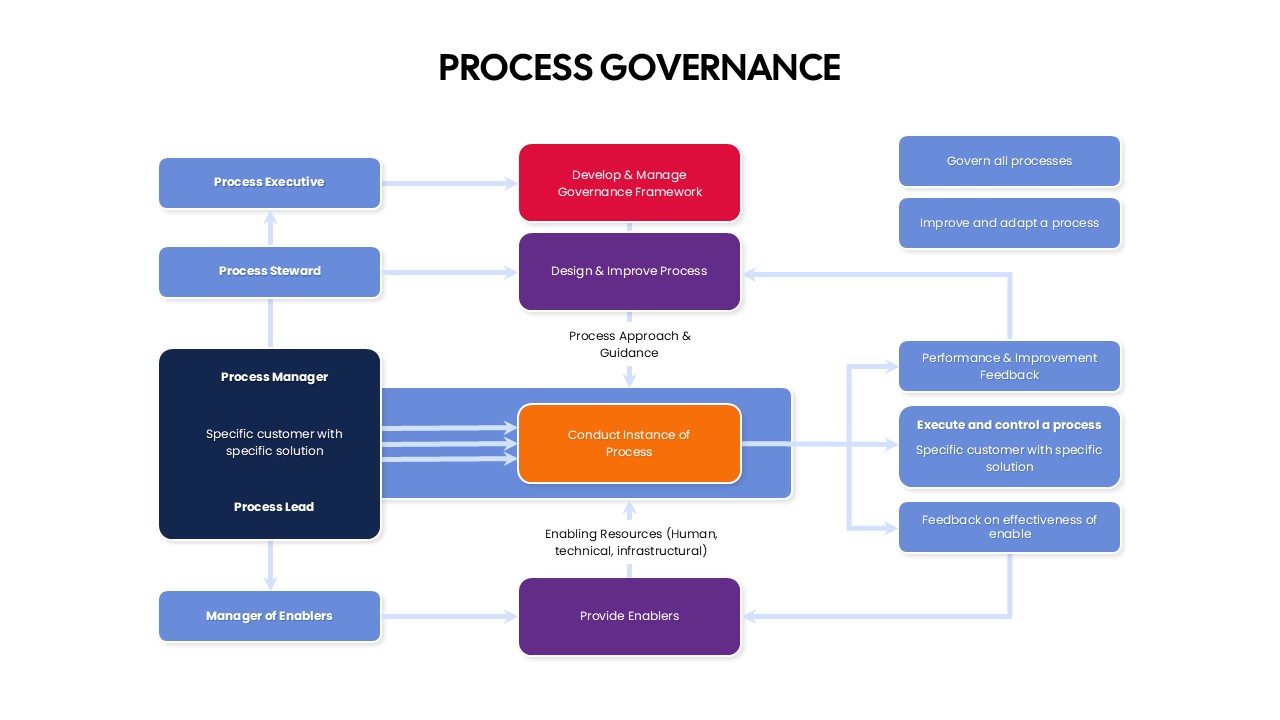
Process Governance Framework Flowchart Template for PowerPoint & Google Slides
Flow Charts
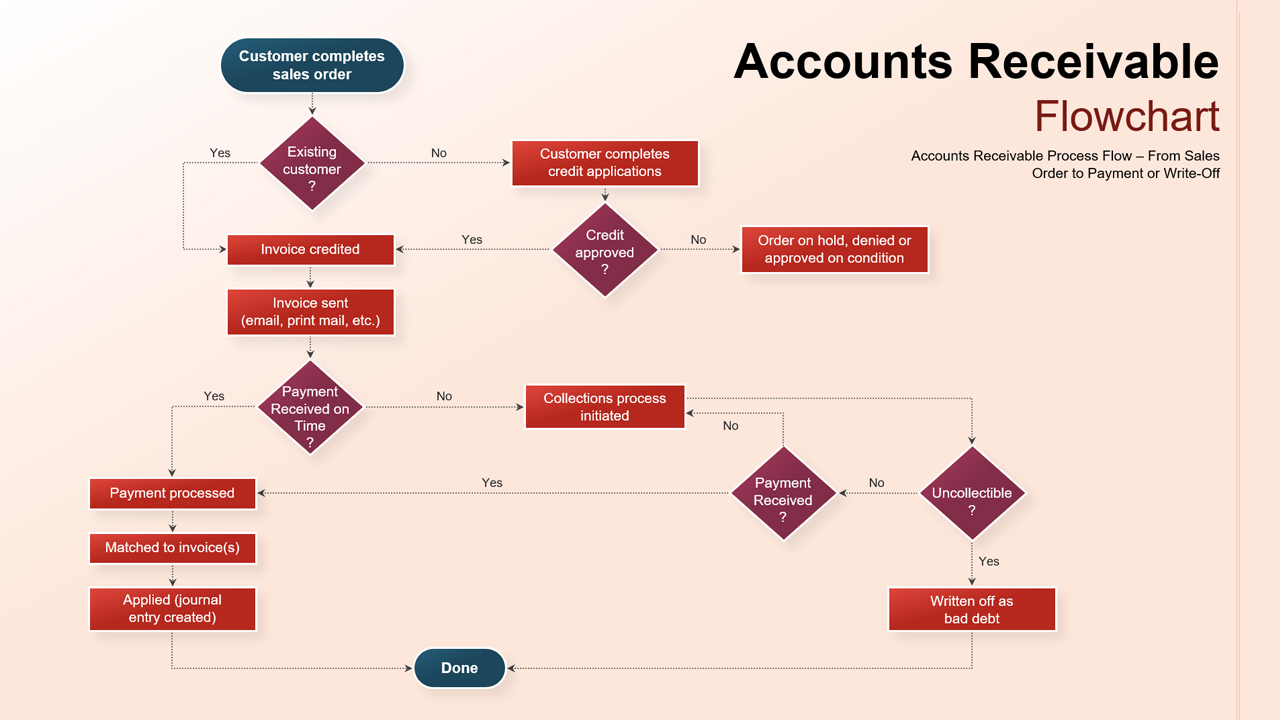
Accounts Receivable Process Flowchart Template for PowerPoint & Google Slides
Flow Charts
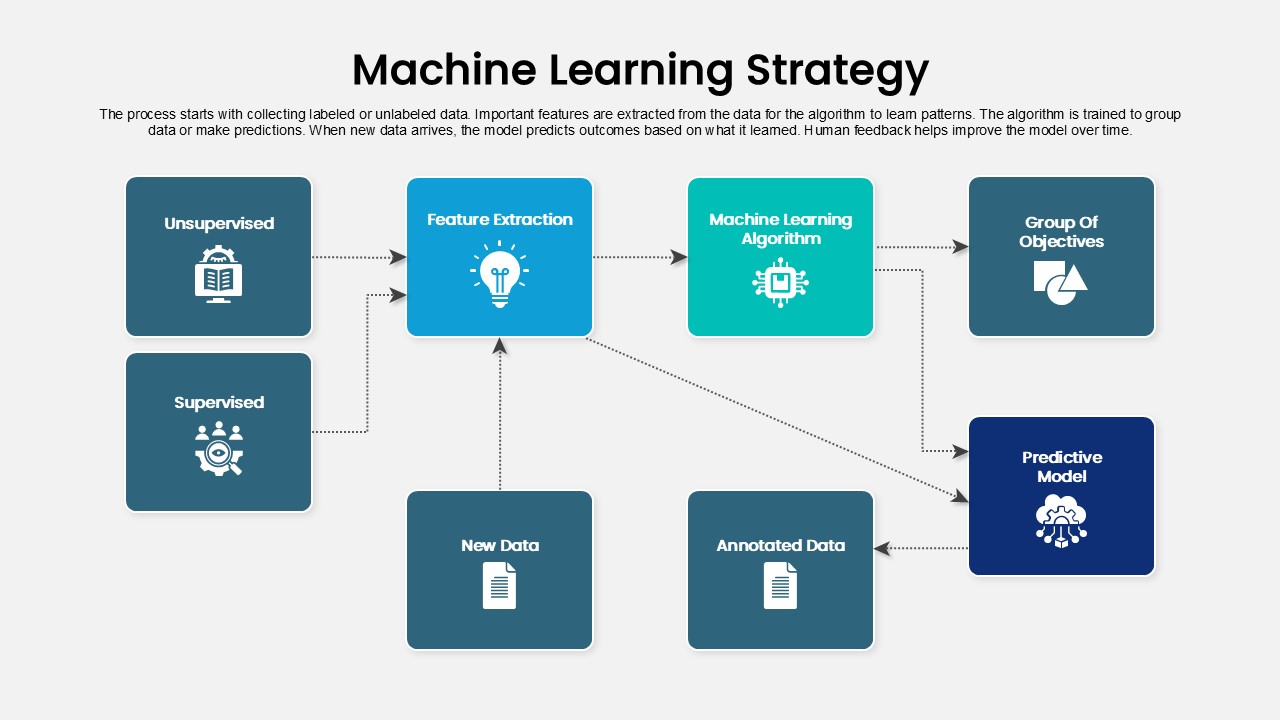
Machine Learning Strategy Flowchart
Machine Learning
4 Step Process PowerPoint & Google Slides Template for PowerPoint & Google Slides
Process