Diabetes Blood Glucose Monitoring Template for PowerPoint & Google Slides

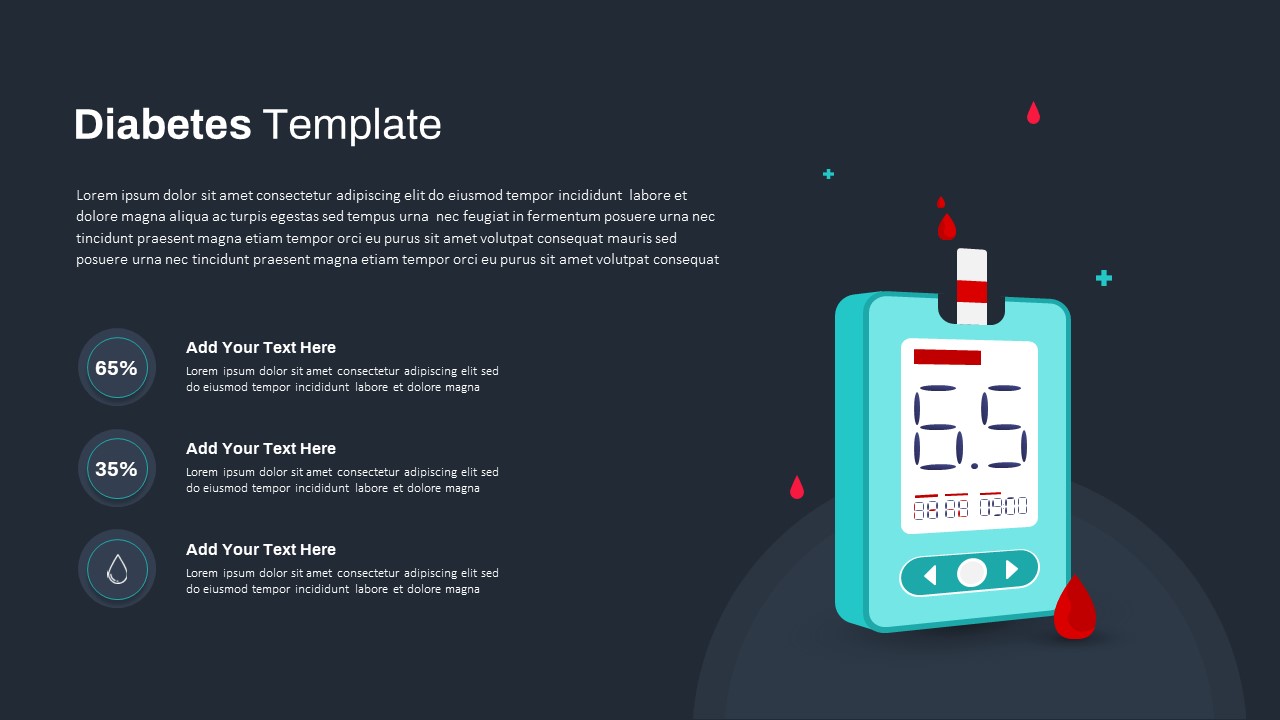


Leverage this diabetes slide template to present blood sugar tracking and patient data with professional clarity. The left panel features a bold “Diabetes” heading with placeholder text for introduction or key insights, followed by three circular metrics—65%, 35%, and an icon-based data point—each paired with customizable text blocks for statistics or observations. The right side showcases a clean vector illustration of a glucose meter reading “6.5,” accented by vibrant red blood-drop icons and subtle teal plus signs, creating an immediately recognizable health-care visual.
Built on a master-slide framework, all vector components—including the glucose meter, icons, circles, and background elements—are fully editable in PowerPoint and Google Slides. Easily adjust ring thicknesses, recolor gradients, swap icons, or change numeric values to match your data set or branding guidelines. The minimalist layout uses generous white space, crisp typography, and a balanced two-column composition that guides audiences through complex information without overwhelming them.
This template streamlines the creation of medical presentations by combining illustrative graphics with data-driven callouts. It retains perfect resolution on projectors and high-definition screens, and it supports collaborative editing to eliminate version-control issues. Use subtle entrance animations on the metric circles or blood drops to emphasize critical numbers during live sessions.
Who is it for
Healthcare professionals, diabetes educators, and clinical researchers can use this slide to showcase patient glucose trends, study findings, or treatment milestones. Pharma marketers and medical device trainers will also benefit from its clear data visualization and editable artwork.
Other Uses
Repurpose this slide for patient intake summaries, clinical trial updates, KPI dashboards, or workshop exercises on metabolic health. Swap icons and labels to adapt it for insulin dosage charts, nutrition breakdowns, or other chronic disease metrics.
Login to download this file

Item ID
SB03578
Related Templates

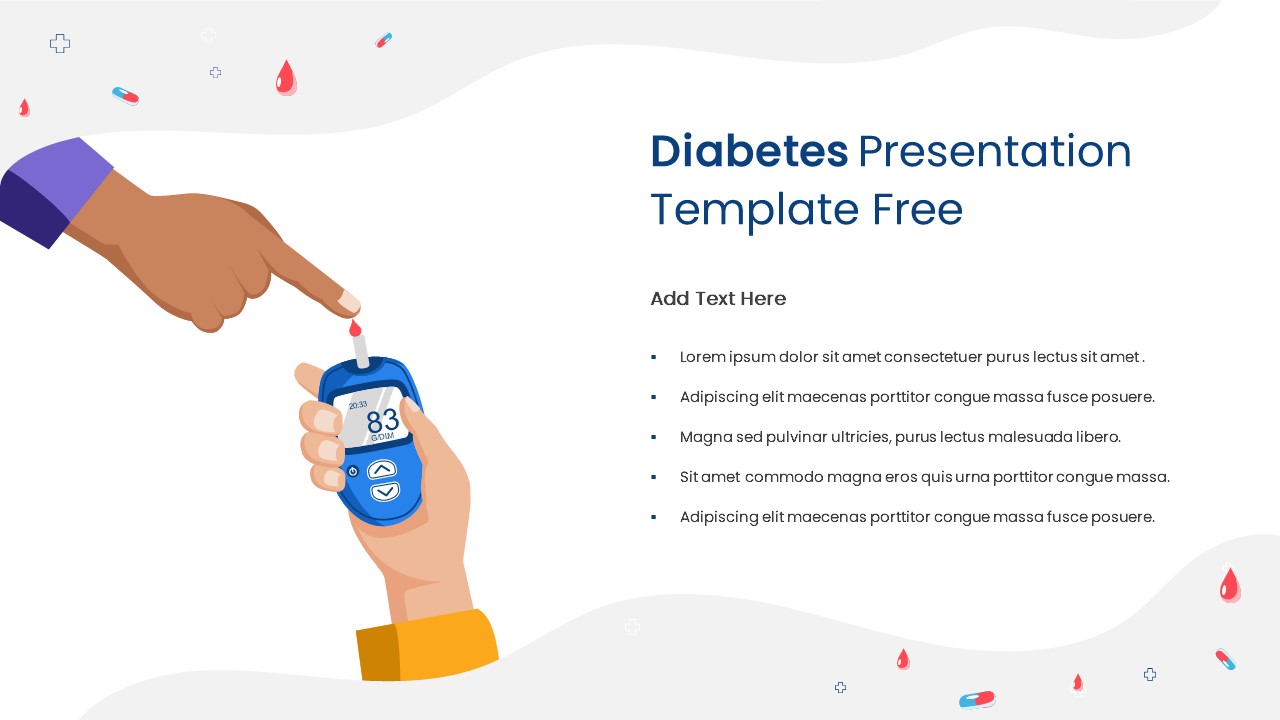
Free Diabetes Monitoring Awareness Slide for PowerPoint & Google Slides
Health
Free
Website Performance Monitoring Dashboard Template for PowerPoint & Google Slides
Business Report
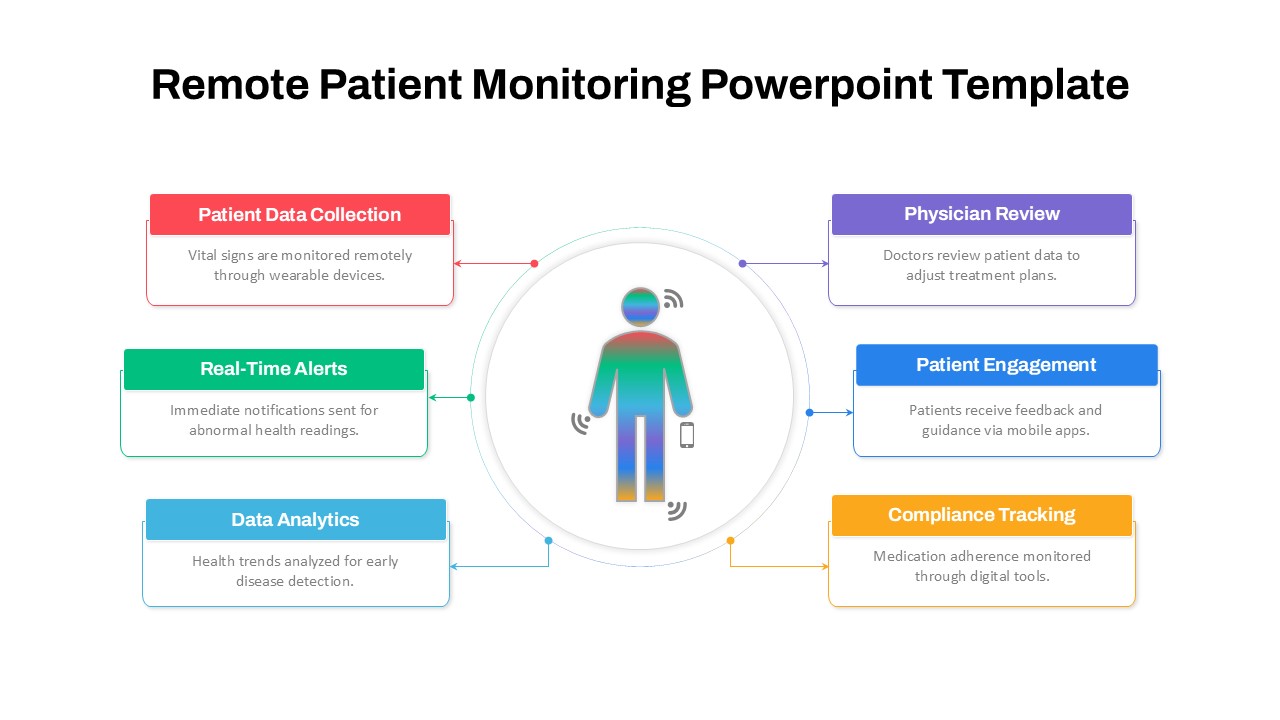
Remote Patient Monitoring Diagram Template for PowerPoint & Google Slides
Health
IT Operations & Monitoring Template for PowerPoint & Google Slides
Information Technology

Blood Donation Theme Presentation Template for PowerPoint & Google Slides
Pitch Deck
Blood Cancer Awareness Slide Design Template for PowerPoint & Google Slides
Health
Diabetes PowerPoint Template for PowerPoint & Google Slides
Medical