Data-Flow-Symbol-PPT-Presentation Template


Description
Leverage this six-slide Data Flow Diagram (DFD) pack to visualize system processes and data movements with professional clarity. The pack includes:
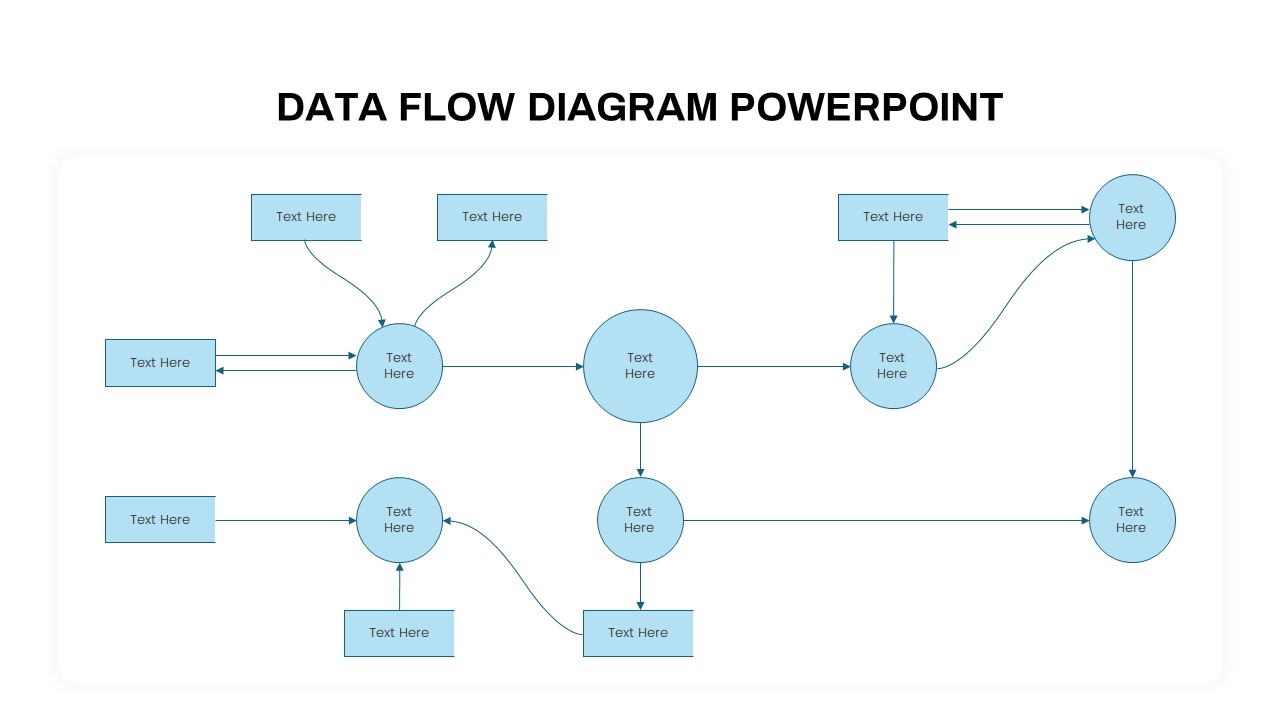
A comprehensive overview slide for mapping end-to-end data flow between external entities and core processes.
A detailed Yourdon & Coad symbol reference slide showcasing External Entity, Process, Data Store, and Data Flow icons.
A Gane & Sarson symbol reference slide with rounded-corner processes and dual-pane data stores.
Two editable DFD layouts—one high-level context diagram and one detailed level-1 breakdown—complete with numbered data stores, process bubbles, and connector arrows.
A summary slide for annotations or legend definitions.
Built on master slides, each layout supports drag-and-drop shape editing, color-palette swaps, and snap-to-grid alignment. Vector shapes and arrows automatically realign when you add or remove elements, ensuring clean, consistent maps. Slide notes guide you through replacing placeholders, customizing symbols, and fine-tuning connector styles. Fully compatible with both PowerPoint and Google Slides, this pack preserves vector scalability, animations, and formatting across platforms, enabling seamless collaboration and version control.
Who is it for
Systems analysts, software architects, and business analysts will benefit from this pack when documenting application architectures or specifying technical requirements. IT managers, project leads, and process engineers can also leverage these diagrams to communicate data dependencies and workflow optimizations.
Other Uses
Beyond system design, repurpose these slides for process improvement workshops, compliance audits, data lineage visualizations, training materials, or stakeholder reviews. The modular layouts adapt easily to any technical or operational mapping needs.
Login to download this file


