crisp-dm-process-template-powerpoint-google-slides

Description:
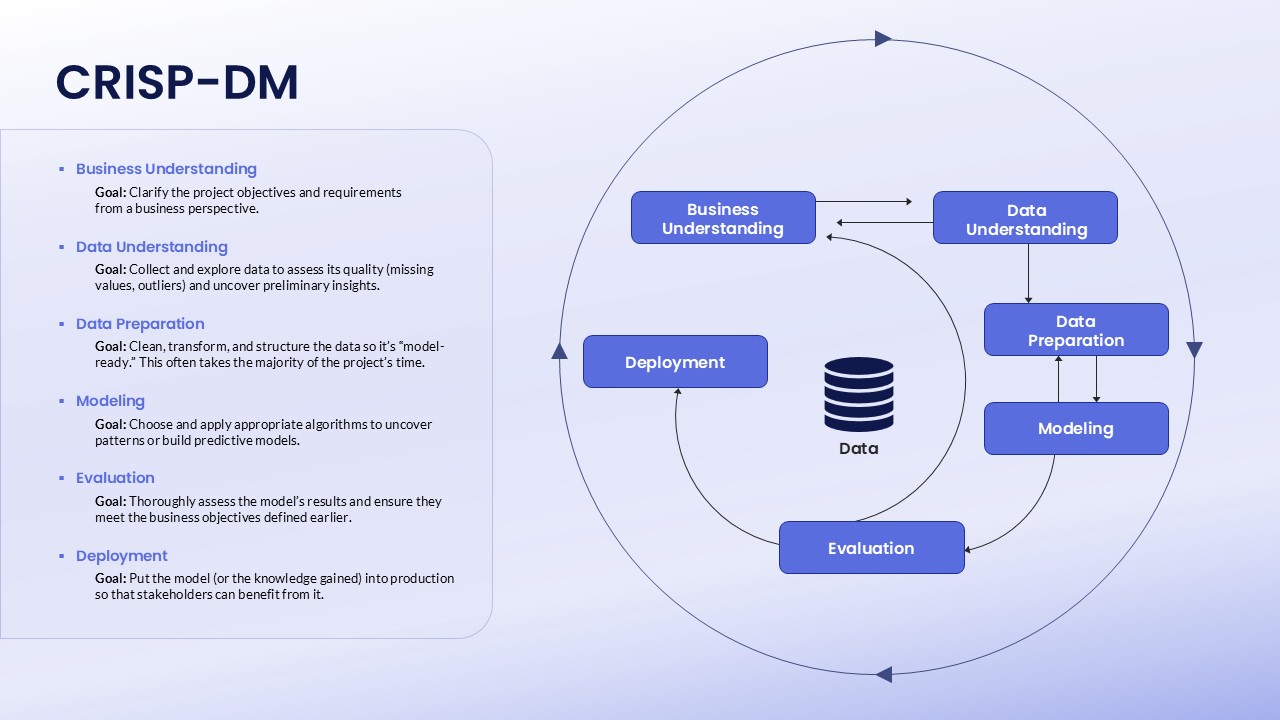
This comprehensive slide visualizes the CRISP-DM (Cross-Industry Standard Process for Data Mining) process, a widely used methodology for data mining and analytics. The diagram presents the cyclical nature of the process, broken down into six key stages: Business Understanding, Data Understanding, Data Preparation, Modeling, Evaluation, and Deployment. The flow shows how each stage connects with the others, emphasizing that data, insights, and feedback drive continuous improvement throughout the project.
The slide features an easy-to-understand flow that begins with defining business goals and continues through data collection, preparation, modeling, and evaluation before final deployment. It clearly lays out the main objectives for each phase, from clarifying project objectives and gathering data to preparing it, building predictive models, and assessing model performance before deployment.
This slide is perfect for presentations on data mining, business intelligence, data science projects, and analytics strategy. It's an ideal tool for data scientists, analysts, business leaders, and educators teaching data analysis processes and methodologies.
Who is it for
This slide is ideal for data scientists, data analysts, business analysts, and business leaders involved in data-driven decision-making. It’s also perfect for educators and students learning about data mining and the CRISP-DM methodology in academic or professional settings.
Other Uses
In addition to explaining the CRISP-DM process, this slide can be adapted for presentations on any structured data analysis framework or project lifecycle. It can also be used for discussing the flow of business intelligence, predictive analytics, or machine learning projects from start to finish.
Login to download this file


