Continual Improvement Process PowerPoint template


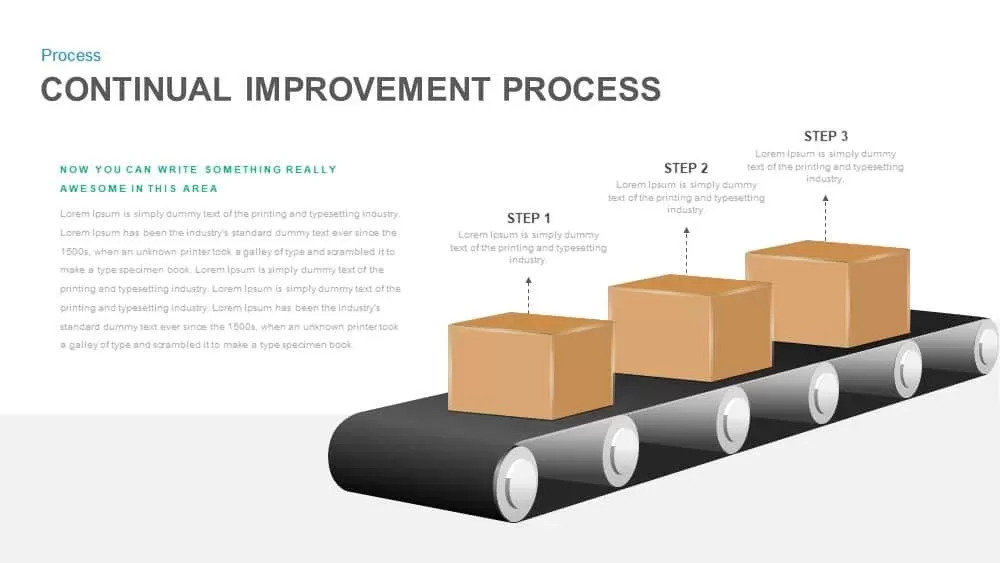
This continual improvement process slide uses a sleek conveyor belt infographic to illustrate three sequential phases—Step 1, Step 2, and Step 3—represented by vector-based boxes that increase in size as they move along the belt. Each box is linked to a numbered label and text placeholder with dotted connectors, allowing you to describe objectives, actions, or KPIs for each phase. The left side includes a customizable headline area for an overview or key message. Built on PowerPoint and Google Slides master slides, all elements—including box fills, belt colors, typography, and connector styles—are fully editable. Simply swap icons, adjust step labels, recolor shapes to match your brand palette, or resize boxes and connectors with drag-and-drop ease. Vector graphics ensure pixel-perfect clarity on widescreen displays and printed reports.
This slide supports dynamic storytelling: extend the conveyor by duplicating belt segments, add or remove boxes to scale the process, and reposition text placeholders to fit longer descriptions. Global slide master controls let you update fonts, apply corporate color schemes, and embed logos across your entire deck for cohesive branding. Smart guides and snap-to-grid alignment streamline layout adjustments, while minimal white backgrounds keep the focus on your content. Whether you’re outlining iterative development cycles, quality improvement programs, or production workflows, this infographic enhances audience comprehension through clear visual hierarchy and professional design.
Who is it for
Project managers, continuous improvement teams, and operations leaders will leverage this slide to map out process optimizations, quality assurance milestones, and iterative release plans. Quality managers, consultants, and training facilitators can use the conveyor graphic to guide stakeholders through each improvement stage during workshops and executive briefings.
Other Uses
Beyond process mapping, repurpose this slide as a production workflow overview, training module sequence, or product rollout timeline. Customize box icons to represent deliverables, performance targets, or audit checkpoints, and integrate the conveyor infographic into broader project status reports or strategic roadmaps.
Login to download this file


