sales-process-pipeline-template


Description
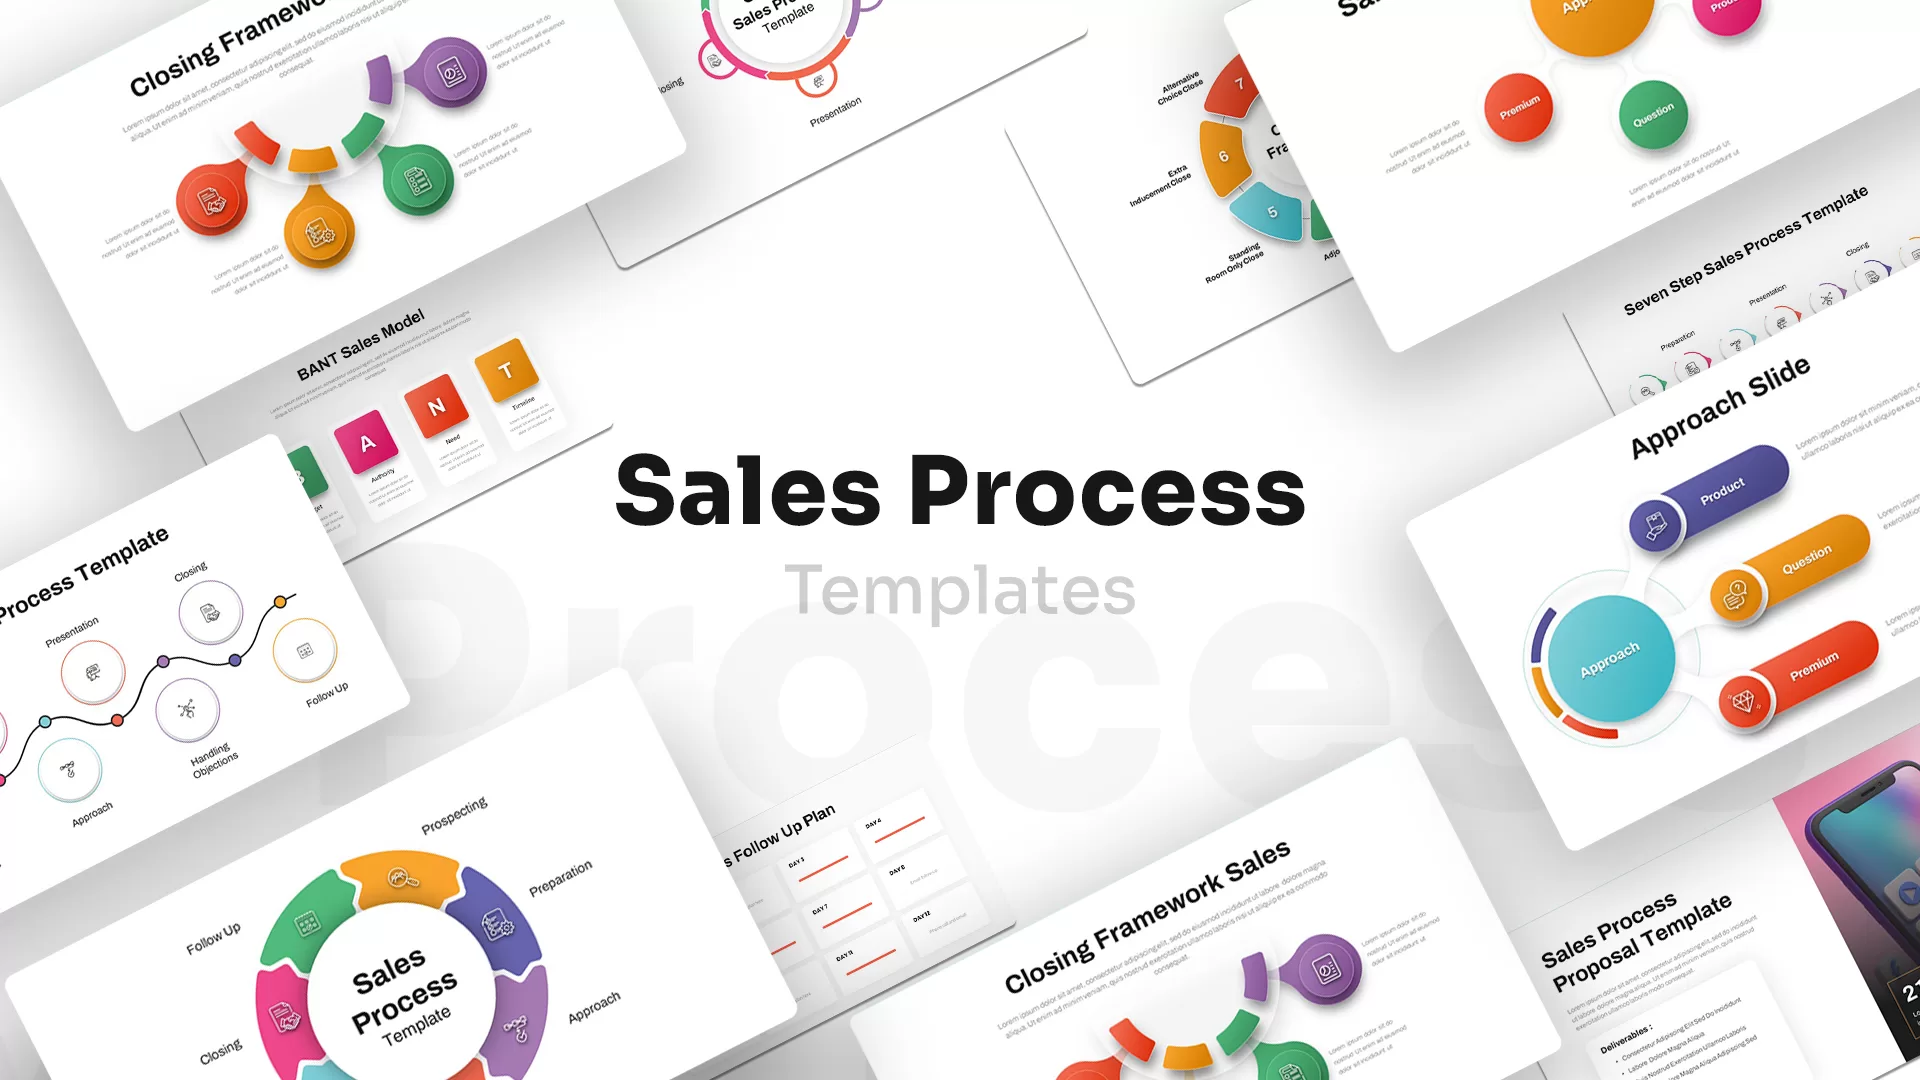
Leverage this diverse pack of 30 sales process infographic slides to visualize each stage of your sales cycle with clarity and impact. From prospecting and preparation to presentation, handling objections, closing, and follow-up, this comprehensive collection includes timeline flows, circular frameworks, BANT model layouts, hub-and-spoke diagrams, step-by-step roadmaps, and customizable funnel visuals. Each slide is designed with editable icons, vector shapes, and drag-and-drop charts, allowing you to tailor content to any industry or target audience. High-resolution image placeholders and modern typography ensure your key messages stand out across devices.
Built on master slides for both PowerPoint and Google Slides, this template pack simplifies customization with theme-color controls, intuitive placeholders, and font pairings that align with your brand identity. Whether you need a minimalist flow chart or a vibrant multicolor framework, every element is fully editable. Seamlessly adjust colors, replace icons, and tweak layouts in seconds, enabling rapid deck assembly for presentations, workshops, or sales enablement sessions. With built-in slide transitions and optimized aspect ratios, you can focus on storytelling while maintaining professional consistency.
Use these professionally crafted infographics to illustrate pipeline metrics, lead qualification frameworks, value propositions, and closing tactics. Whether you’re conducting sales training, pitching to stakeholders, or analyzing performance metrics, this versatile slide set provides clear visual aids to support persuasive narratives. Easily duplicate slides to track weekly progress, customize step counts, and integrate brand imagery, making this resource ideal for sales managers, account executives, and marketing teams aiming to drive revenue growth and to significantly maximize conversions.
Who is it for
Sales managers, account executives, business development professionals, and marketing teams seeking to present structured sales frameworks, pipeline analyses, and performance metrics.
Other Uses
Repurpose these infographics for sales training workshops, client pitches, quarterly business reviews, CRM implementation plans, or marketing enablement sessions. Adapt layouts to illustrate project workflows, product roadmaps, or customer journey maps.
Login to download this file


