Infographic Circular Diagram PowerPoint Template

Description
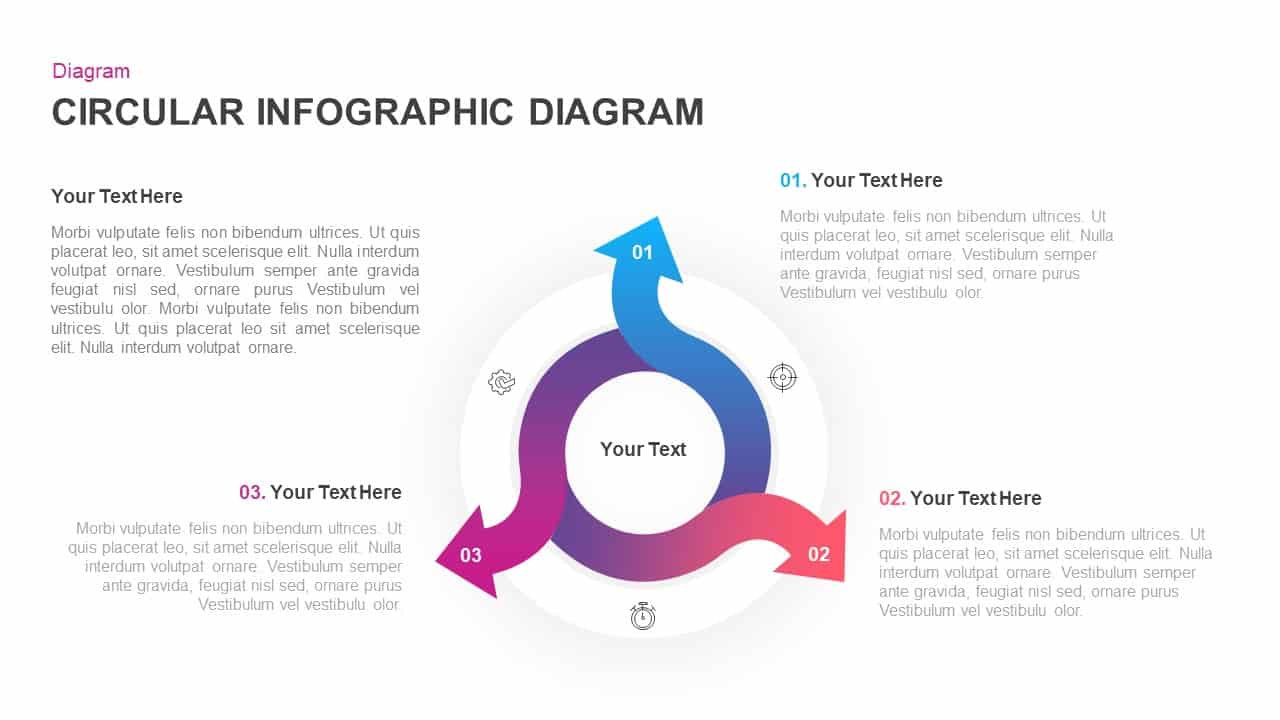
This slide features a dynamic three-step circular infographic diagram to showcase cyclical processes and relationships. Each arrow segment uses a smooth gradient—blue for step 01, red for step 02, and magenta for step 03—and is labeled with concise headlines and icons. The central white core highlights the intersection, while subtle drop shadows, clean typography, and ample white space deliver a modern, professional look. Fully editable vector shapes, intuitive text placeholders, and master-slide integration let you swap icons, adjust colors, or update labels in seconds without disrupting alignment. Perfect for illustrating continuous improvement loops, feedback cycles, or three-phase strategies, this diagram ensures your audience grasps complex workflows at a glance.
Who is it for
Process improvement specialists, project managers, operations teams, quality engineers, and business analysts will benefit from this circular diagram. It’s also ideal for marketers, educators, and consultants seeking to visualize iterative models or feedback loops.
Other Uses
Repurpose this template for three-stage roadmaps, marketing funnels, risk–benefit analyses, audience segmentation, or product development cycles. Simply relabel each segment to match use cases like plan-do-check workflows, customer journey phases, or performance review steps.
Login to download this file


