Circle Graph Powerpoint Keynote

Description
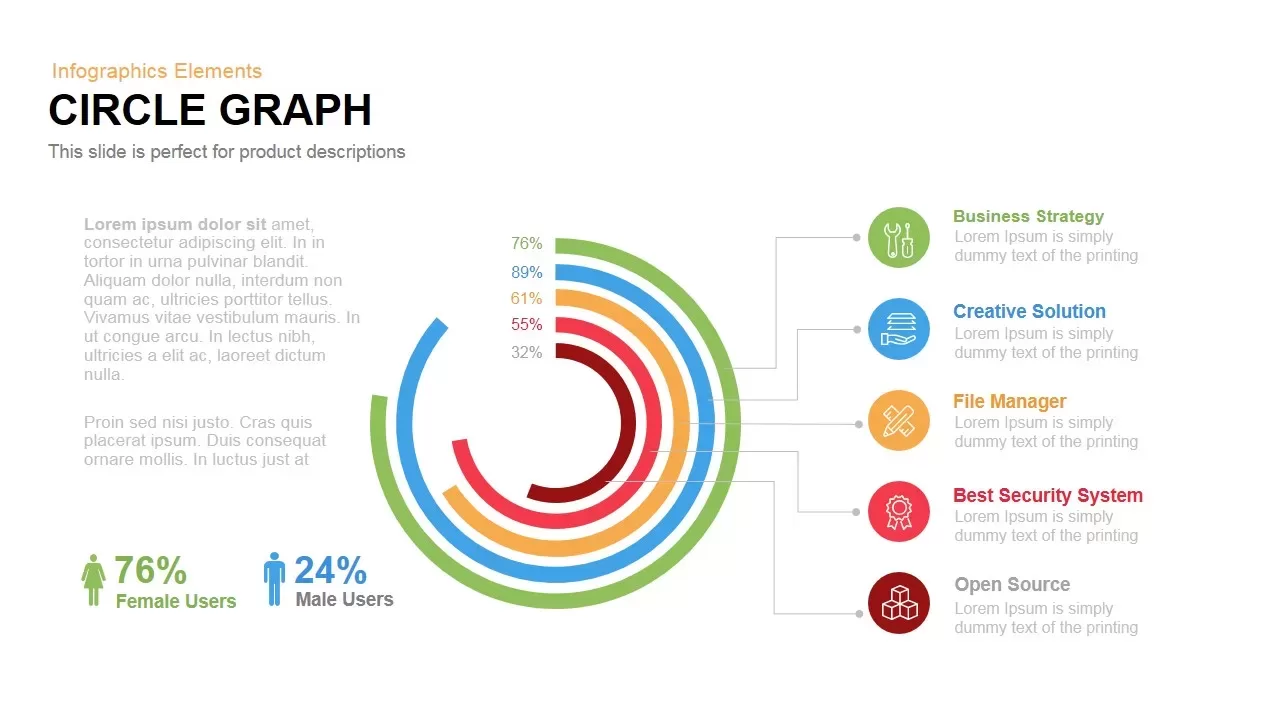
Leverage this circle graph slide to visualize segmented data with precision and clarity. At its center, five concentric semi-circular rings use distinct accent colors—green (76%), blue (89%), yellow (61%), red (55%), and dark red (32%)—to represent key metrics. Matching numbered dots (1–5) align along the top half of each ring, while callouts on the right link each data segment to descriptive headings and icons (Business Strategy, Creative Solution, File Manager, Best Security System, Open Source). On the left, space for contextual text and a concise quantitative legend highlights gender distribution—76% Female Users versus 24% Male Users—using intuitive iconography. Semi-transparent arrow icons on each margin hint at carousel navigation for interactive storytelling.
Built on master slide layouts with fully editable vector shapes, this template offers seamless customization: update ring percentages, adjust color schemes, replace icons, and edit text placeholders in seconds. The scalable vector graphics maintain crisp clarity across both PowerPoint and Google Slides, ensuring pixel-perfect rendering on every device. A clean white background and minimalist typography draw focus to core insights, while balanced white space and consistent alignment reinforce professional polish.
Ideal for presenting performance dashboards, customer demographics, or segmented market analyses, this circle graph infographic streamlines complex data storytelling into a single coherent slide. Duplicate the slide to compare quarterly results, segment processes, or benchmark KPIs across multiple categories without disrupting design harmony. The radial structure guides the audience’s eye clockwise through each data point, fostering intuitive comprehension and engagement. Use this versatile asset in executive briefings, marketing reports, product roadmaps, or training sessions to convey multivariate insights with maximum impact and minimal effort.
Who is it for
Data analysts, marketing managers, product strategists, and UX researchers will leverage this circle graph infographic to showcase customer metrics, performance benchmarks, or survey insights in stakeholder briefings, executive dashboards, or academic presentations.
Other Uses
Repurpose this slide for demographic breakdowns, market segmentation, KPI dashboards, or resource allocation analysis. Adjust ring percentages to illustrate budget spend, project progress, or process workflows. Swap callout headings and icons to visualize sales channels, quarterly results, or strategic planning outcomes in workshops, reports, or investor pitches.
Login to download this file


