Causal Loop Diagram PowerPoint Template
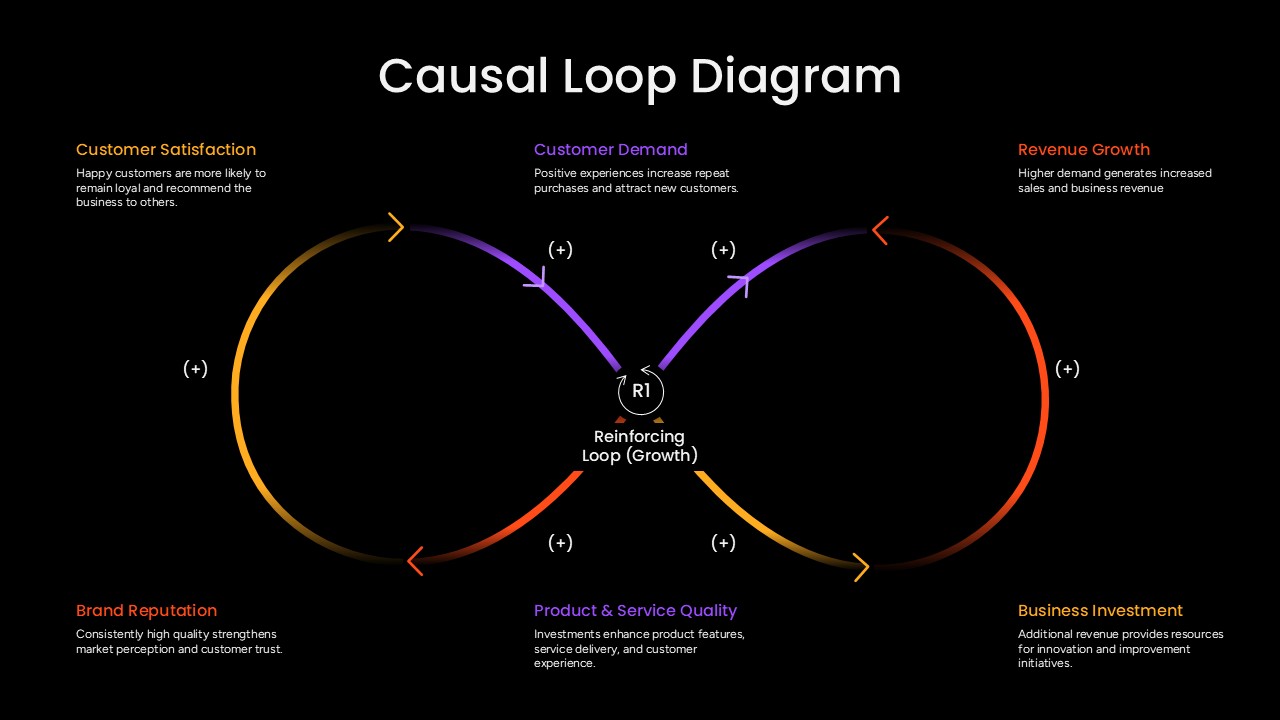
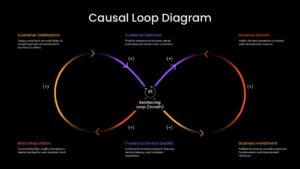
Complex systems rarely operate in a straight line. A change in one area often triggers reactions elsewhere, creating patterns that either reinforce growth or introduce constraints. This Causal Loop Diagram PowerPoint Template is designed to help visualize these interconnected relationships, making abstract concepts easier to analyze, discuss, and communicate.
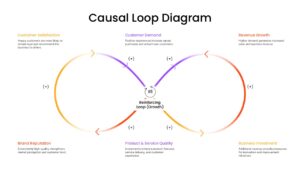
At the center of the slide is a feedback-loop structure that highlights how key variables influence one another over time. This makes the template especially valuable for presentations involving business performance, customer behavior, operational improvement, organizational change, market dynamics, and strategic decision-making. Instead of presenting isolated data points, the diagram encourages audiences to understand the broader system behind the outcomes.
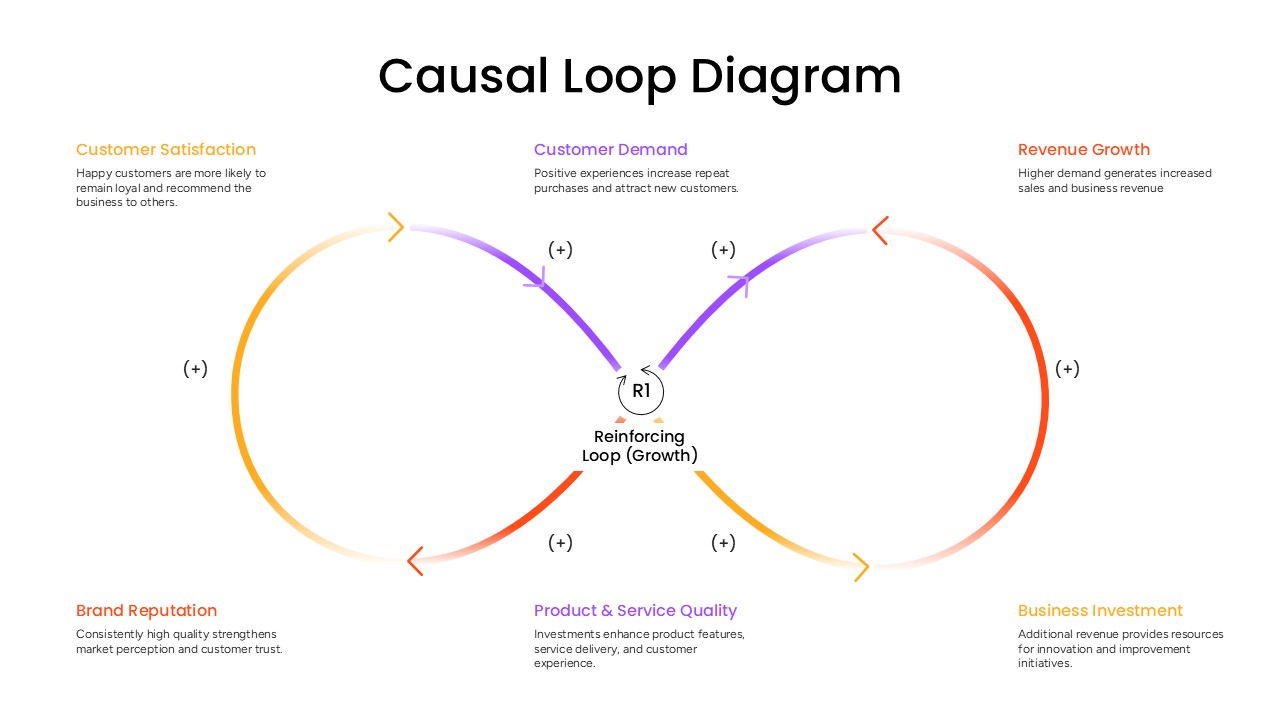
Feedback Loop Analysis PowerPoint Template
The design is fully editable in PowerPoint and Google Slides, allowing users to replace labels, modify connections, customize colors, and adapt the model to their specific use case. From executive strategy reviews and consulting workshops to academic research and systems-thinking exercises, the template provides a professional way to illustrate reinforcing and balancing relationships.
For professionals exploring business frameworks, system dynamics models, and presentation-ready google slides templates, this diagram offers a practical solution for explaining how multiple factors interact within a single ecosystem. The visual structure helps transform complicated relationships into a narrative that audiences can follow, making discussions more insightful and decisions more informed.
Frequently Asked Questions
How do I customize the business elements in the causal loop diagram?
Can I add more elements to the causal loop diagram?
Login to download this file

Item ID
SB05977Designed By
Naseeba Sithara
Related Templates

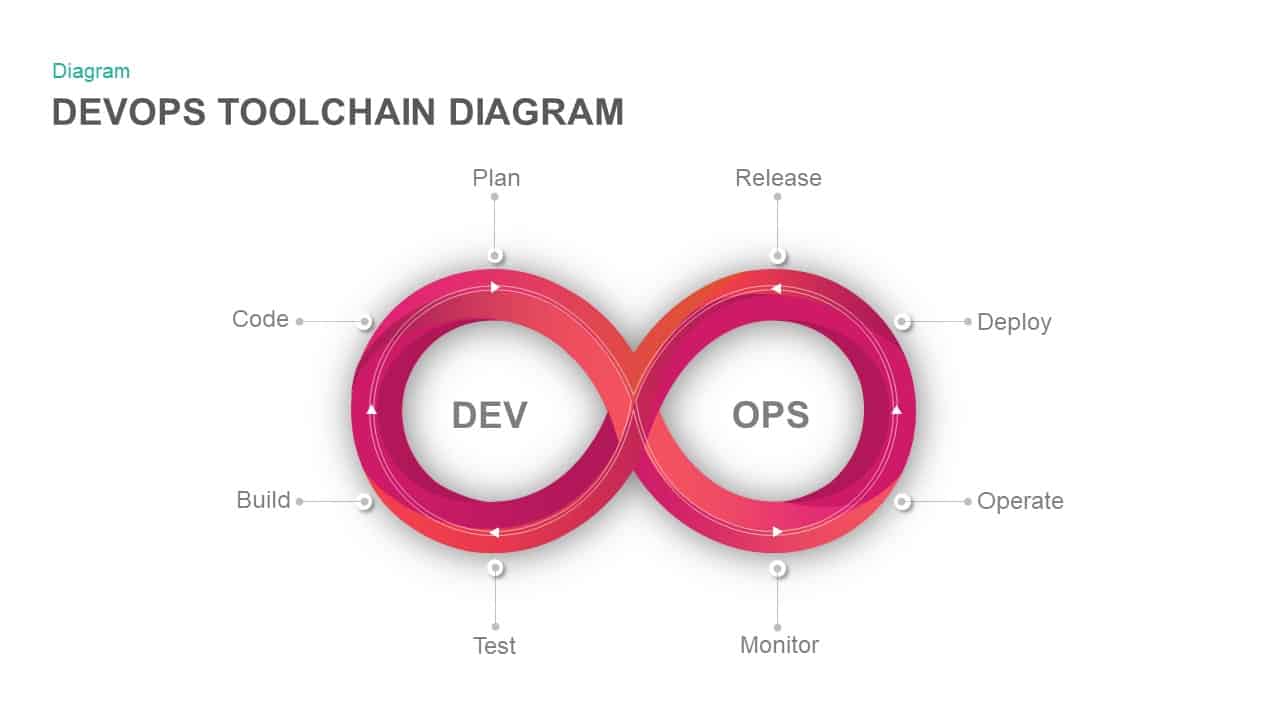
DevOps Infinity Loop Process Diagram Template for PowerPoint & Google Slides
Process
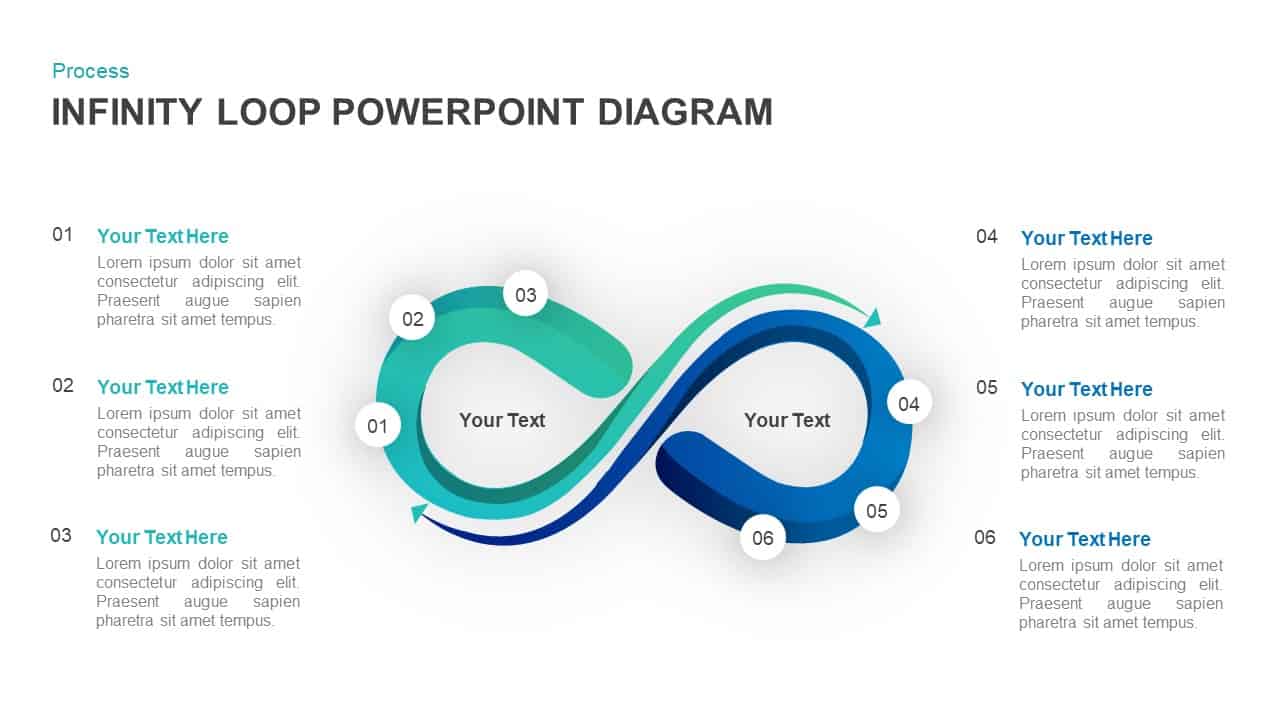
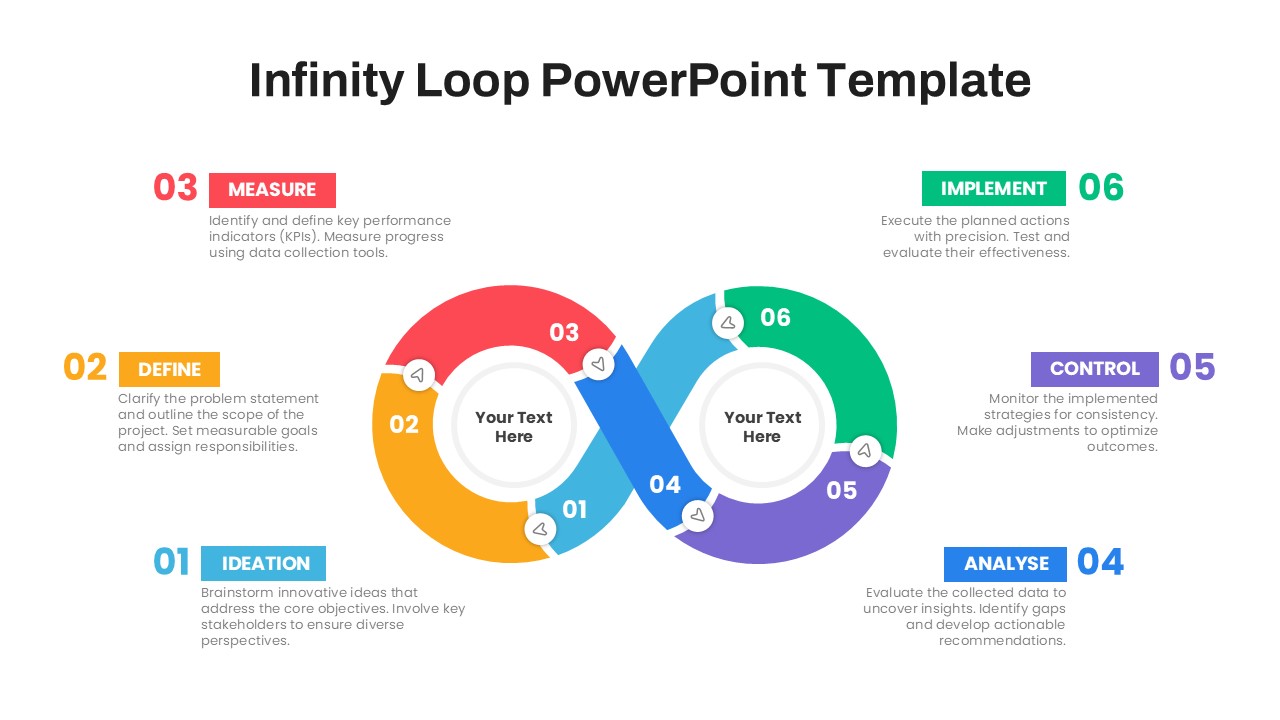
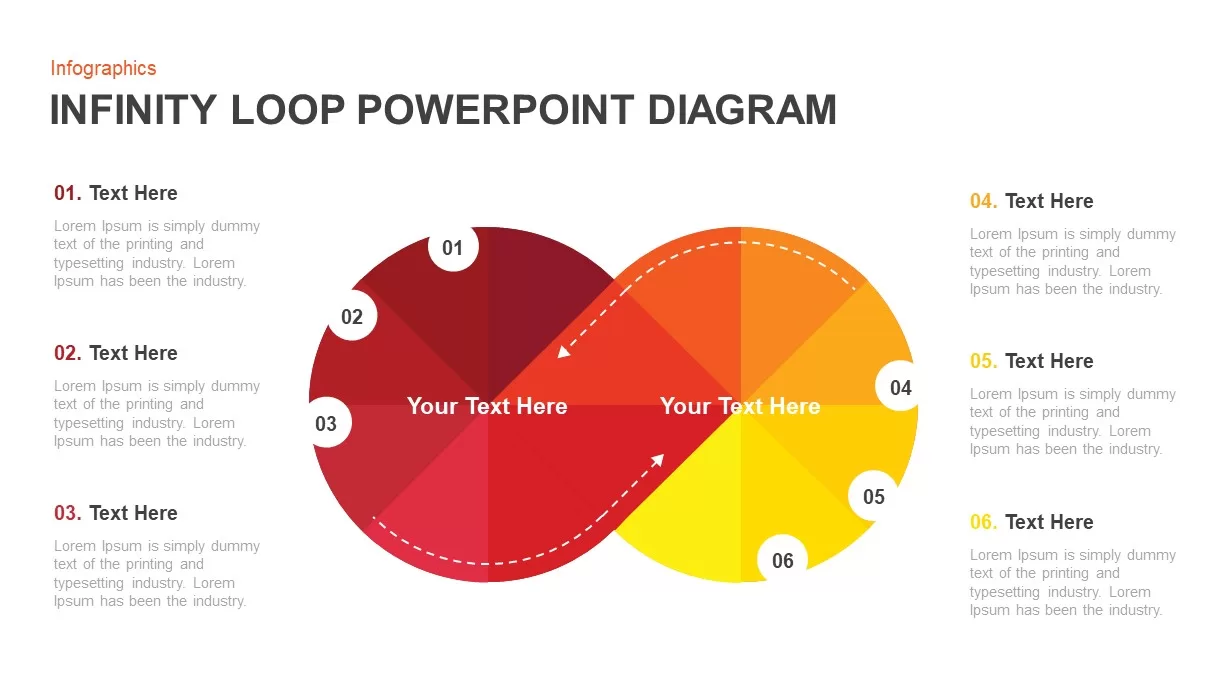
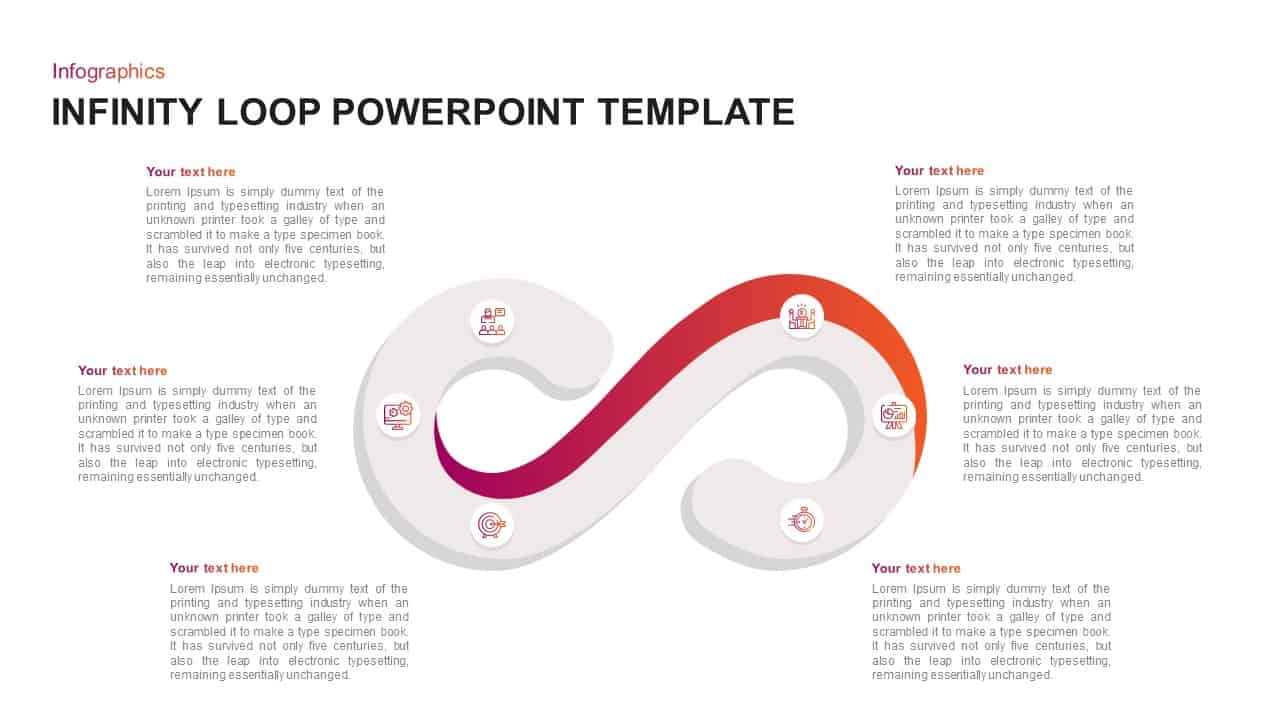
Infinity Loop PowerPoint Diagram Template
Process
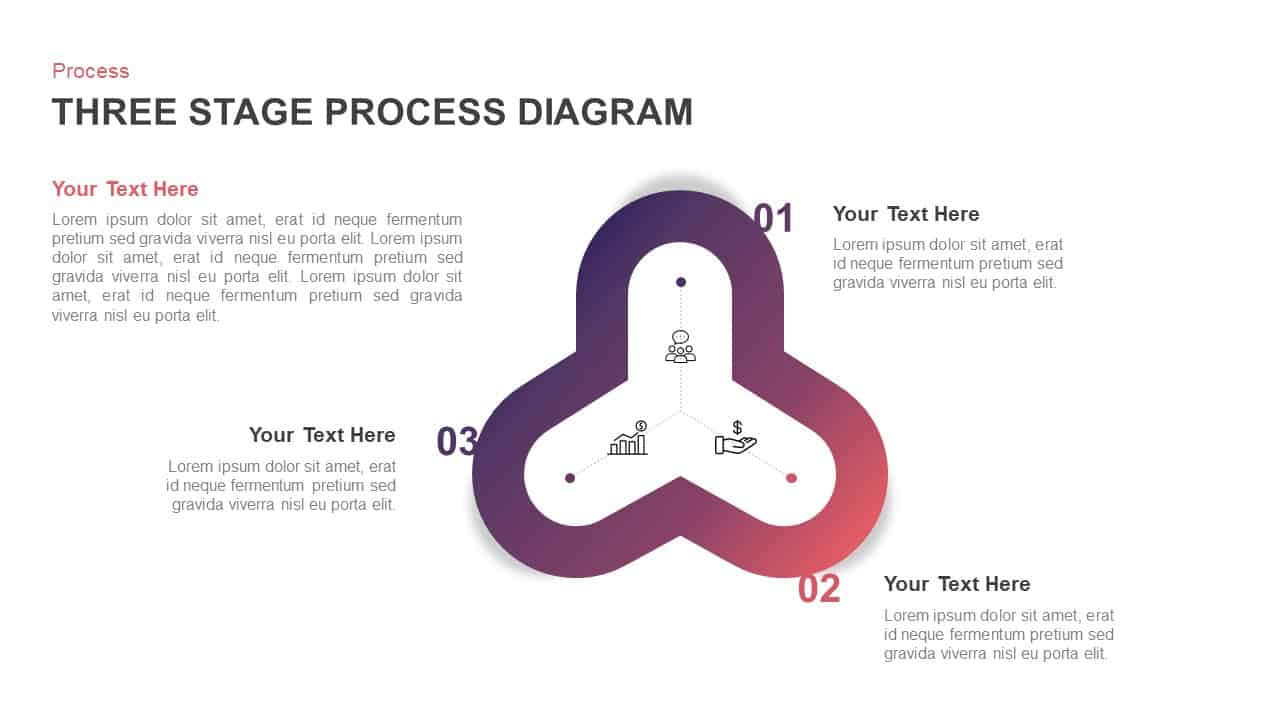
Three-Stage Loop Process Diagram Template for PowerPoint & Google Slides
Process
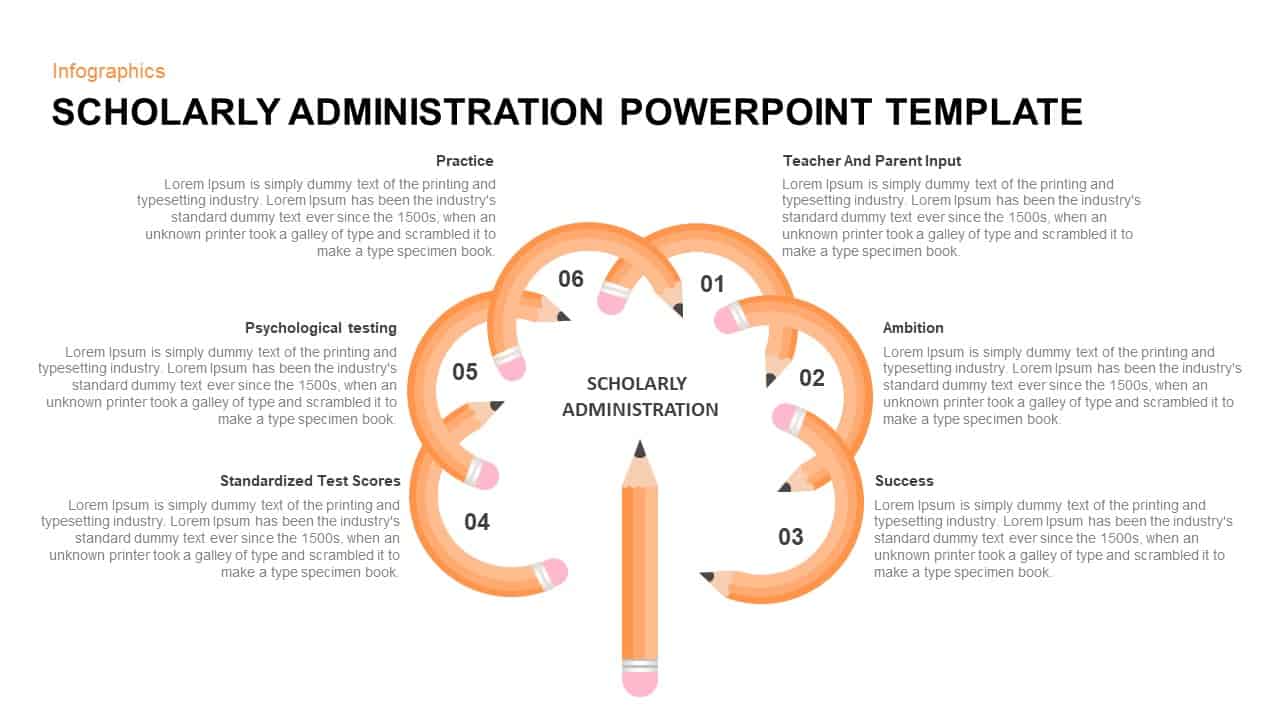
Scholarly Administration Loop Diagram Template for PowerPoint & Google Slides
Process
Six-Step Infinity Loop Process Diagram Template for PowerPoint & Google Slides
Process

Six-Stage Infinity Loop Diagram Template for PowerPoint & Google Slides
Process
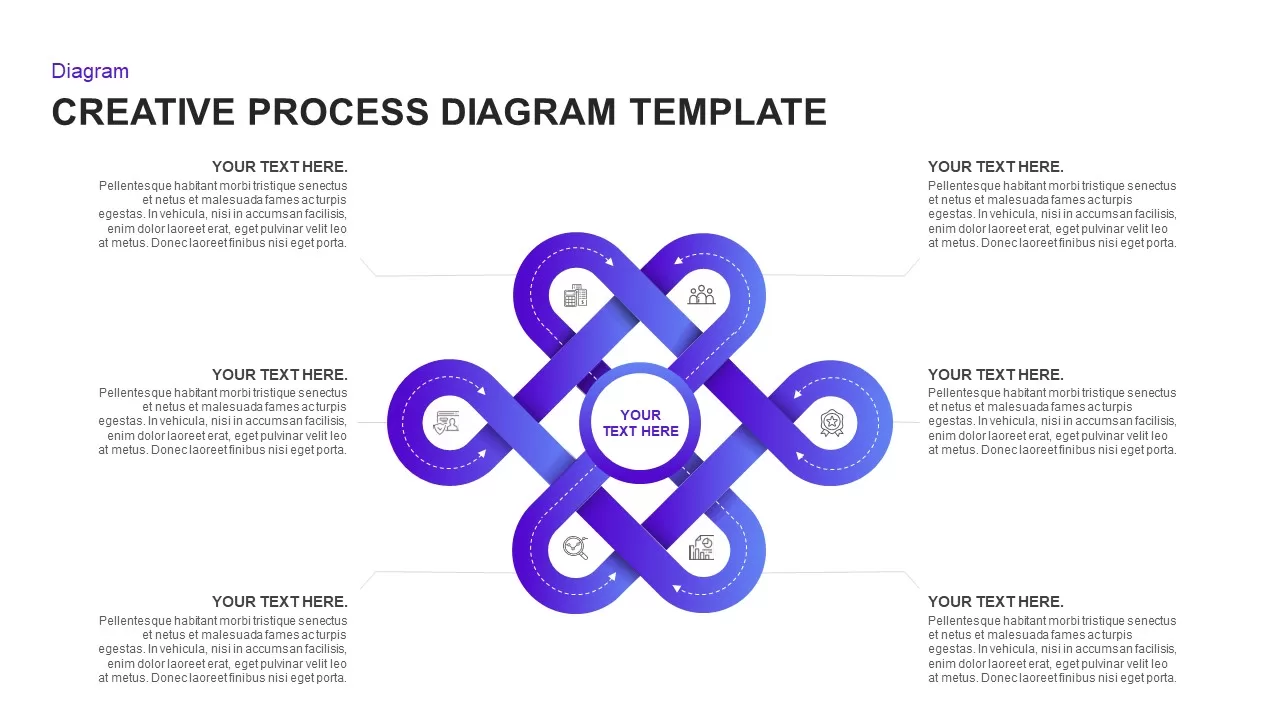
Creative Infinity Loop Process Diagram Template for PowerPoint & Google Slides
Process
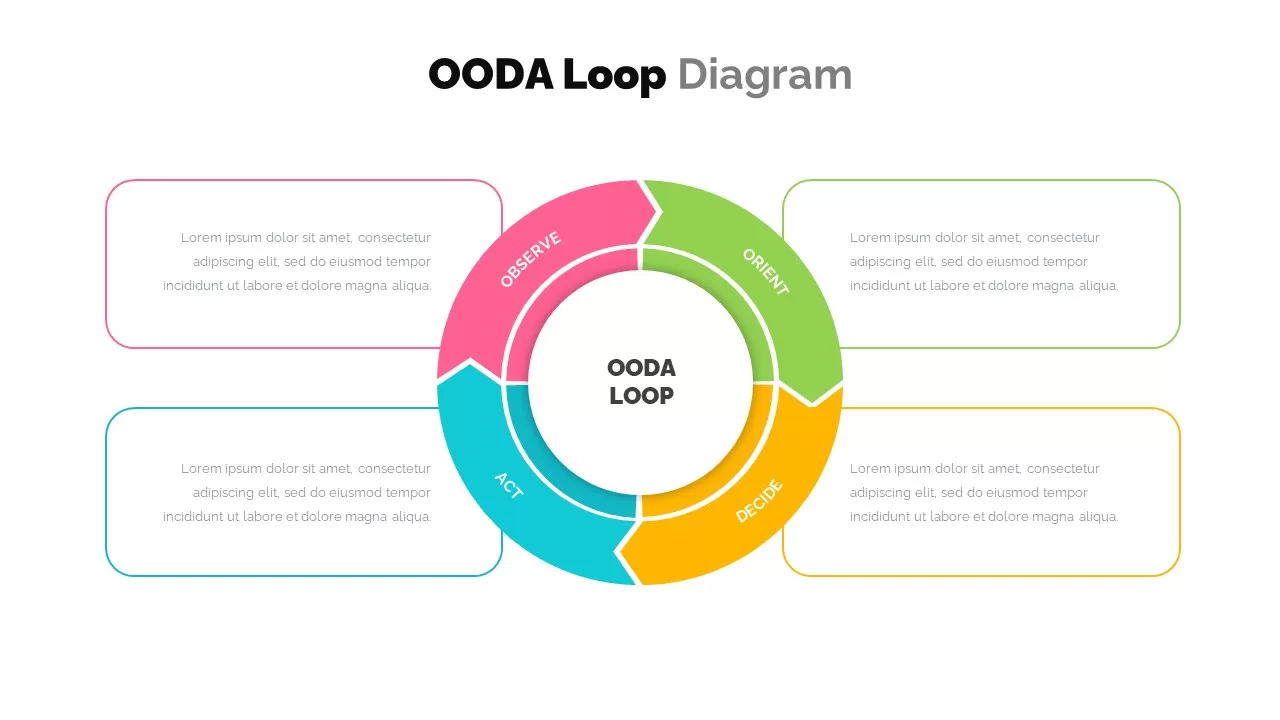
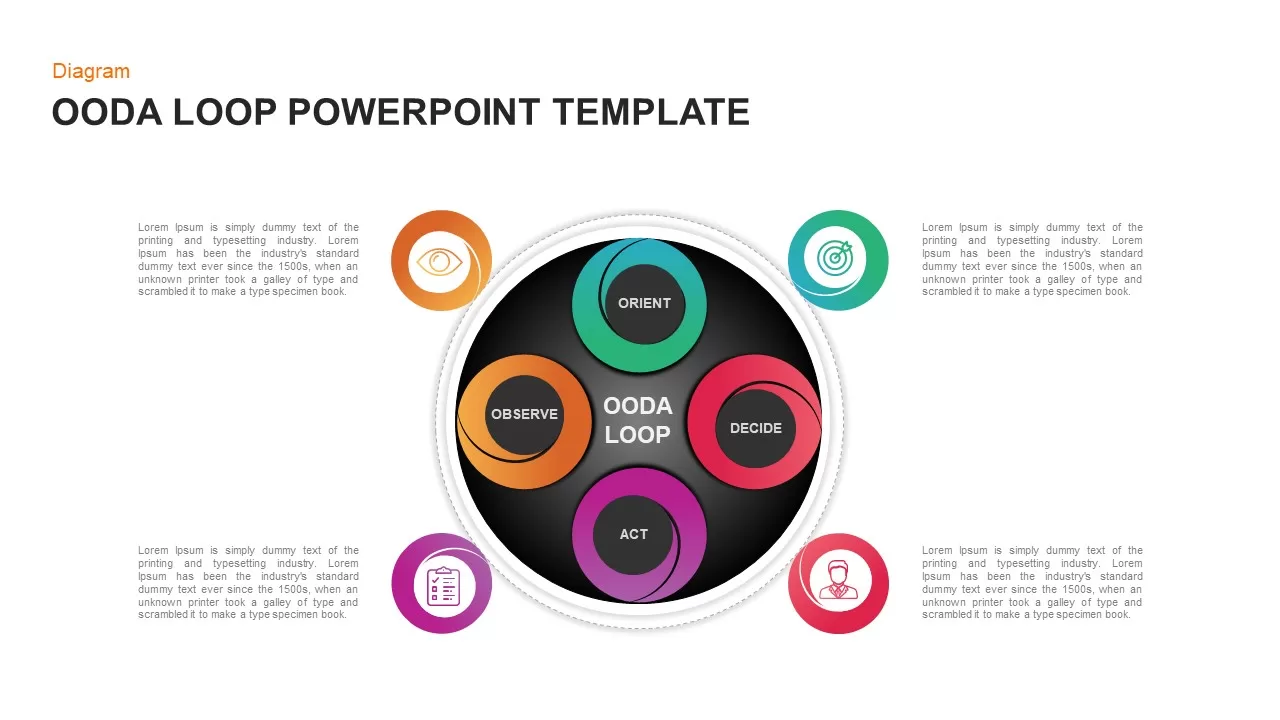
OODA Loop Diagram template for PowerPoint & Google Slides
Business
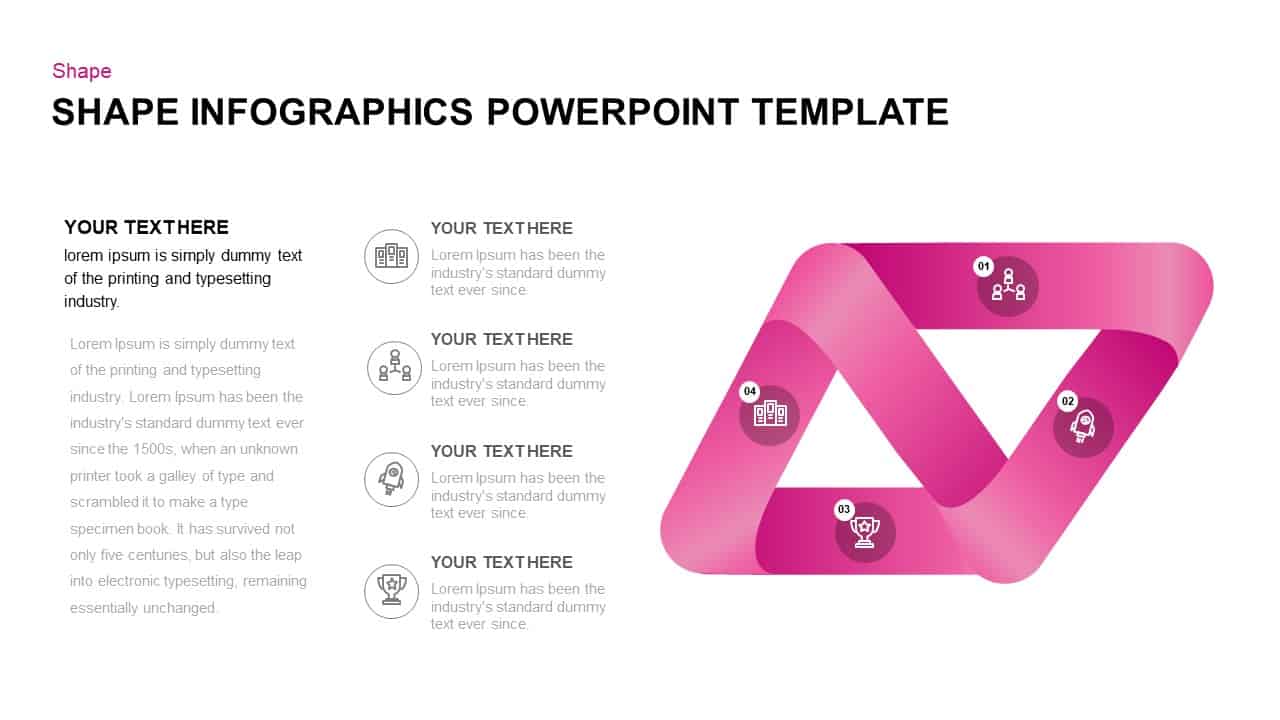
Shape Loop Four-Step Infographic Slide Template for PowerPoint & Google Slides
Process
Infinity Loop Infographic template for PowerPoint & Google Slides
Process
Modern Circular OODA Loop Infographic Template for PowerPoint & Google Slides
Circular
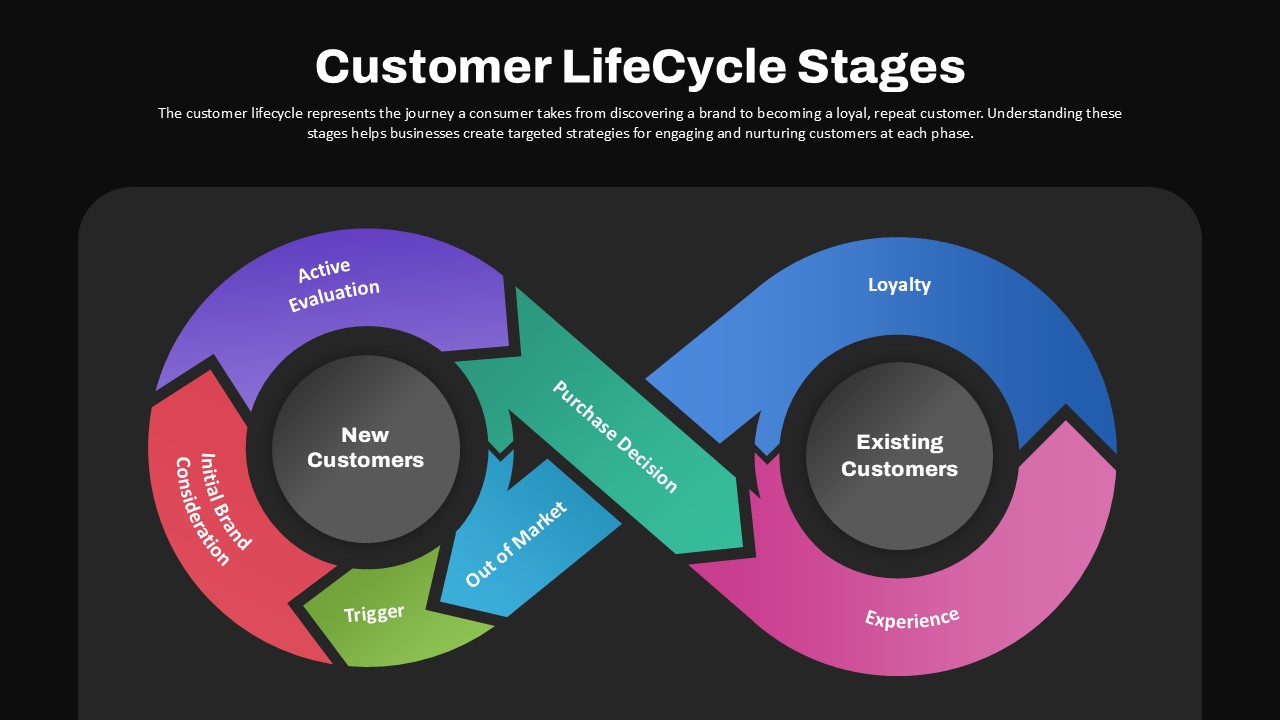
Customer Lifecycle Stages Infinity Loop Template for PowerPoint & Google Slides
Customer Journey
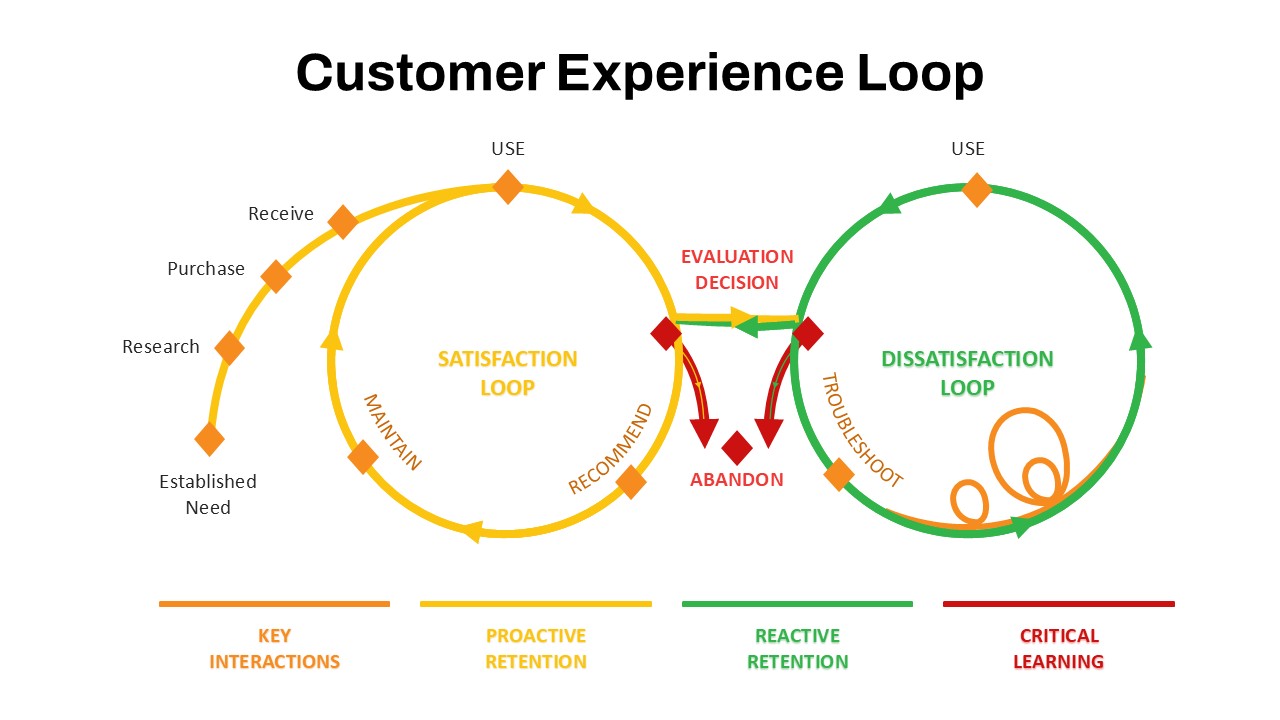
Customer Experience Loop Template for PowerPoint & Google Slides
Customer Experience
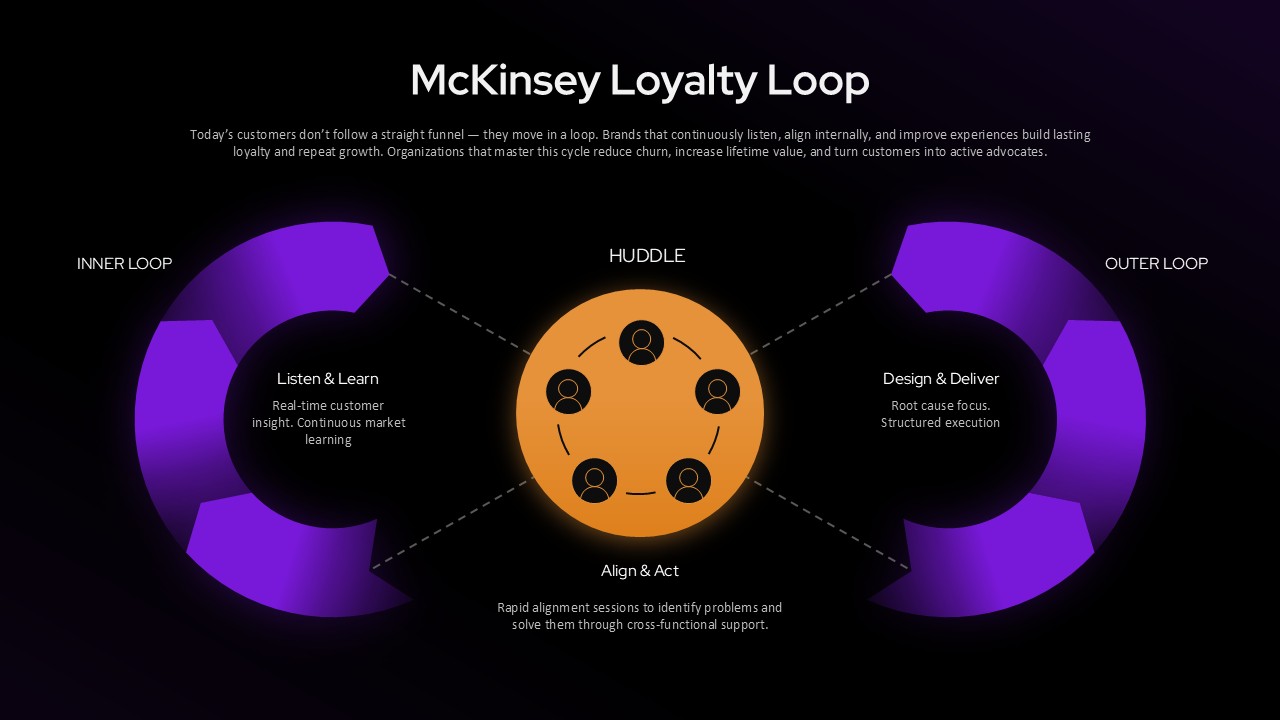
Customer Loyalty Loop (McKinsey Model) Presentation Template
Customer Experience