Carbon Footprint Environmental Impact Slide for PowerPoint & Google Slides
Description
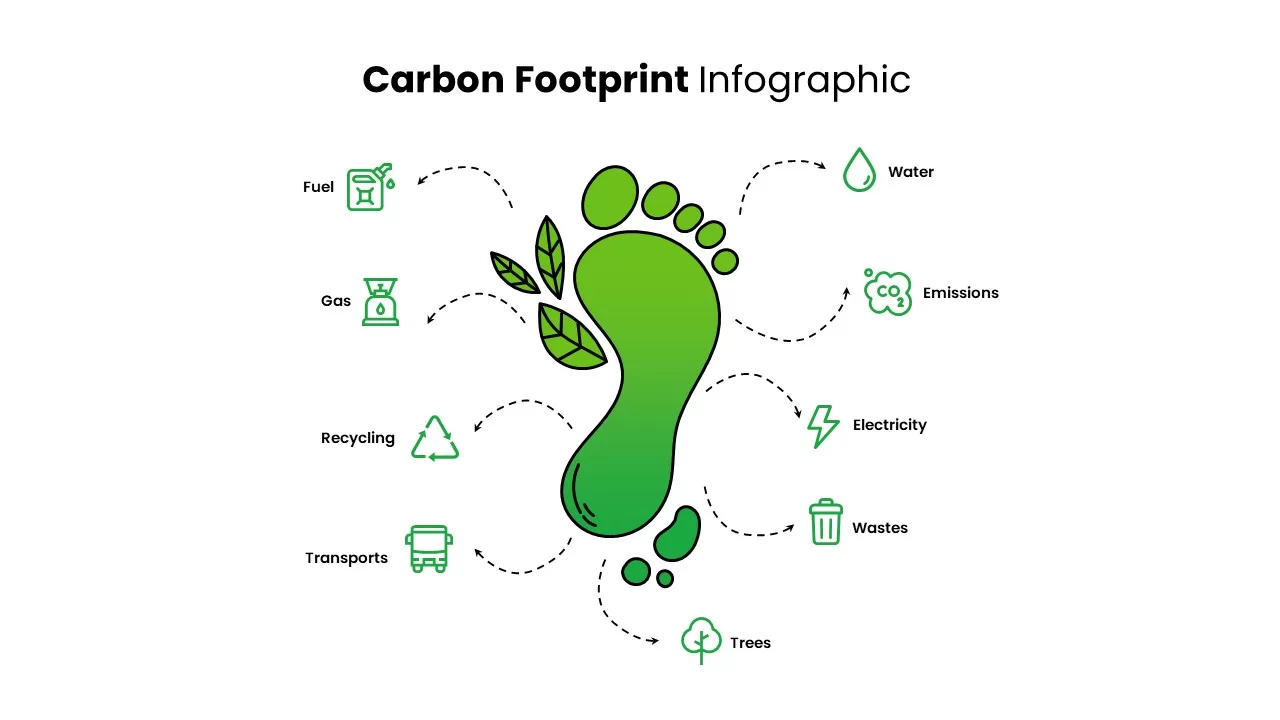
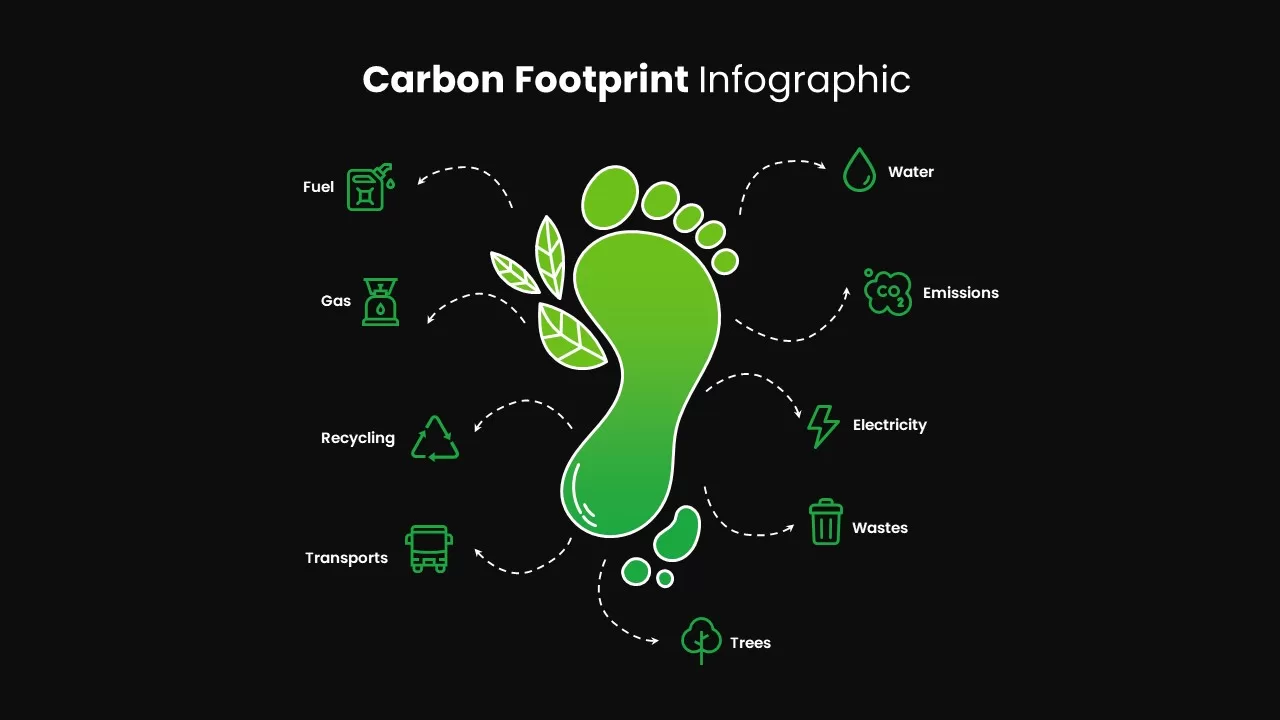
Illustrate your environmental impact with this visually compelling carbon footprint infographic slide. At the center lies a large green footprint—symbolizing individual or organizational impact on the planet—encircled by ten eco-themed icons connected via dashed lines. These icons represent key emission-related categories such as Fuel, Gas, Recycling, Transports, Trees, Water, Emissions, Electricity, and Wastes, making it easy to break down carbon drivers at a glance.
Each icon uses simple line-style graphics in shades of green, reinforcing the sustainability theme while maintaining design clarity. The circular arrangement of the elements promotes a systems-thinking approach, allowing viewers to quickly grasp the interdependence of factors influencing carbon output. This layout is ideal for environmental audits, sustainability presentations, ESG briefings, and educational material on climate responsibility.
Compatible with both PowerPoint and Google Slides, this infographic is fully editable—allowing users to customize icons, text labels, or color schemes to suit their message or brand. Whether you’re preparing an internal report, investor pitch, or school presentation, this slide communicates carbon impact data with authority and visual ease.
Who is it for
Designed for sustainability professionals, ESG analysts, environmental educators, CSR teams, and policy presenters needing a clear visual framework to explain carbon footprint sources.
Other Uses
Beyond carbon emissions, this slide can be adapted for life cycle assessments, eco-strategy development, waste audits, or green certification overviews. It’s also suitable for non-profits, NGOs, and municipal campaigns promoting climate awareness.
Login to download this file

Item ID
SB03107
Related Templates

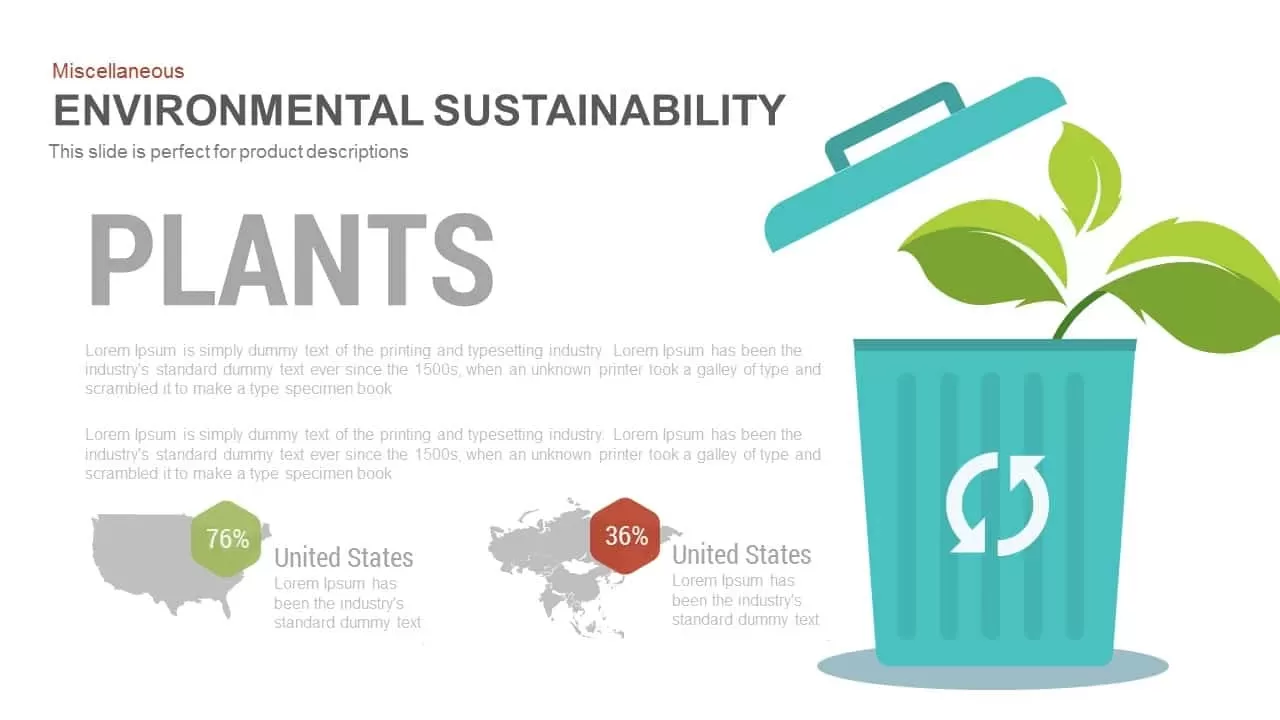
Environmental Plants template for PowerPoint & Google Slides
Infographics
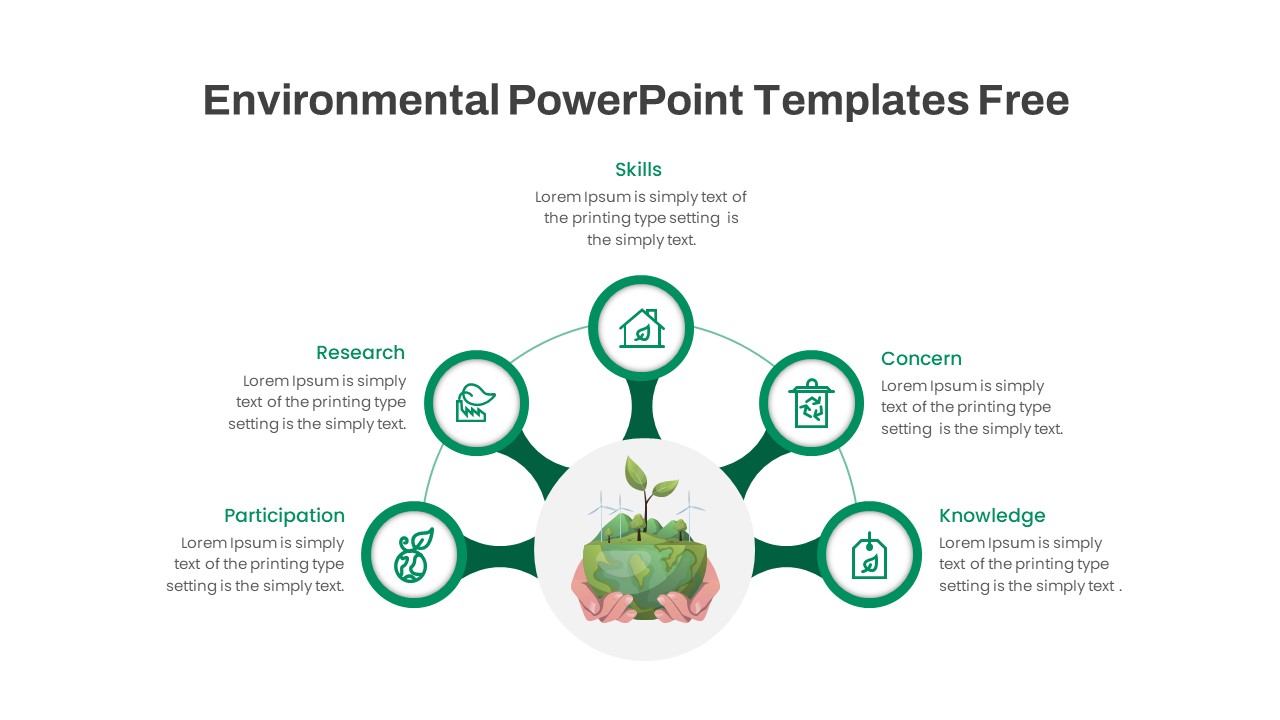
Free Environmental Hub-and-Spoke Diagram Template for PowerPoint & Google Slides
Circular
Free
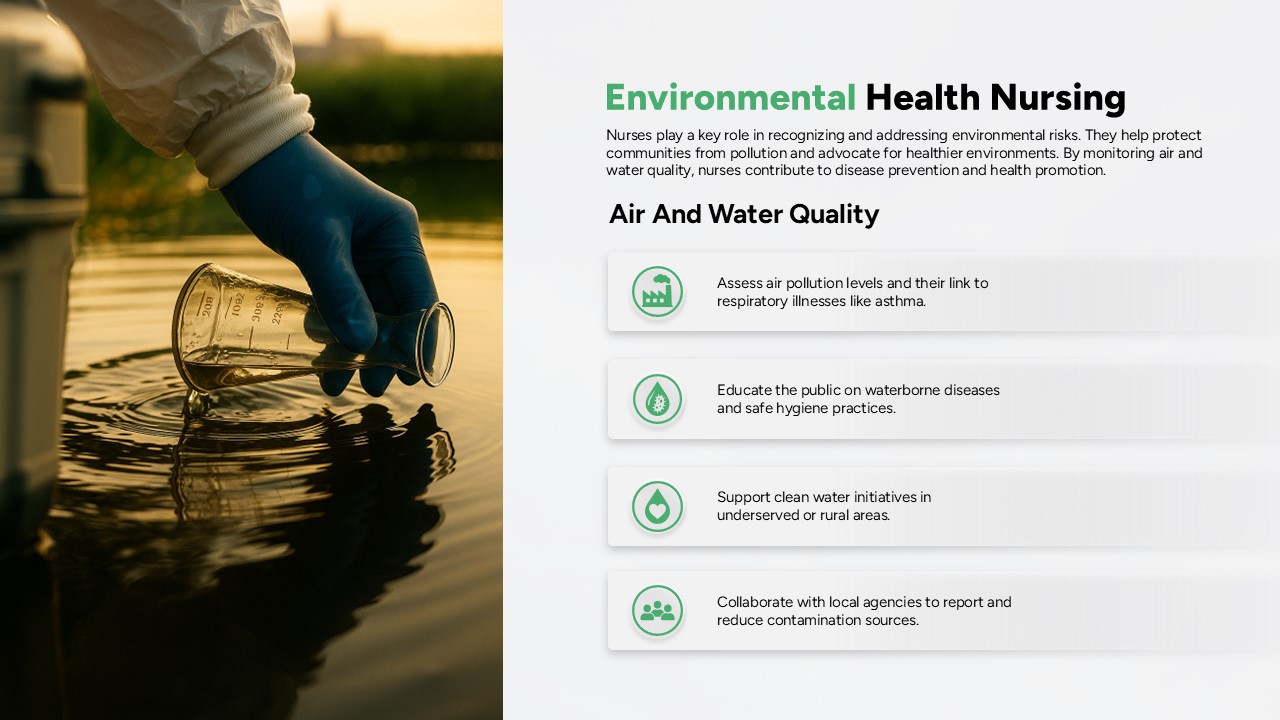
Environmental Nursing Health: Air & Water Template for PowerPoint & Google Slides
Nursing
Comprehensive Risk Impact Analysis Template for PowerPoint & Google Slides
Risk Management
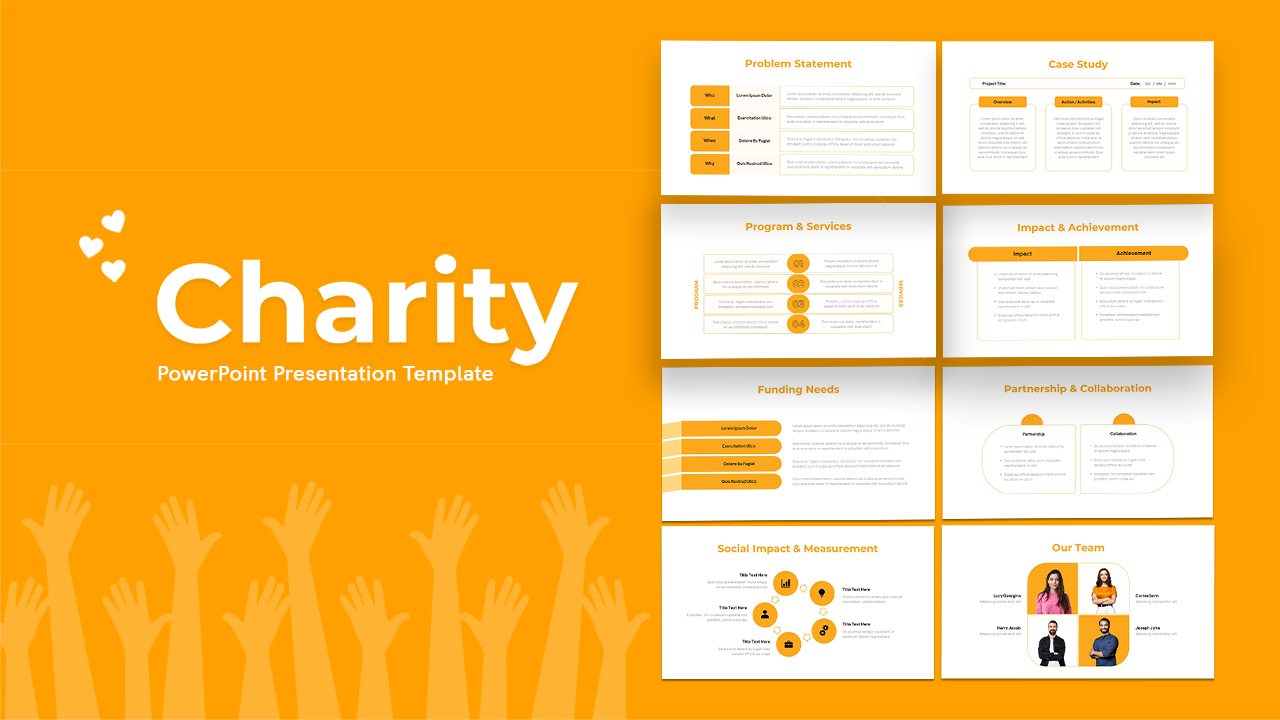
Free Nonprofit Charity Social Impact Deck Template for PowerPoint & Google Slides
Pitch Deck
Free
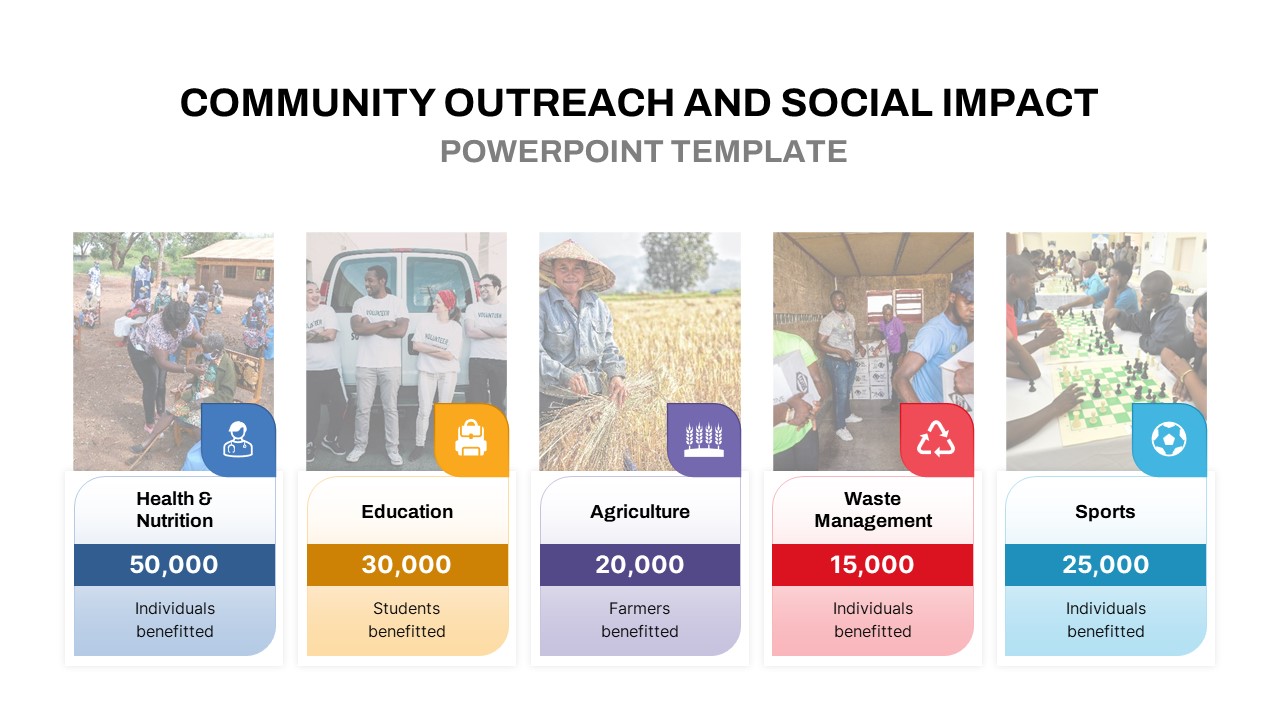
Community Outreach Impact Metrics Template for PowerPoint & Google Slides
Accomplishment
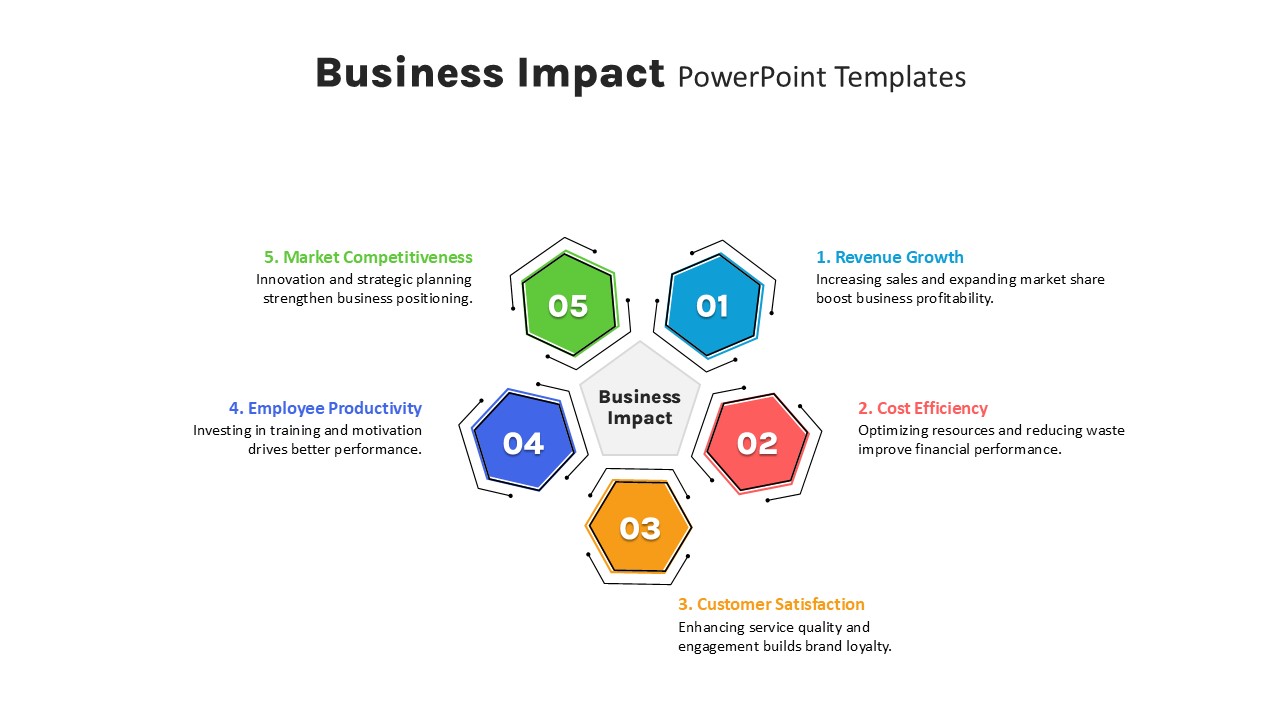
Five-Step Hexagon Business Impact Template for PowerPoint & Google Slides
Circular
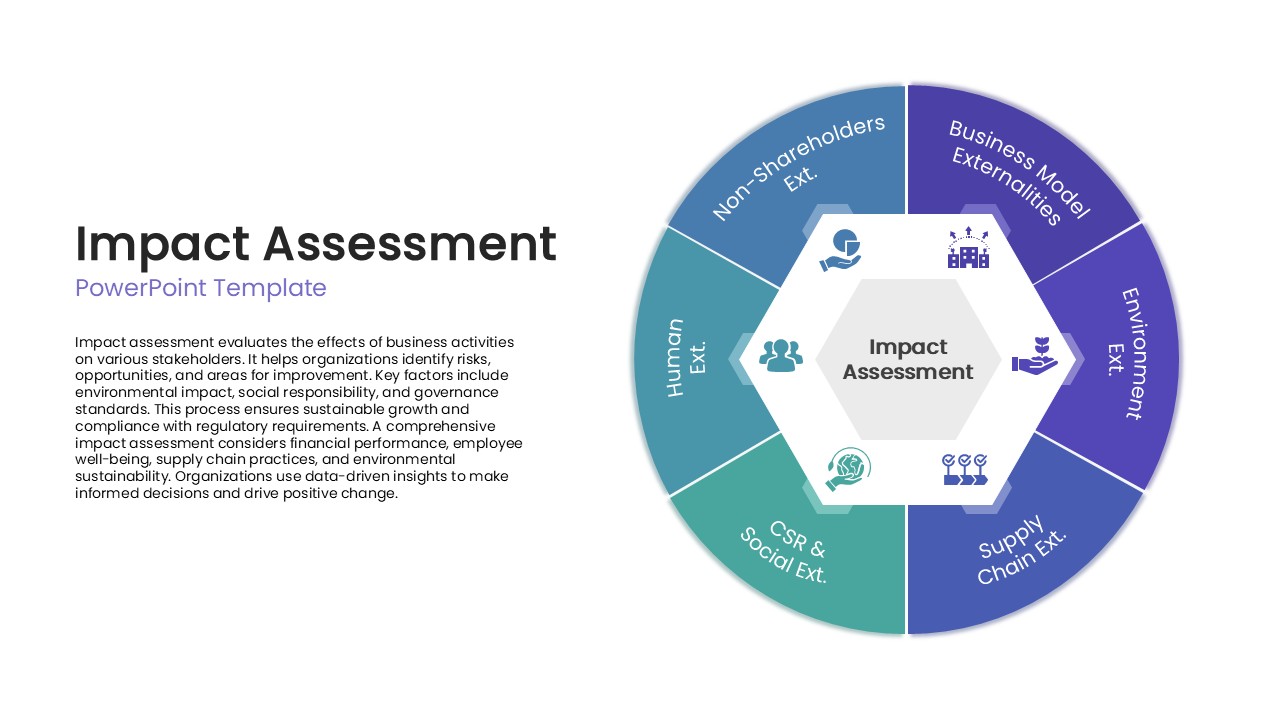
Impact Assessment Circular Diagram Template for PowerPoint & Google Slides
Circular
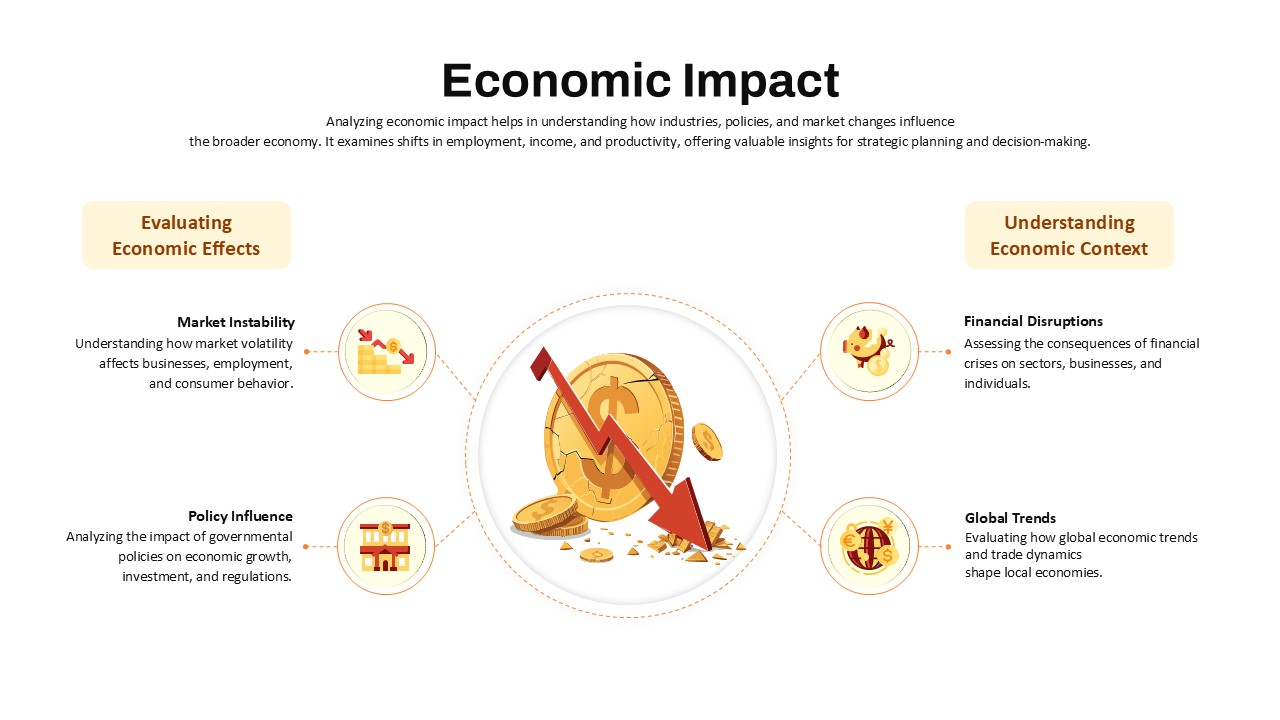
Economic Impact Assessment template for PowerPoint & Google Slides
Business Report
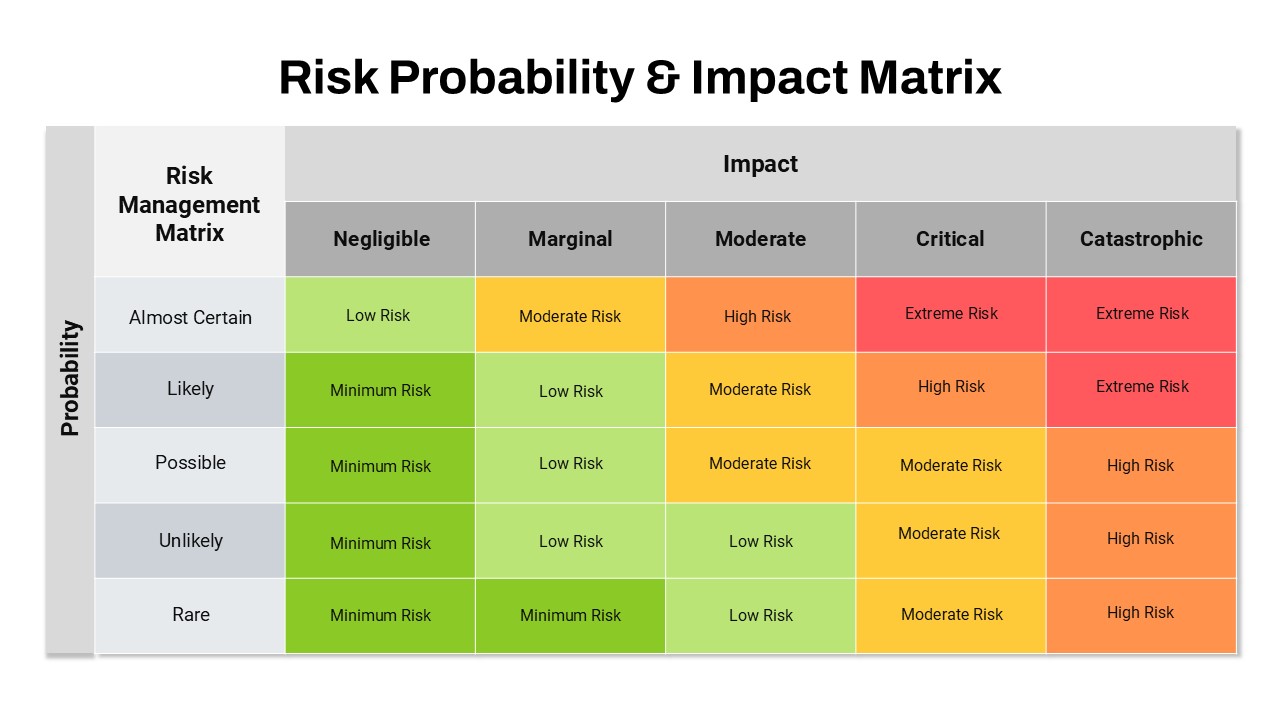
Risk Probability and Impact Matrix Template for PowerPoint & Google Slides
Risk Management
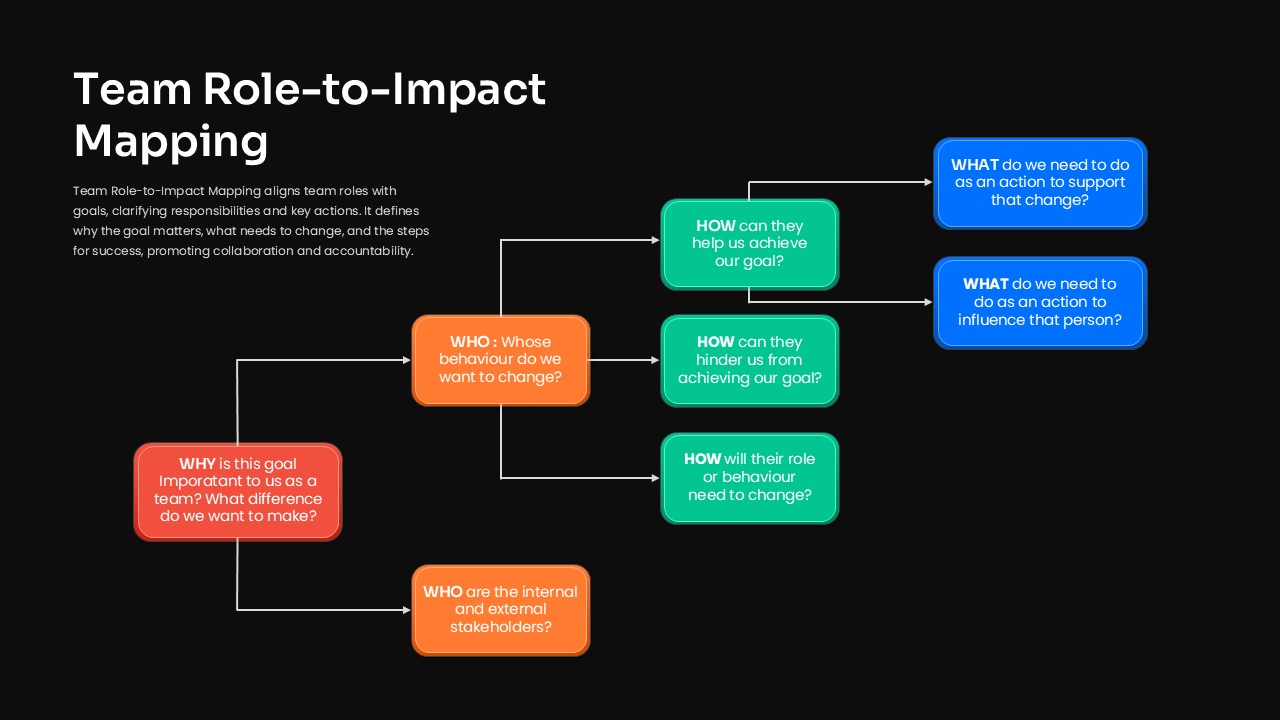
Team Role-to-Impact Mapping Flowchart Template for PowerPoint & Google Slides
Process

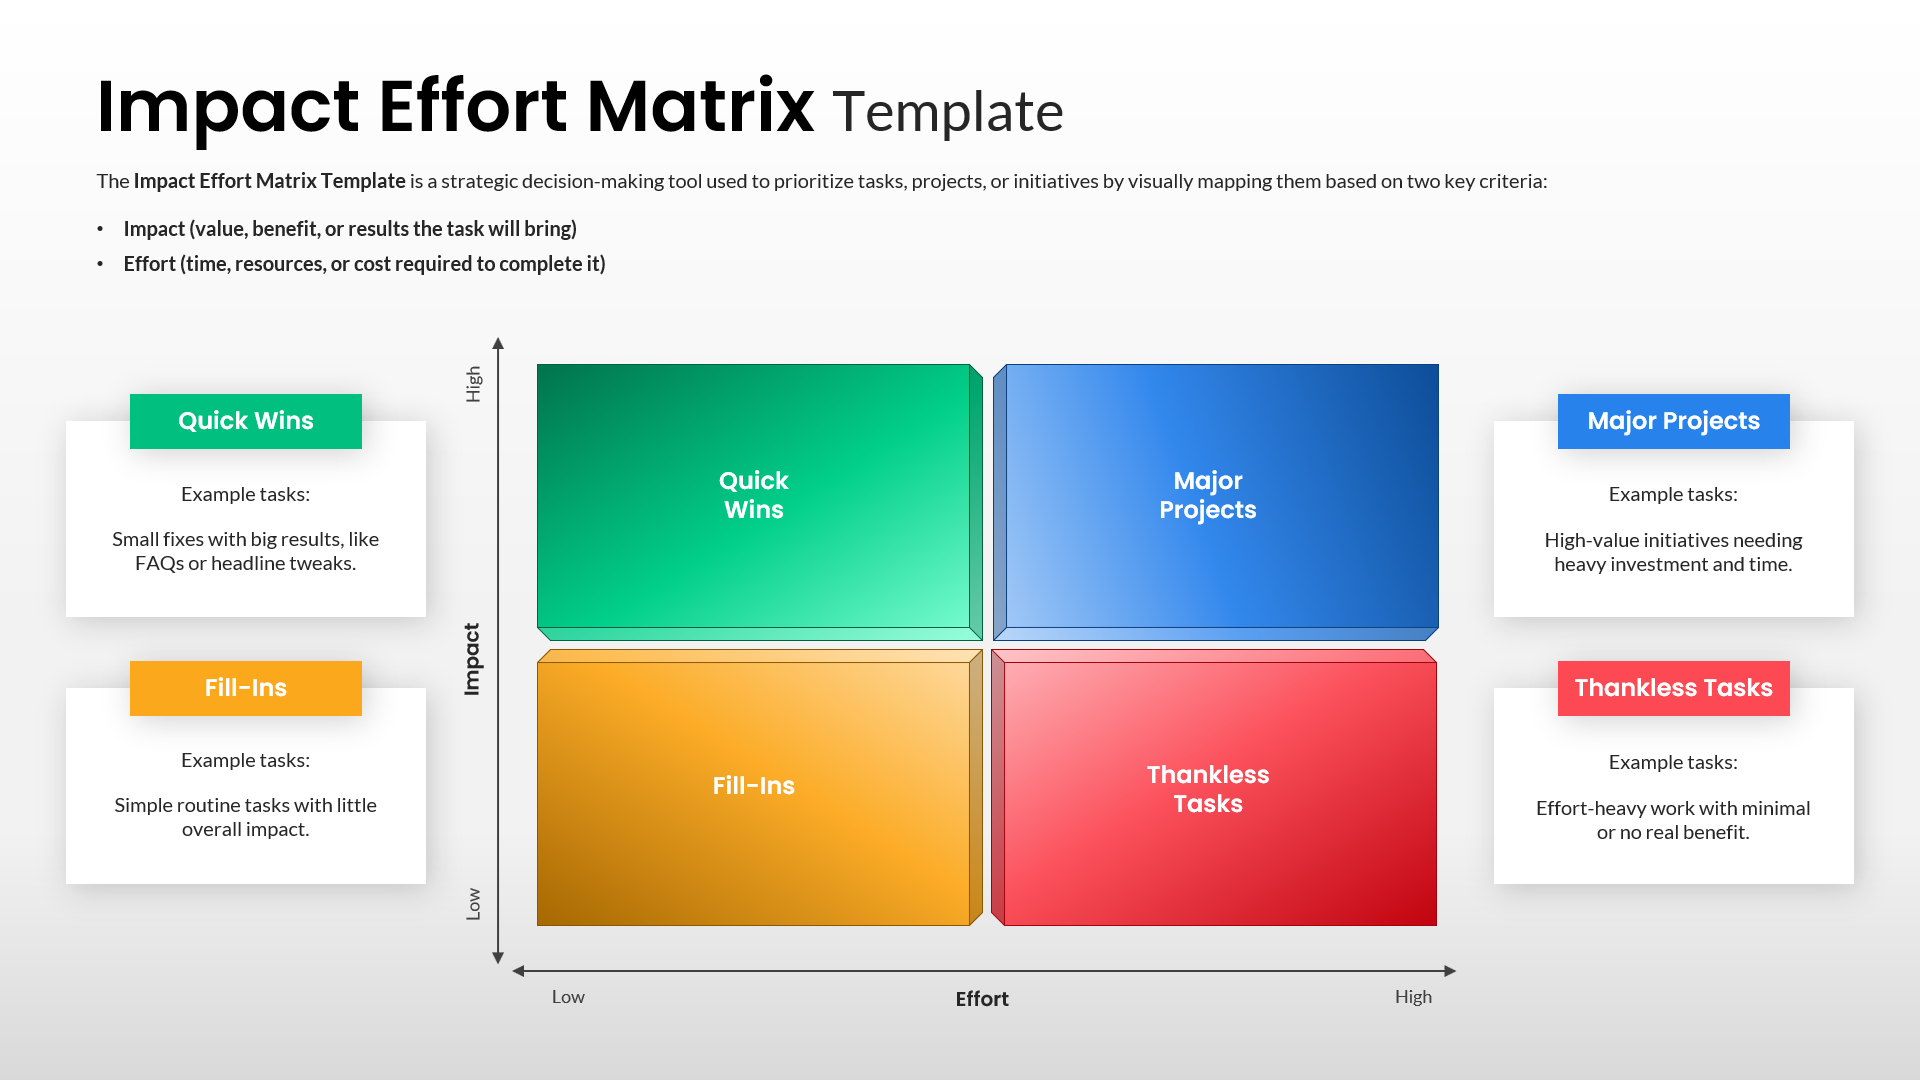
Impact Effort Matrix Template for PowerPoint & Google Slides
Comparison Chart