business-strategy-infographics-powerpoint-and-keynote-template

Description
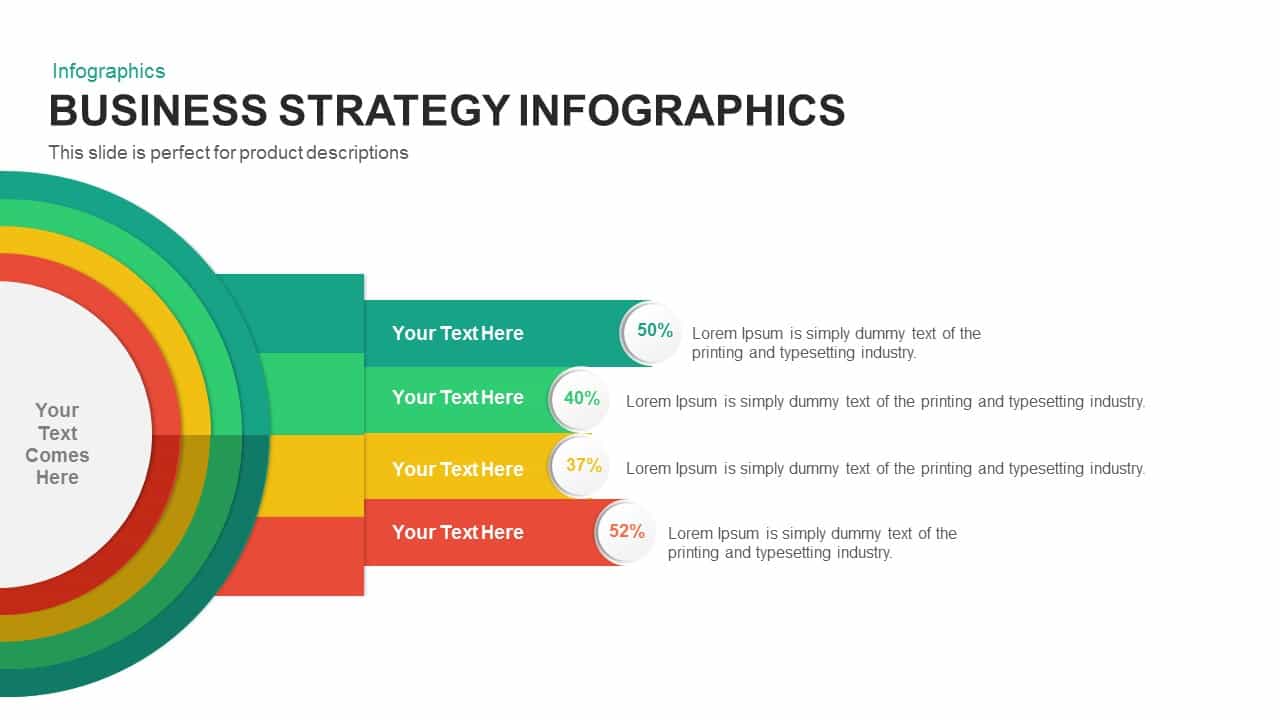
Leverage this comprehensive business strategy infographic slide to present four key performance metrics or strategic focus areas with clarity and visual flair. A concentric circular hub on the left anchors four horizontal bars—each linked to a colored ring segment—guiding audiences through sequential data points or strategic pillars. Every bar features a vector icon placeholder, bold headline field, and percentage callout to spotlight critical KPIs. The clean, flat design employs fully editable vector shapes on master slides: adjust ring radii, swap icons from the embedded 50-plus symbol library, recolor bars to match corporate brand palettes, and modify typography without losing crispness or alignment. Subtle drop shadows and precision snap-to-grid guides maintain depth and perfect symmetry, while generous white space preserves an uncluttered layout.
Built for rapid customization and collaborative workflows, intuitive placeholders simplify content updates, and locked guides protect layout integrity during real-time edits in both PowerPoint and Google Slides. Extend or shorten the infographic by duplicating or removing bar segments, apply gradient or flat fills with a single click, and choose between light or dark master variants to suit any presentation theme. High-definition output across devices ensures your strategic insights remain sharp in boardrooms, virtual meetings, or client pitches. Whether you’re mapping quarterly objectives, tracking product roadmap milestones, or benchmarking competitive analysis metrics, this slide transforms complex strategy data into an engaging, data-driven narrative that resonates with stakeholders.
Who is it for
Business strategists, marketing leaders, project managers, and consultants will benefit from this slide when presenting performance dashboards, strategic roadmaps, or competitive benchmarks in executive briefings, investor pitches, and stakeholder workshops.
Other Uses
Repurpose this infographic for KPI tracking, market segmentation analyses, product feature comparisons, annual goal reviews, or departmental performance overviews. Adjust bar counts and labels to suit any multi-phase narrative or data storytelling need.
Login to download this file


