Business Growth Diagram for PowerPoint & Google Slides


Description
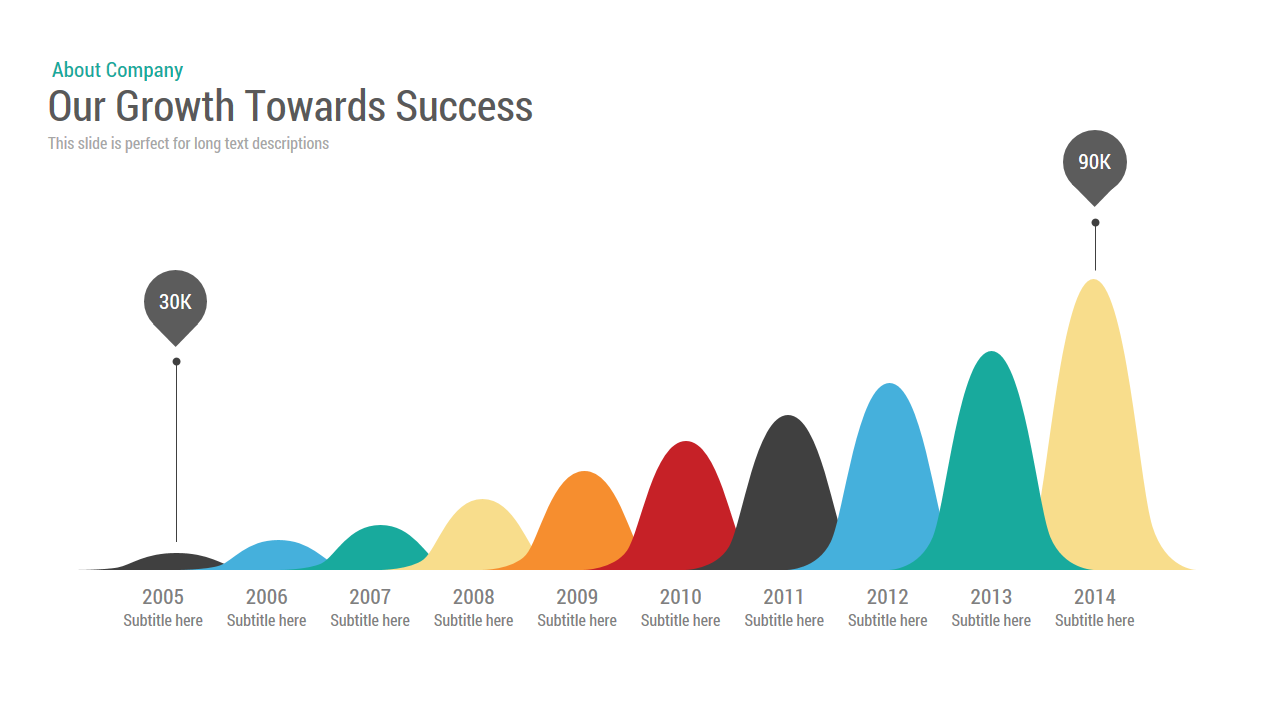
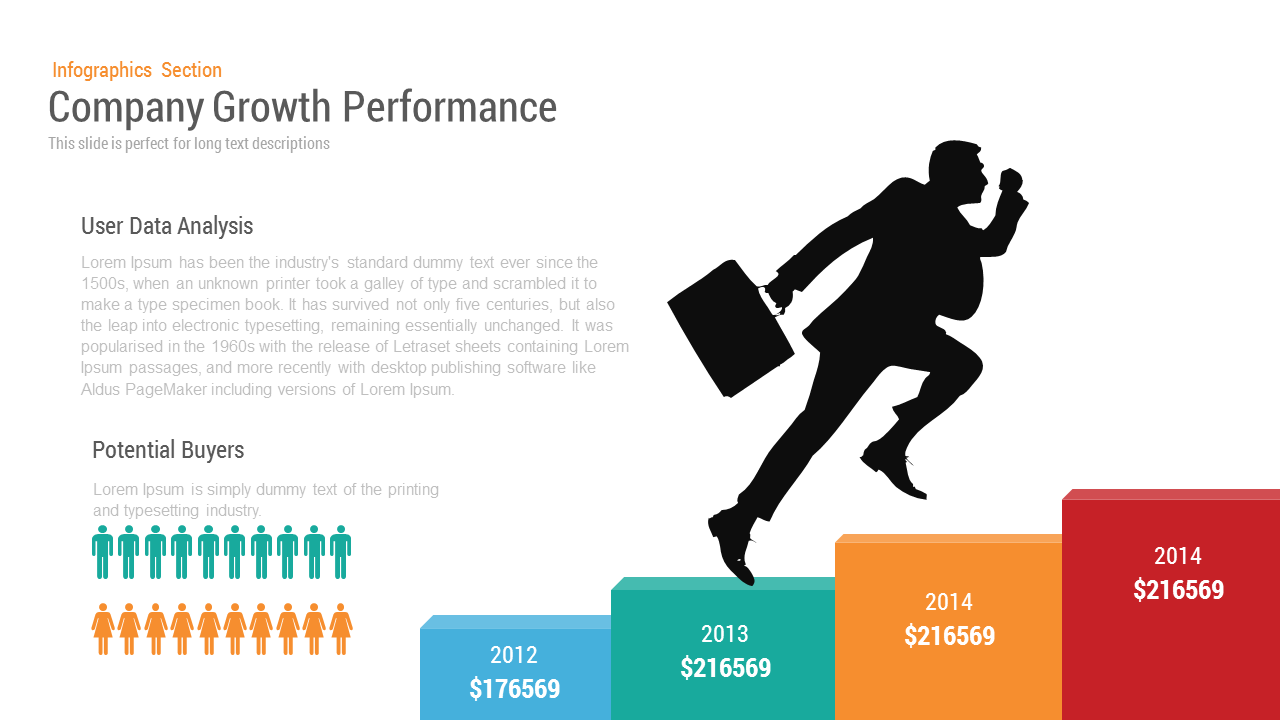
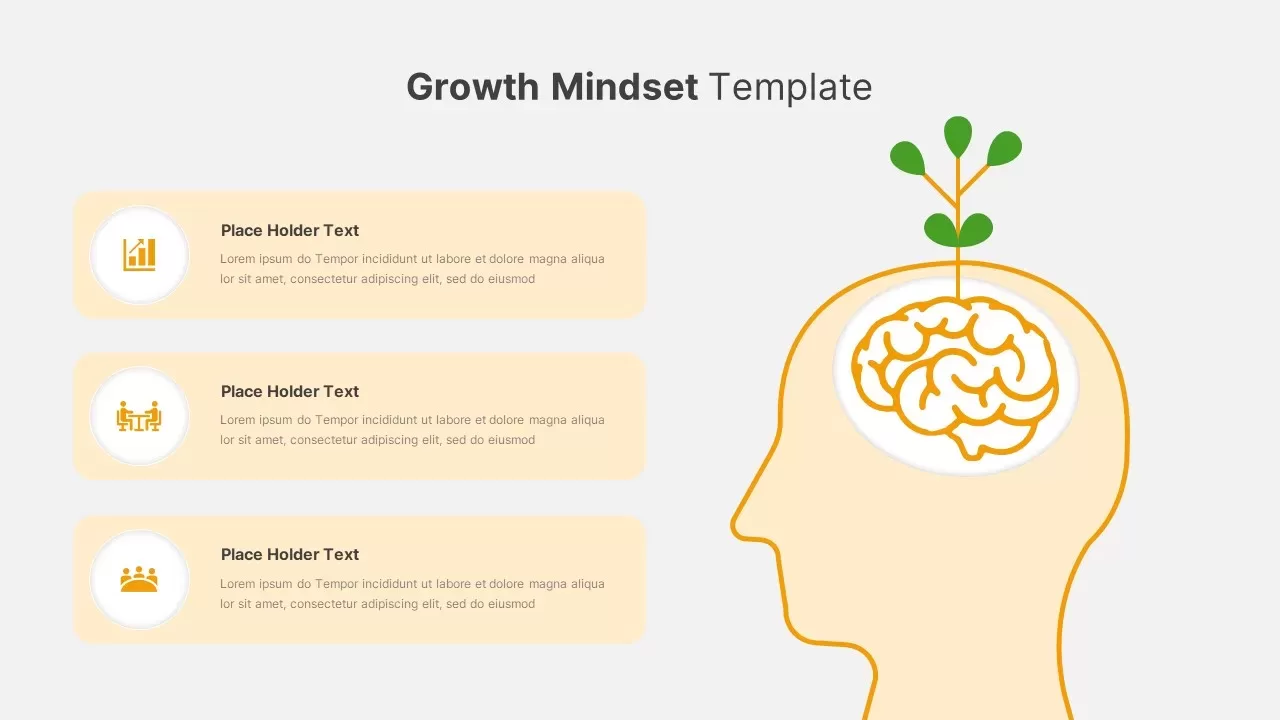
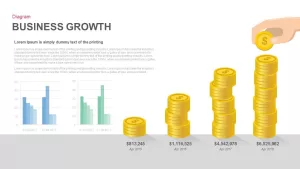
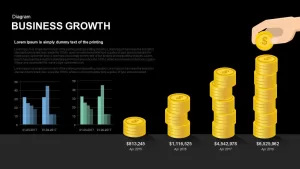
This visually engaging business growth diagram offers a clear representation of financial progress over time, ideal for showcasing year-over-year growth or performance. Featuring bar charts that display key financial metrics such as revenue or sales, along with a series of stacked coins representing overall growth, this template effectively communicates financial data with both clarity and visual appeal.
The bar charts are color-coded to show different periods, with data points representing values such as April 2015, 2016, 2017, and 2018. The stacked coins in the center provide a dynamic visual cue to the increasing value over time, making the information both informative and easy to understand. This template also includes placeholder text for customizable labels, descriptions, and financial data, allowing you to adapt it to suit your specific business context.
Perfect for financial reports, business presentations, or growth projections, this diagram makes it easy to illustrate the trajectory of your company’s financial success. It is fully editable in both PowerPoint and Google Slides, ensuring that you can make adjustments as needed for your specific presentation needs.
Who is it for
This slide is ideal for business managers, financial analysts, project leads, or consultants who need to communicate growth figures and financial performance in a professional and visually appealing way. It’s also perfect for marketing teams or sales leaders showcasing revenue or profit growth.
Other Uses
Beyond business growth, this slide can be used for illustrating sales progress, market expansion, product launches, or even customer growth over time. It’s also effective for showing budgetary improvements, financial forecasts, or performance metrics.
Login to download this file

Item ID
SB00793
Related Templates

Growth Arrow for Progress & Growth template for PowerPoint & Google Slides
Arrow

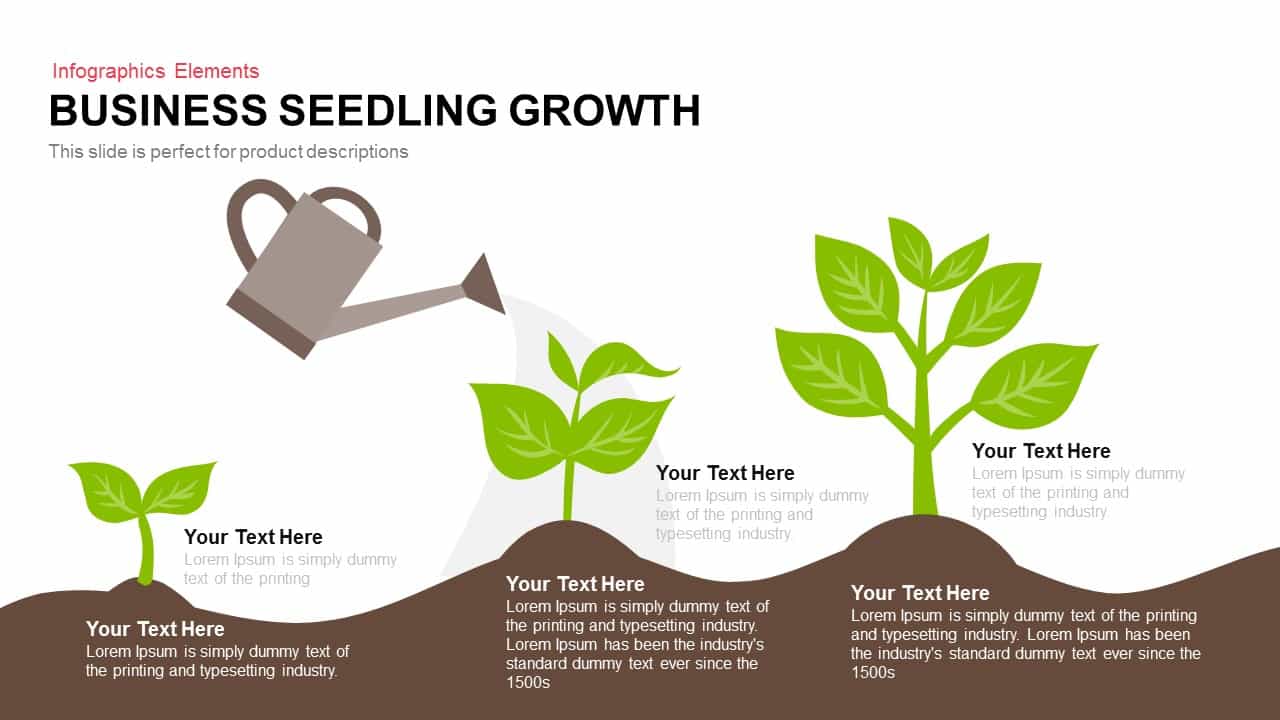
Business Seedling Growth Template for PowerPoint & Google Slides
Infographics
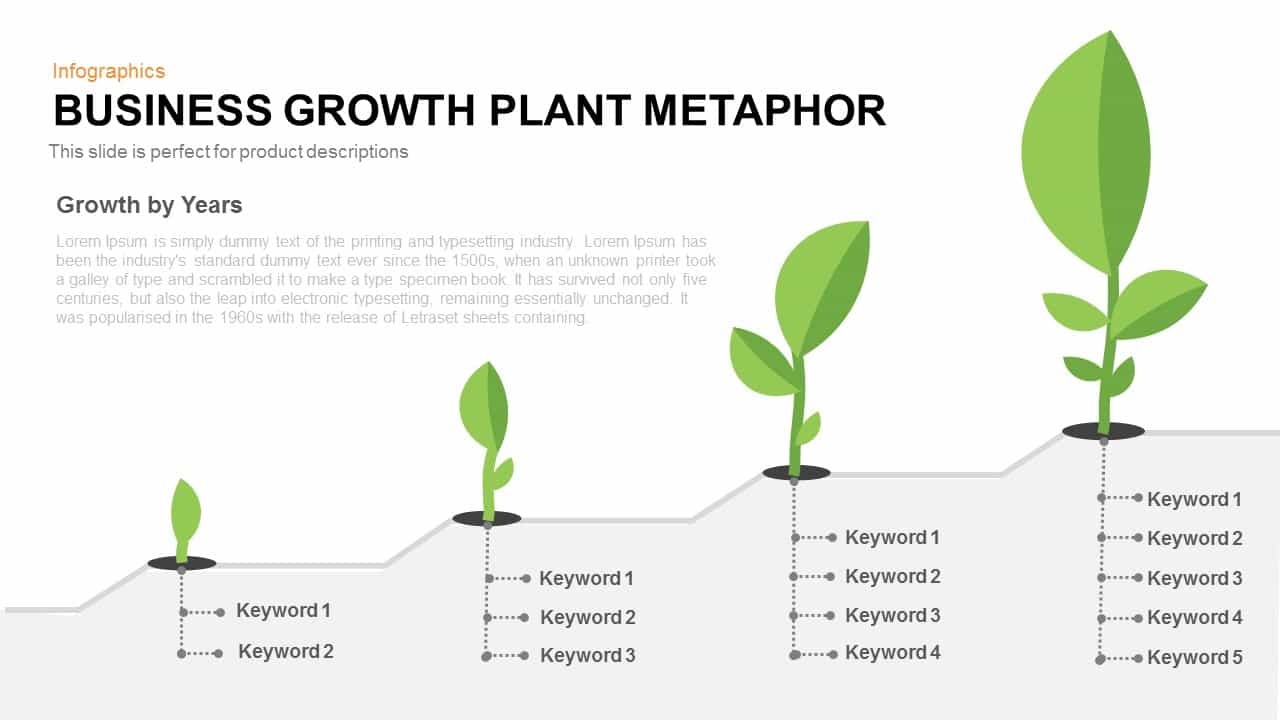
Business Growth Plant Metaphor Timeline Template for PowerPoint & Google Slides
Business Strategy
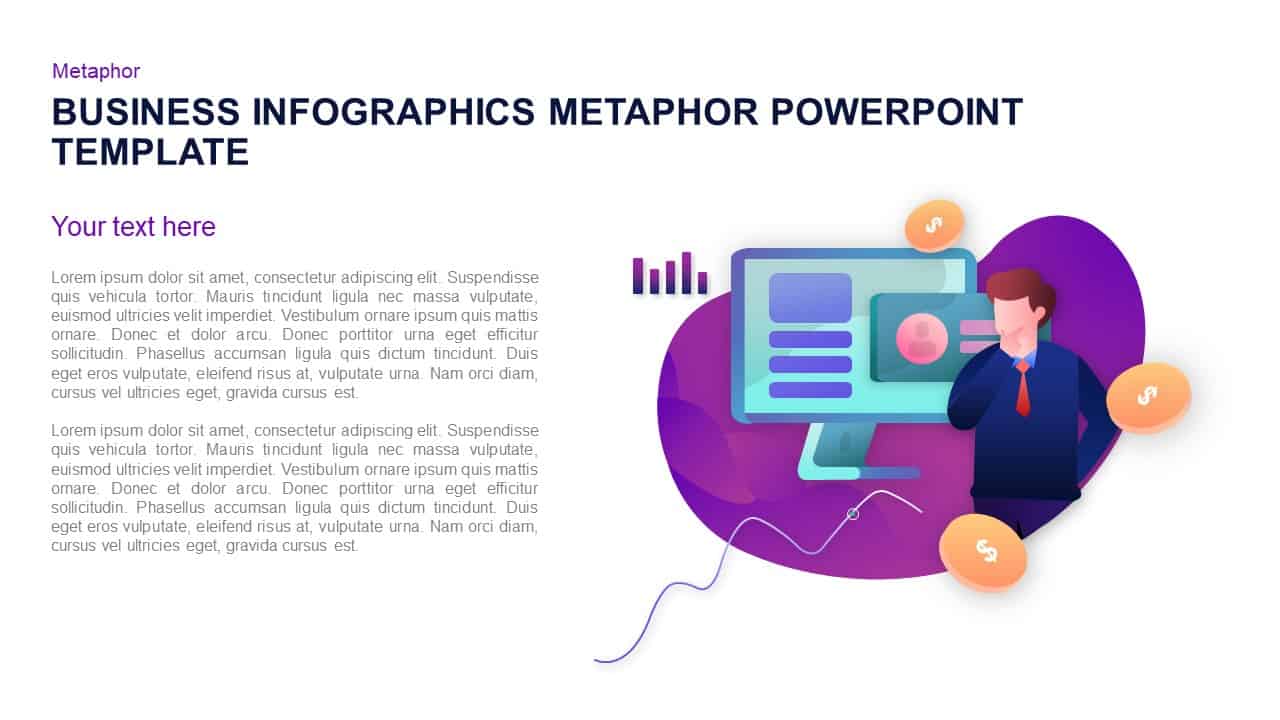
Business Growth Infographic Metaphor Template for PowerPoint & Google Slides
Revenue
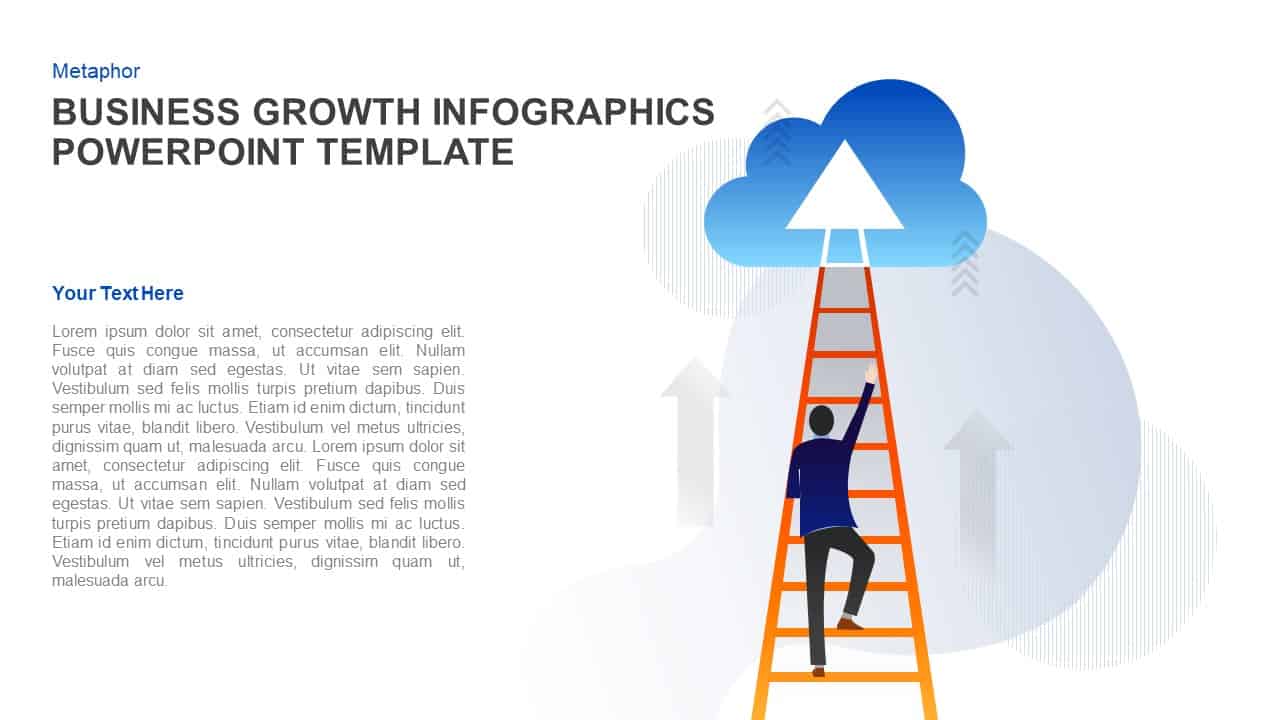
Business Growth Ladder to Cloud Metaphor Template for PowerPoint & Google Slides
Vision and Mission
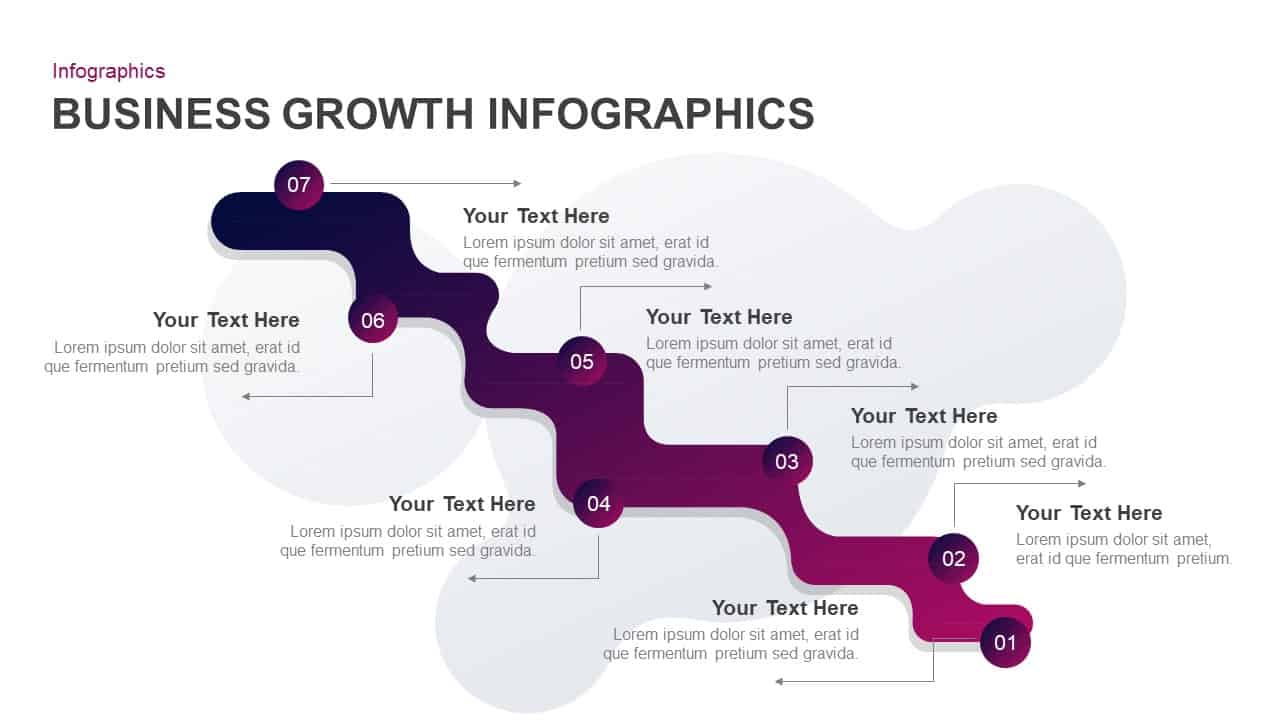
Business Growth Infographics Template for PowerPoint & Google Slides
Roadmap
Business Growth Plant Infographics Pack Template for PowerPoint & Google Slides
Process
Business Growth Metaphor Chart Template for PowerPoint & Google Slides
Business
Business Growth Strategies Matrix Template for PowerPoint & Google Slides
Comparison

Growth Plant Nurture Business Development Template for PowerPoint & Google Slides
Decks
Seeds Growth Cycle Business Model Template for PowerPoint & Google Slides
Process
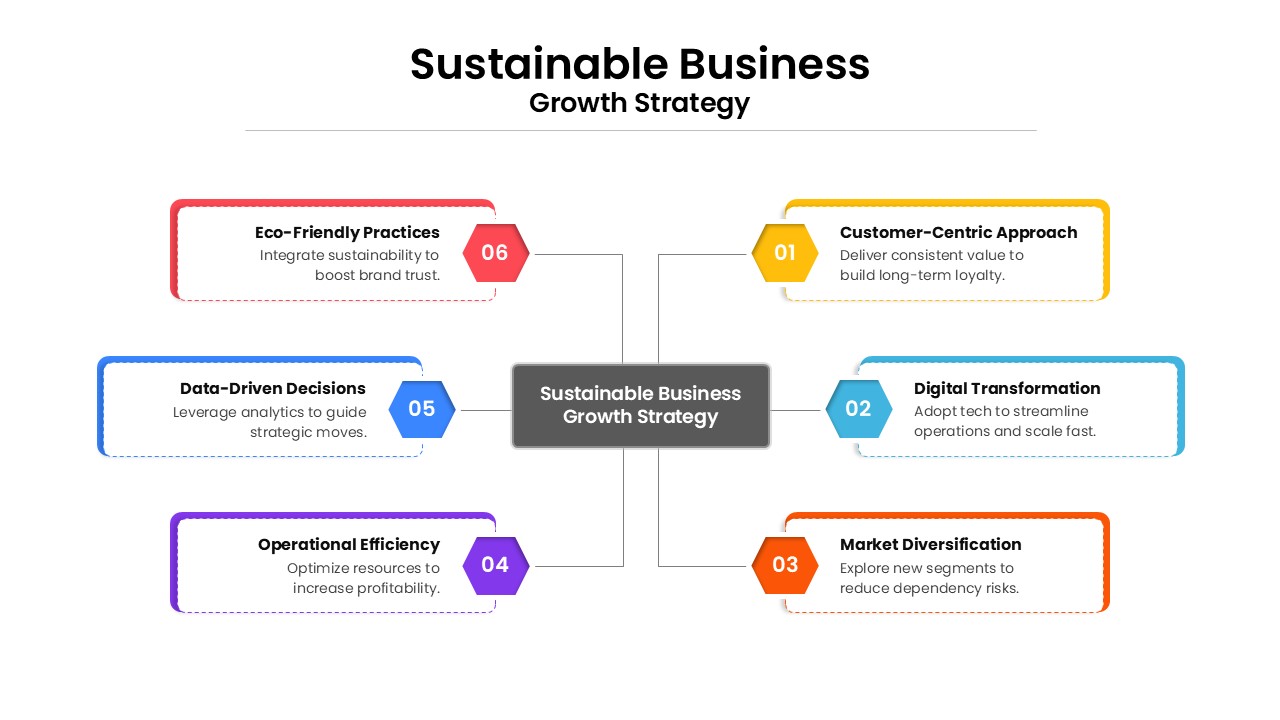
Sustainable Business Growth Strategy Template for PowerPoint & Google Slides
Process
Business Growth and Partnership Background for PowerPoint & Google Slides
Business
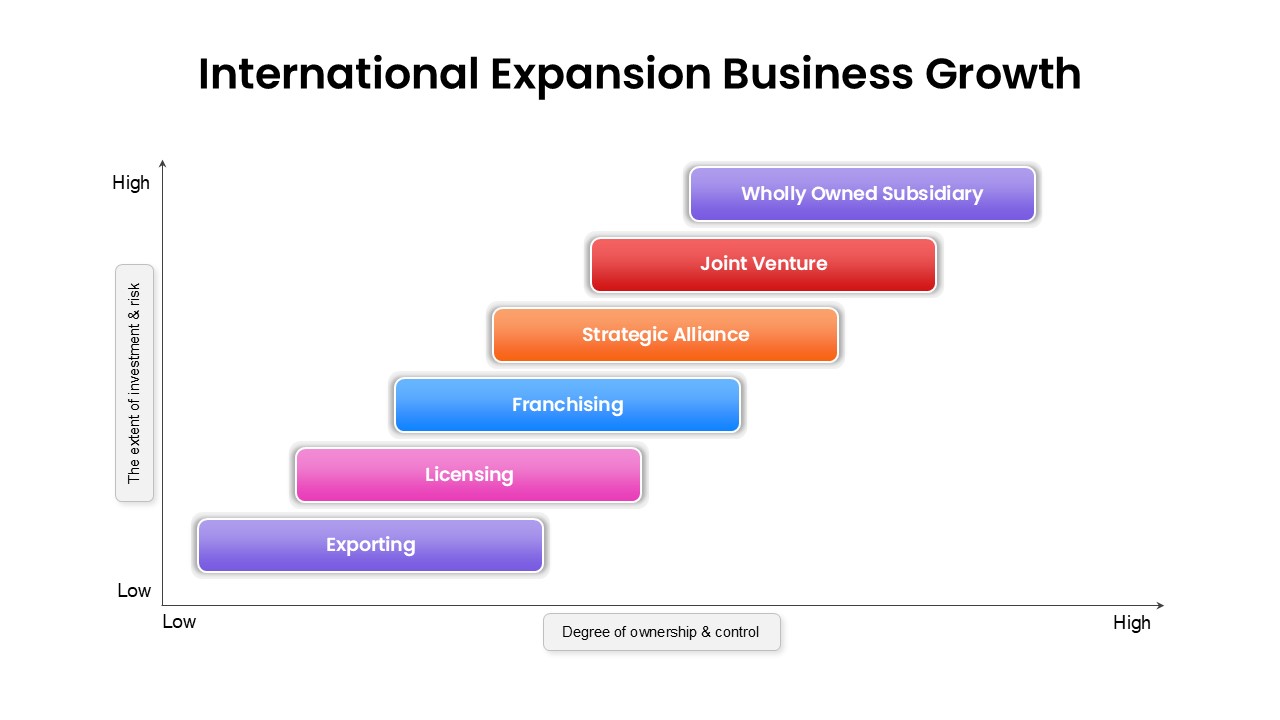
International Expansion Business Growth template for PowerPoint & Google Slides
Business Strategy
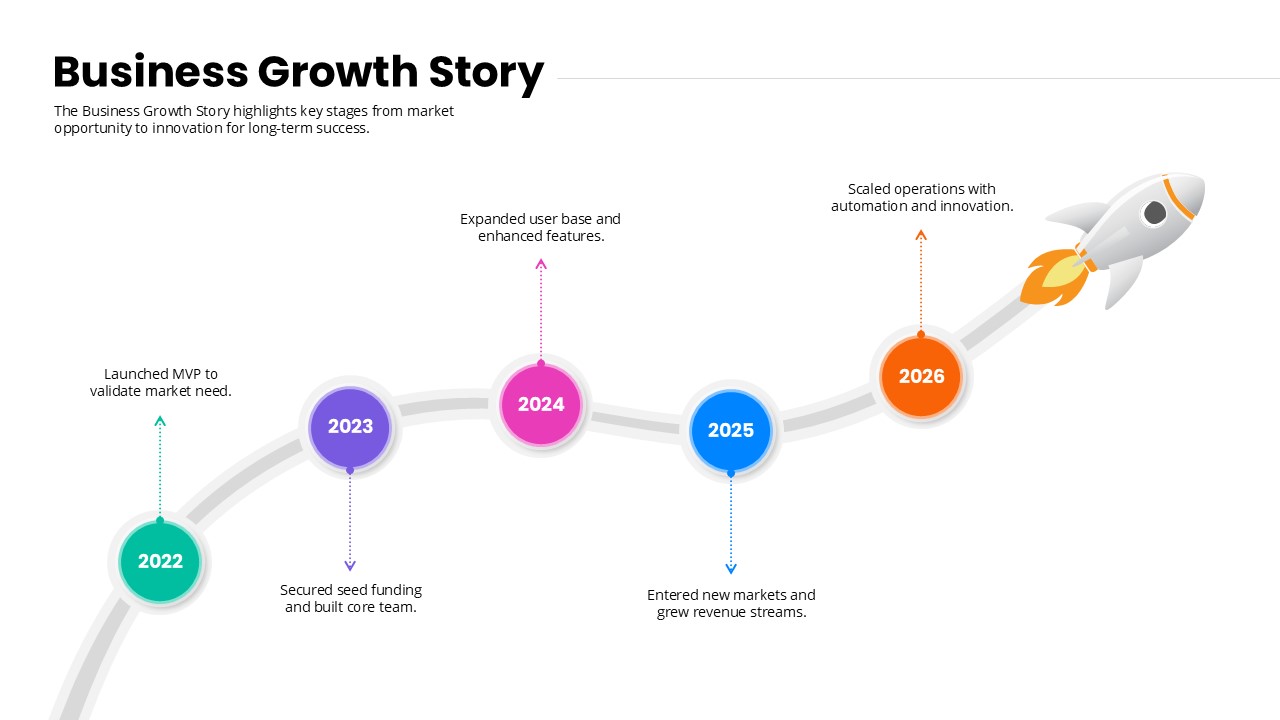
Business Growth Story timeline template for PowerPoint & Google Slides
Timeline
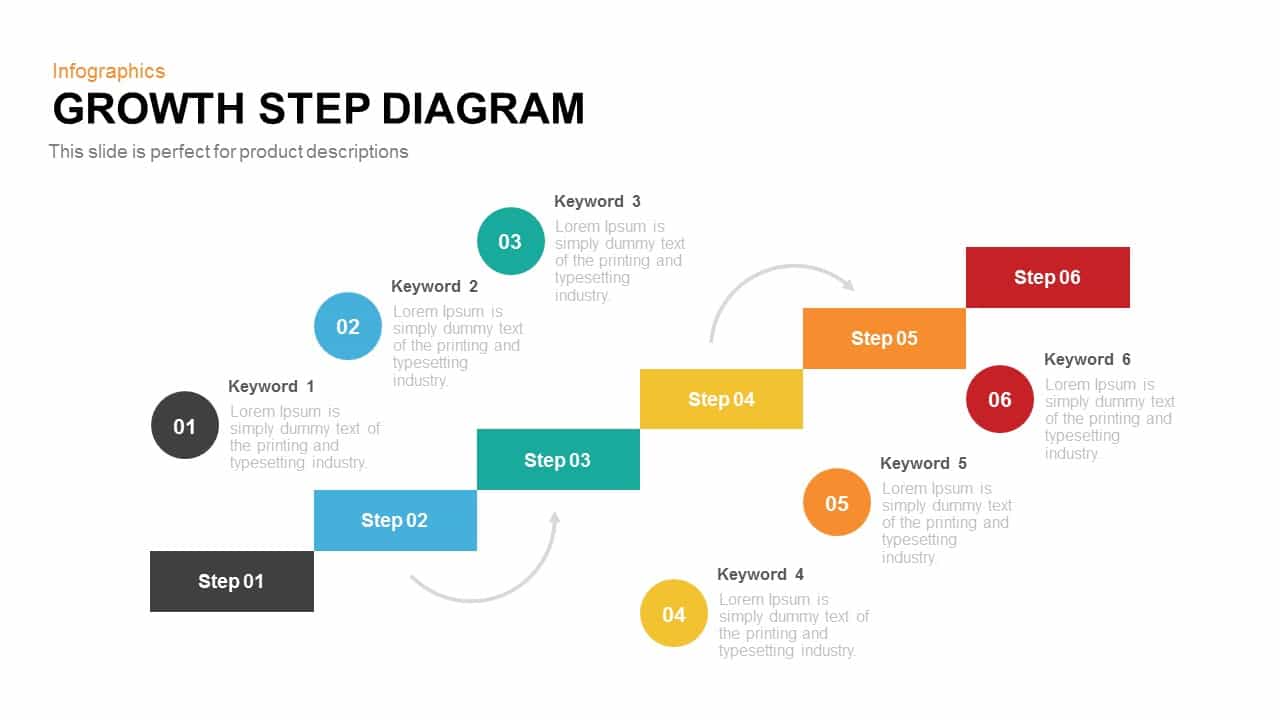
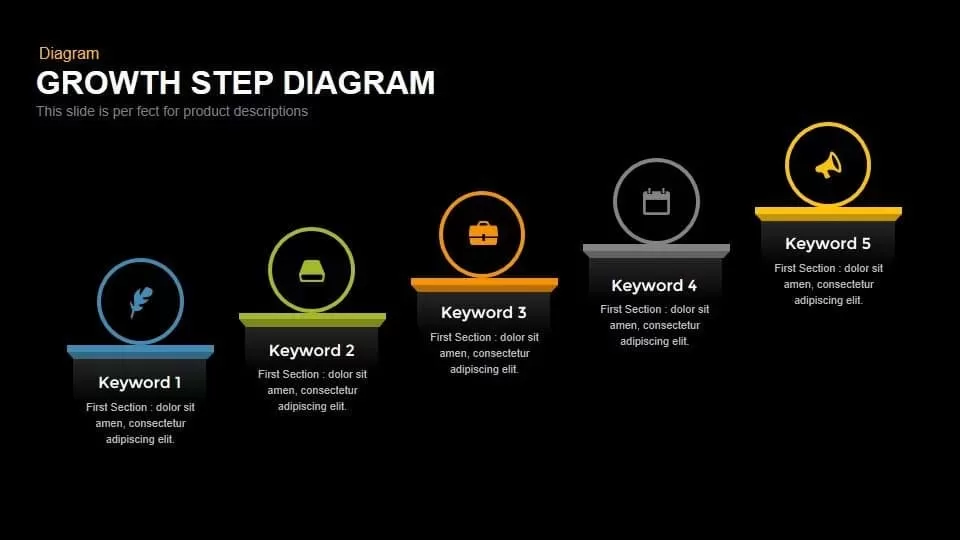
Growth Step Diagram template for PowerPoint & Google Slides
Infographics
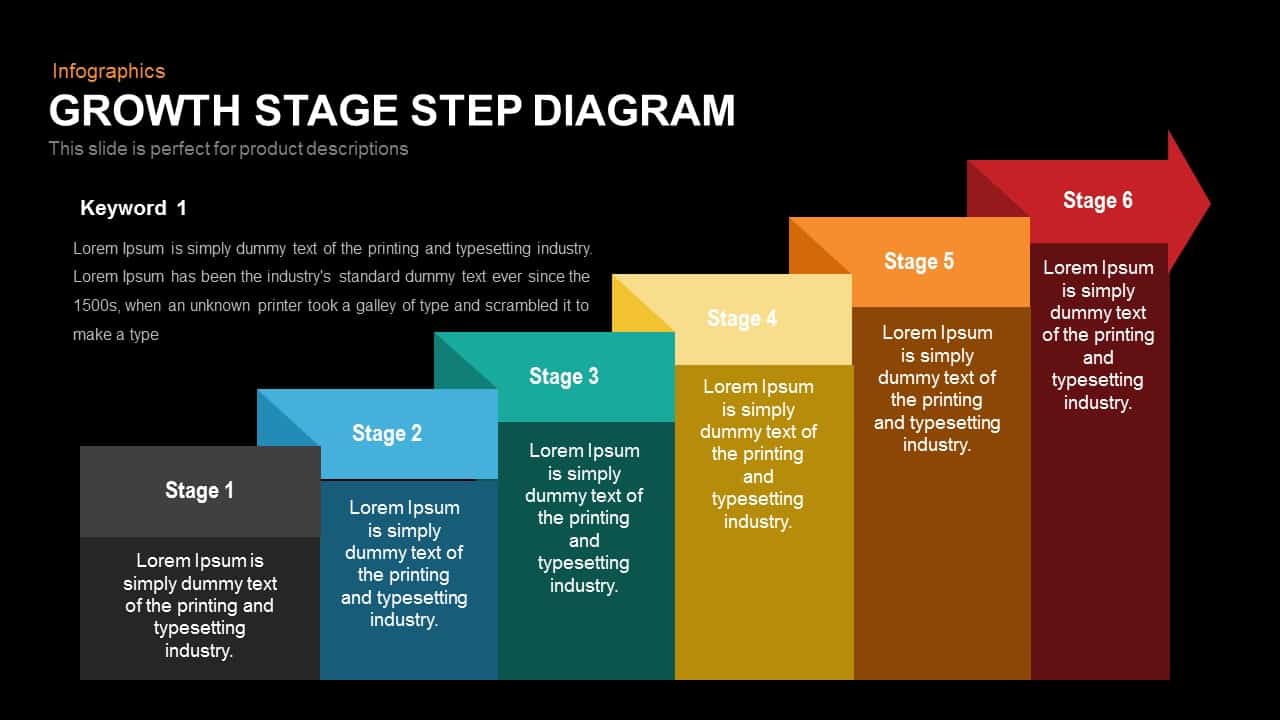
Growth Stage Diagram template for PowerPoint & Google Slides
Process
Five-Step Growth Stage Staircase Diagram Template for PowerPoint & Google Slides
Process

Modern Five-Step Growth Diagram Template for PowerPoint & Google Slides
Process

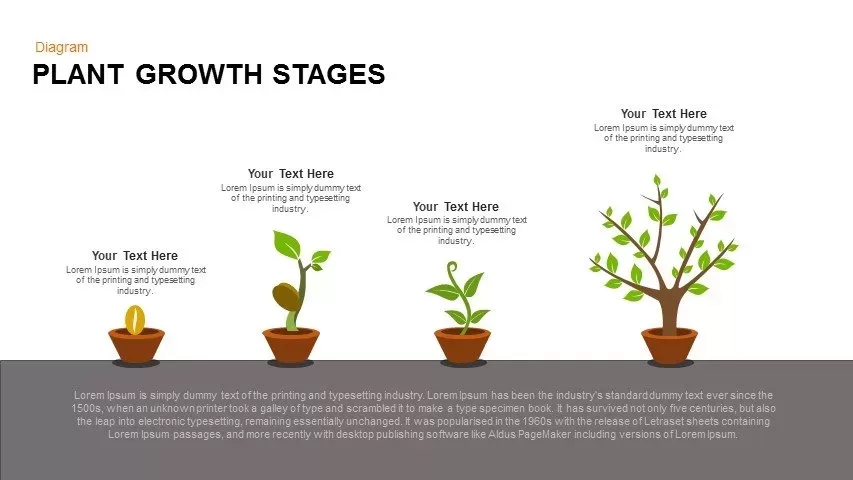
Editable Plant Growth Stages Diagram Template for PowerPoint & Google Slides
Process
Success and Growth Stair Arrow Diagram for PowerPoint & Google Slides
Process
4 Step Revenue Growth Flow Diagram Template for PowerPoint & Google Slides
Process
Greiner Growth Model Six-Phase Diagram Template for PowerPoint & Google Slides
Business Models

Ansoff Growth Matrix Strategy Diagram Template for PowerPoint & Google Slides
Business Strategy
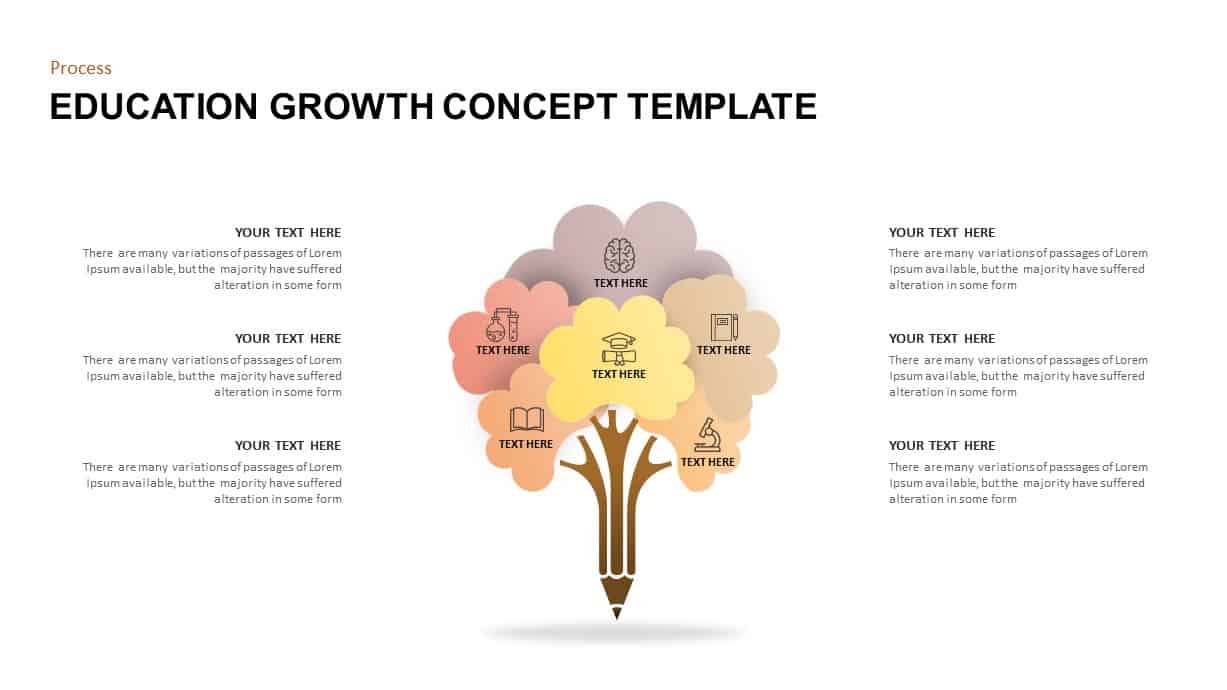
Education Growth Concept Diagram for PowerPoint & Google Slides
Process
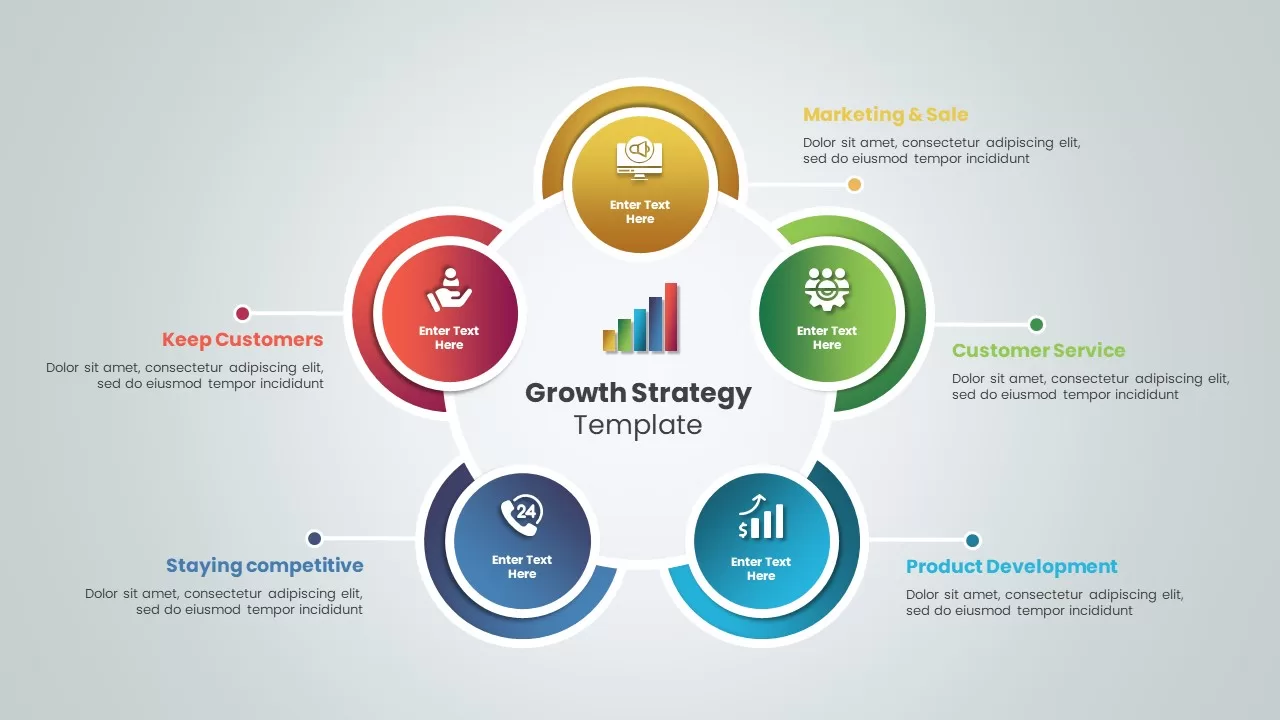
Growth Strategy Circular Diagram Template for PowerPoint & Google Slides
Circular
Growth vs Fixed Mindset Diagram Template for PowerPoint & Google Slides
Comparison
Three-Stage S Curve Growth Diagram Template for PowerPoint & Google Slides
Process
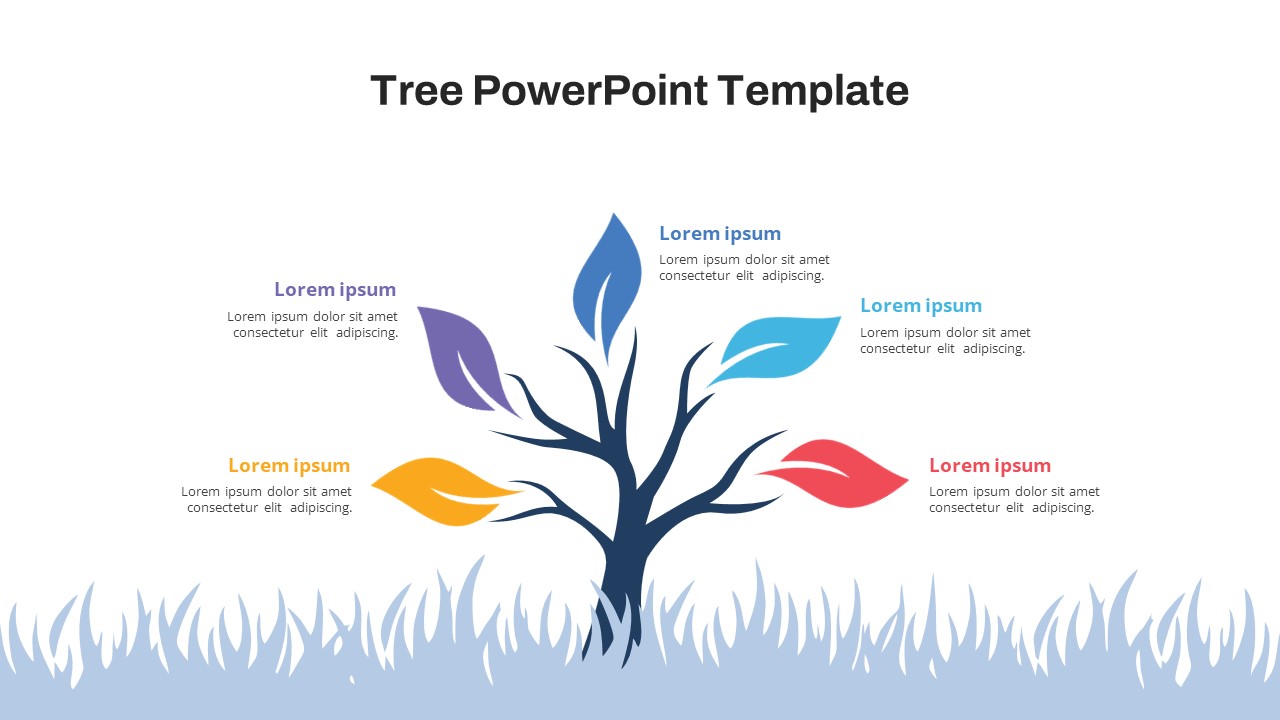
Free Colorful Tree Diagram for Growth & Strategy in PowerPoint & Google Slides
Infographics
Free
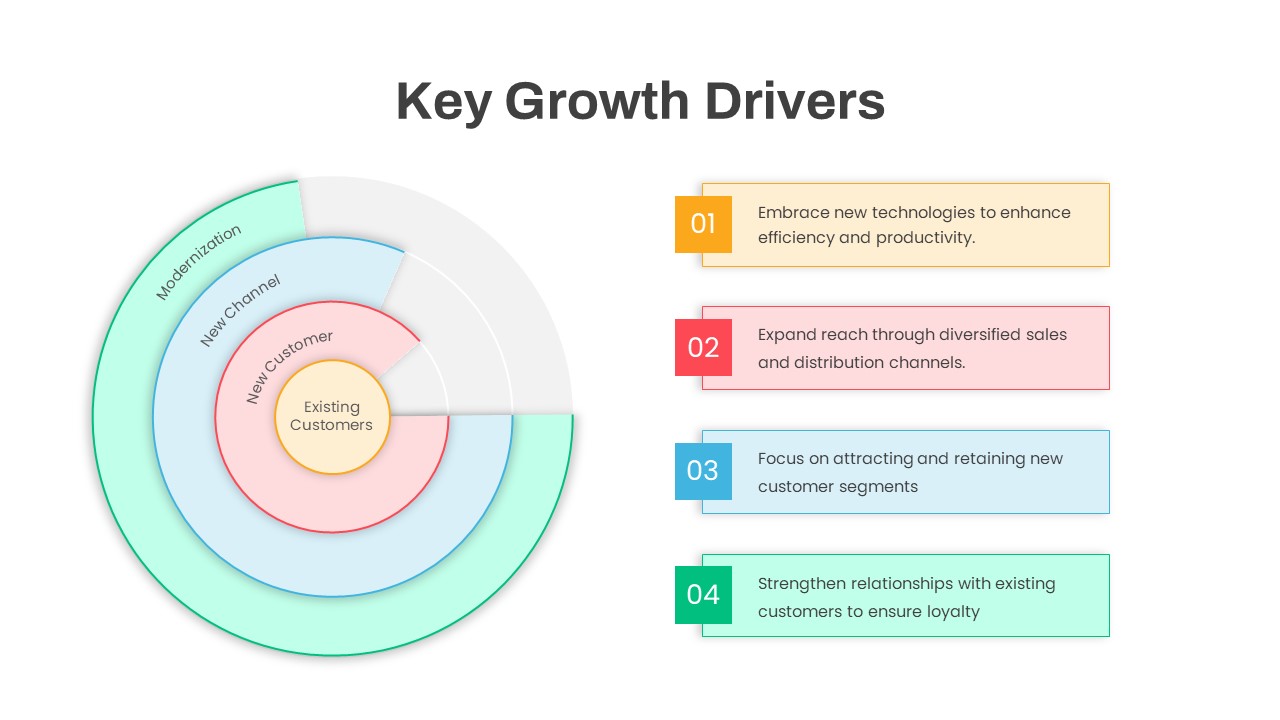
Circular Key Growth Drivers Diagram Template for PowerPoint & Google Slides
Circular
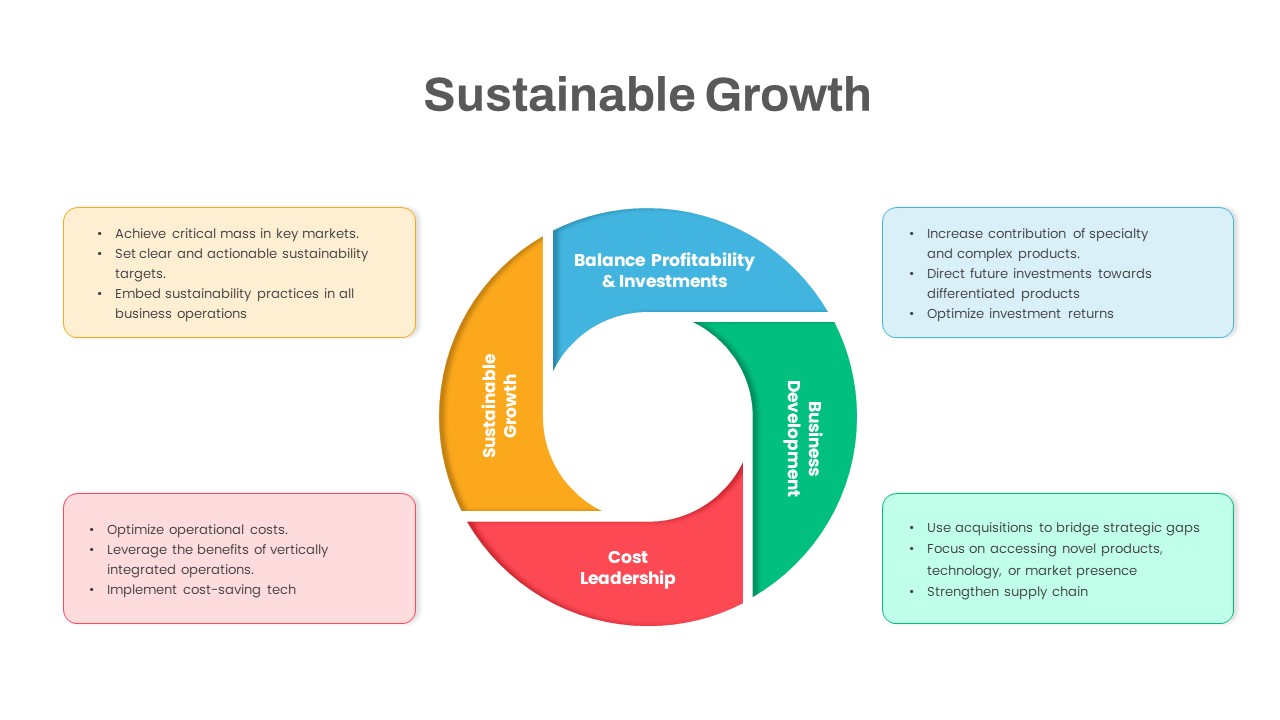
Sustainable Growth Circular Diagram Template for PowerPoint & Google Slides
Circular
Modern Growth Hacking Venn Diagram Template for PowerPoint & Google Slides
Circular
Flywheel Growth Cycle Diagram Template for PowerPoint & Google Slides
Circular
Growth Timeline template for PowerPoint & Google Slides
Timeline
Company Growth template for PowerPoint & Google Slides
Charts
Growth Infographics template for PowerPoint & Google Slides
Arrow
Modern Step Growth Infographics Template for PowerPoint & Google Slides
Process
Five 3D Growth Arrow Infographic Slide Template for PowerPoint & Google Slides
Arrow
5-Step Growth Staircase Infographic Template for PowerPoint & Google Slides
Process
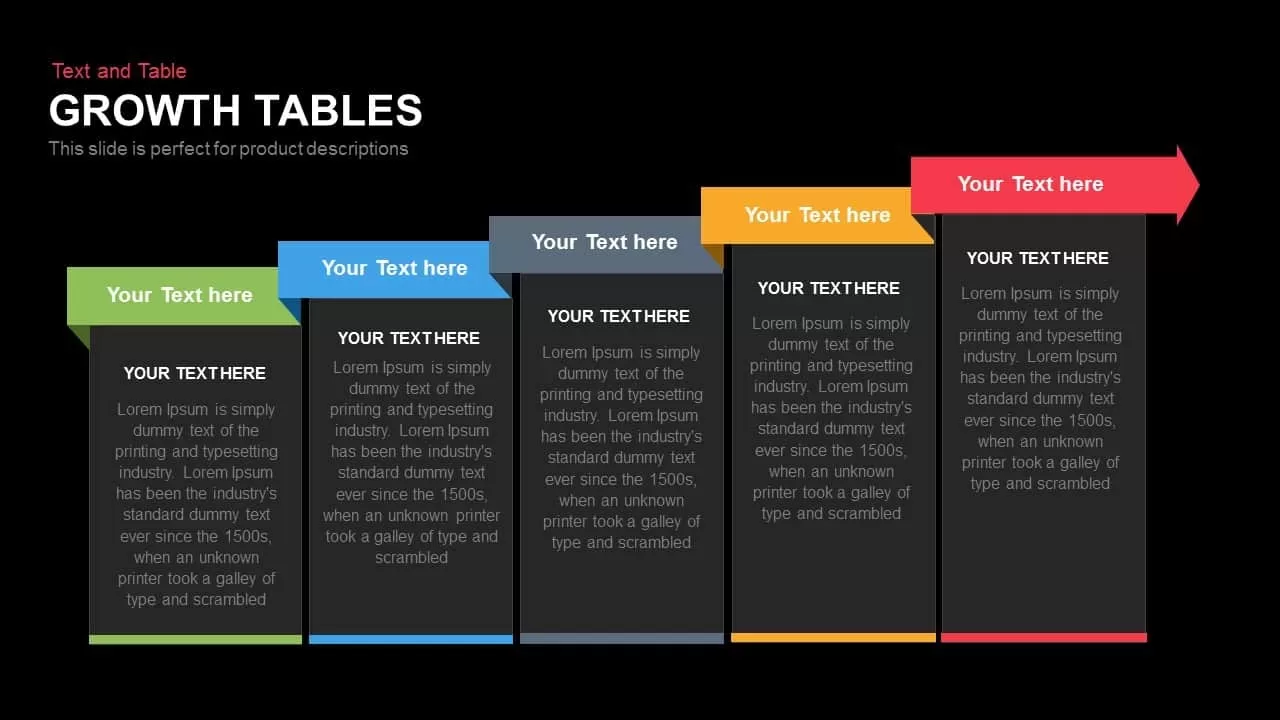
Growth Tables Slide template for PowerPoint & Google Slides
Process
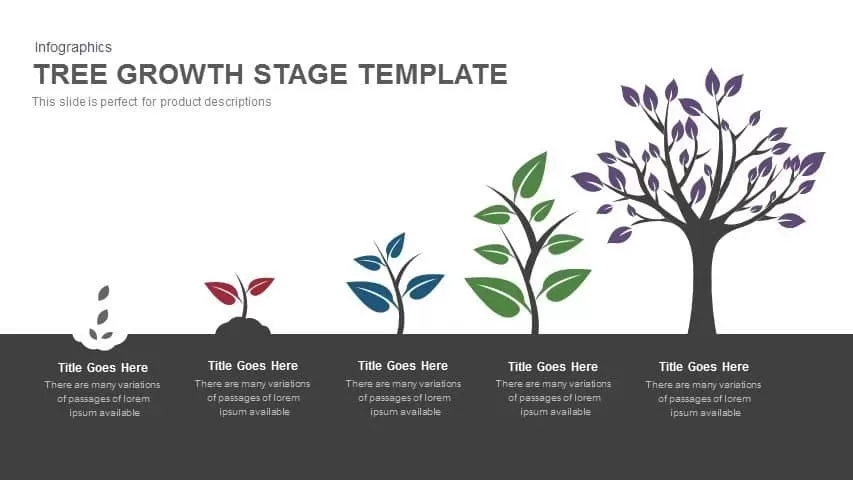
Tree Growth Stage Infographic Template for PowerPoint & Google Slides
Timeline
Improvement Growth Arrow Metaphor Template for PowerPoint & Google Slides
Bar/Column
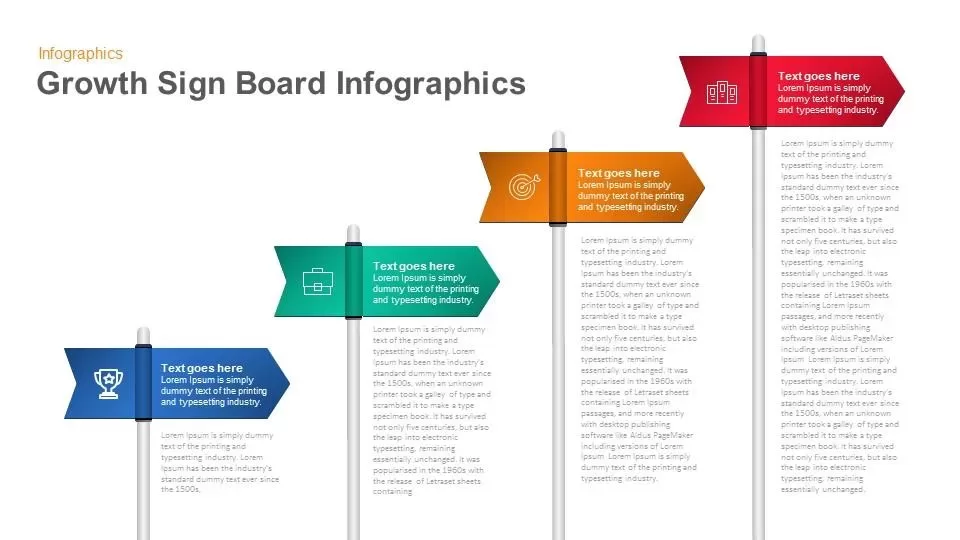
Growth Sign Board Infographics template for PowerPoint & Google Slides
Timeline
Five-Stage Growth Arrow Infographic Template for PowerPoint & Google Slides
Arrow
Ansoff Matrix Growth Strategy Model Template for PowerPoint & Google Slides
BCG
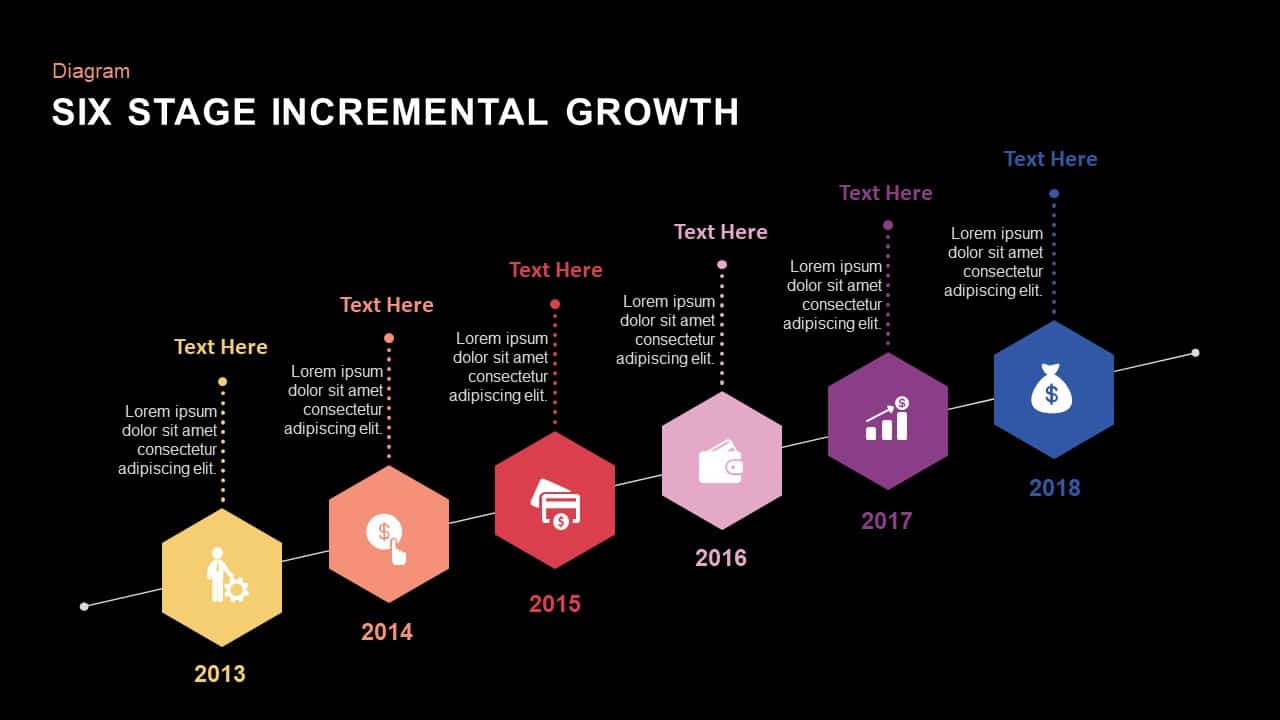
Six Stage Incremental Growth template for PowerPoint & Google Slides
Timeline
Growth Plant Infographics template for PowerPoint & Google Slides
Process
Dynamic Growth Arrow Step Infographic Template for PowerPoint & Google Slides
Process
Plant Growth Lifecycle Infographic Template for PowerPoint & Google Slides
Process
Five-Step Growth Infographic Slide Template for PowerPoint & Google Slides
Process
4-Step Growth & Success Infographics Template for PowerPoint & Google Slides
Accomplishment
5-Step Growth Arrow Infographics Template for PowerPoint & Google Slides
Arrow
Five-Step Growth Timeline Infographic Template for PowerPoint & Google Slides
Timeline
Sales Growth Dashboard: KPI Gauge & Line Template for PowerPoint & Google Slides
Revenue
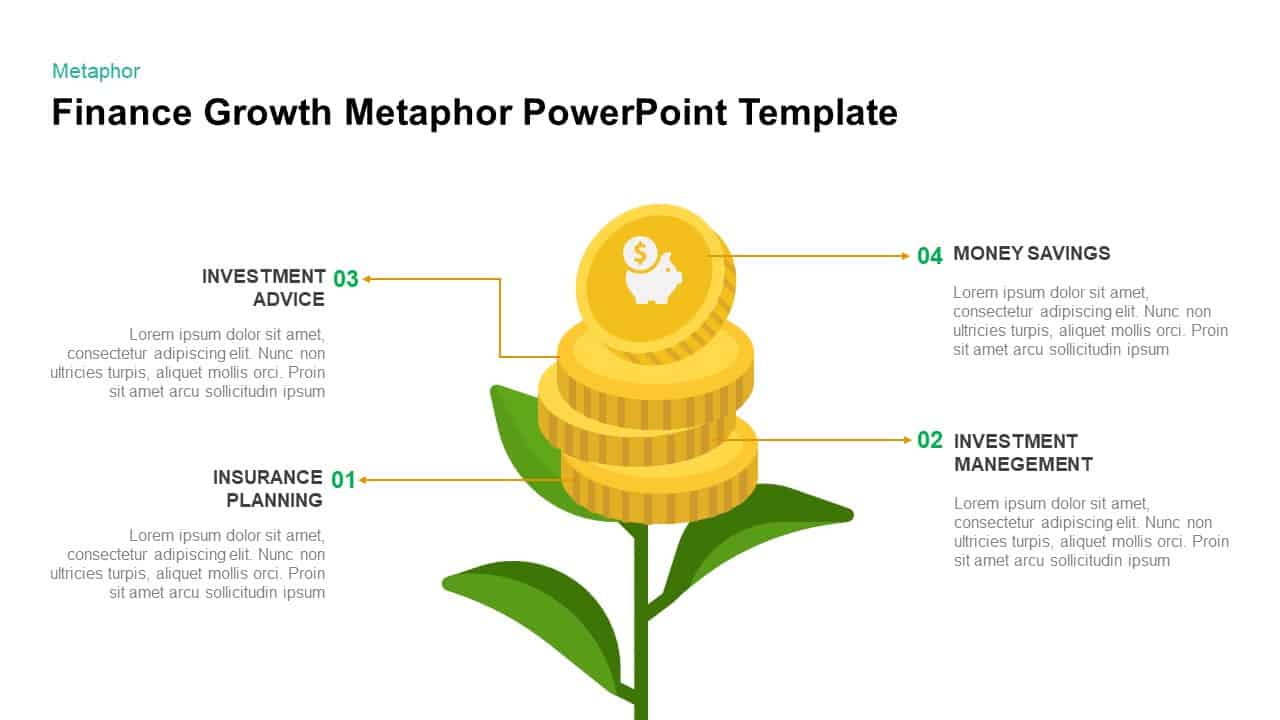
Finance Growth Plant Metaphor Slide Template for PowerPoint & Google Slides
Finance
5-Stage Financial Growth Timeline Template for PowerPoint & Google Slides
Timeline
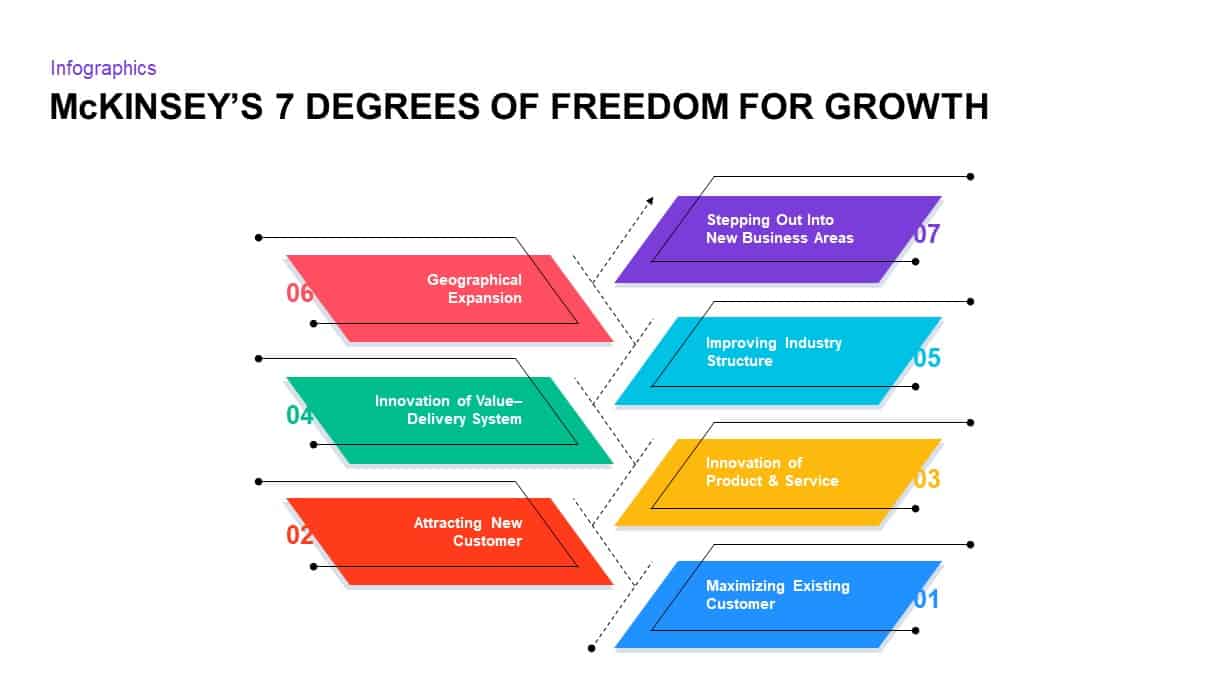
McKinsey’s 7 Degrees of Freedom Growth Template for PowerPoint & Google Slides
Process
Greiner’s Growth Model Curve template for PowerPoint & Google Slides
Infographics
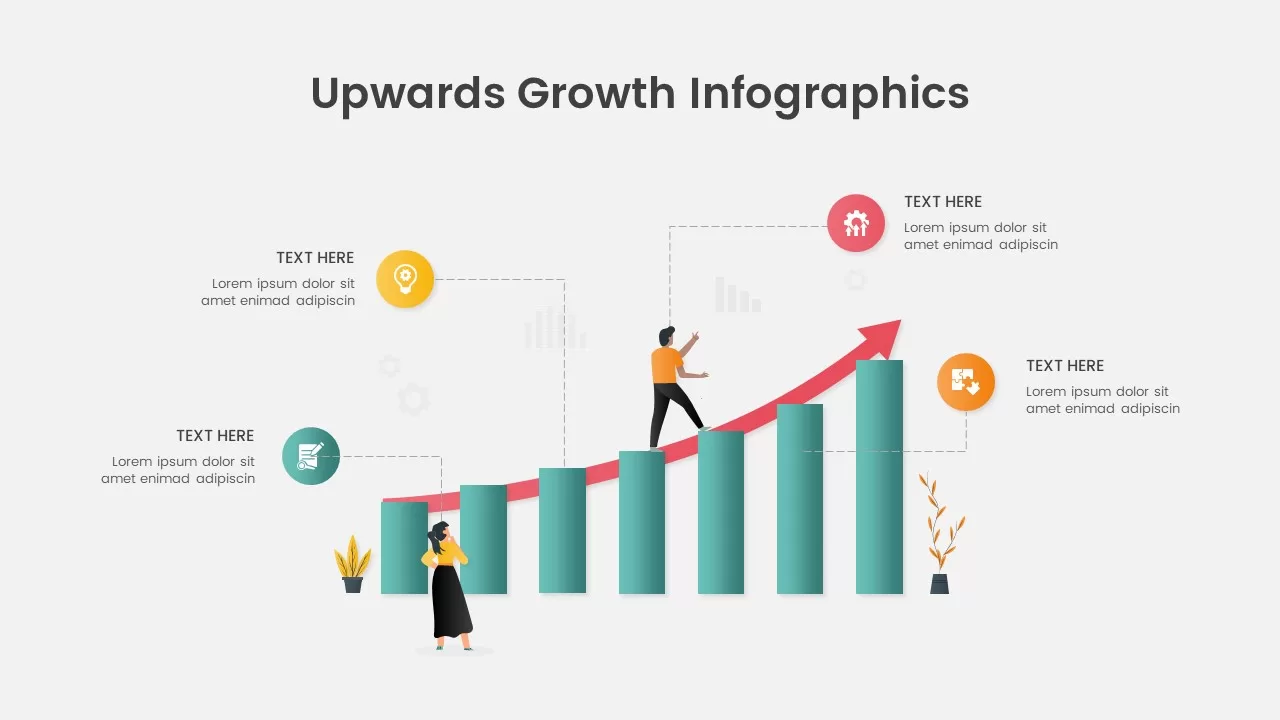
Upwards Growth Infographics for PowerPoint & Google Slides
Infographics
Data-driven GDP Growth Infographic Pack Template for PowerPoint & Google Slides
Infographics
3D Curved Arrow Growth Process Slide Template for PowerPoint & Google Slides
Process
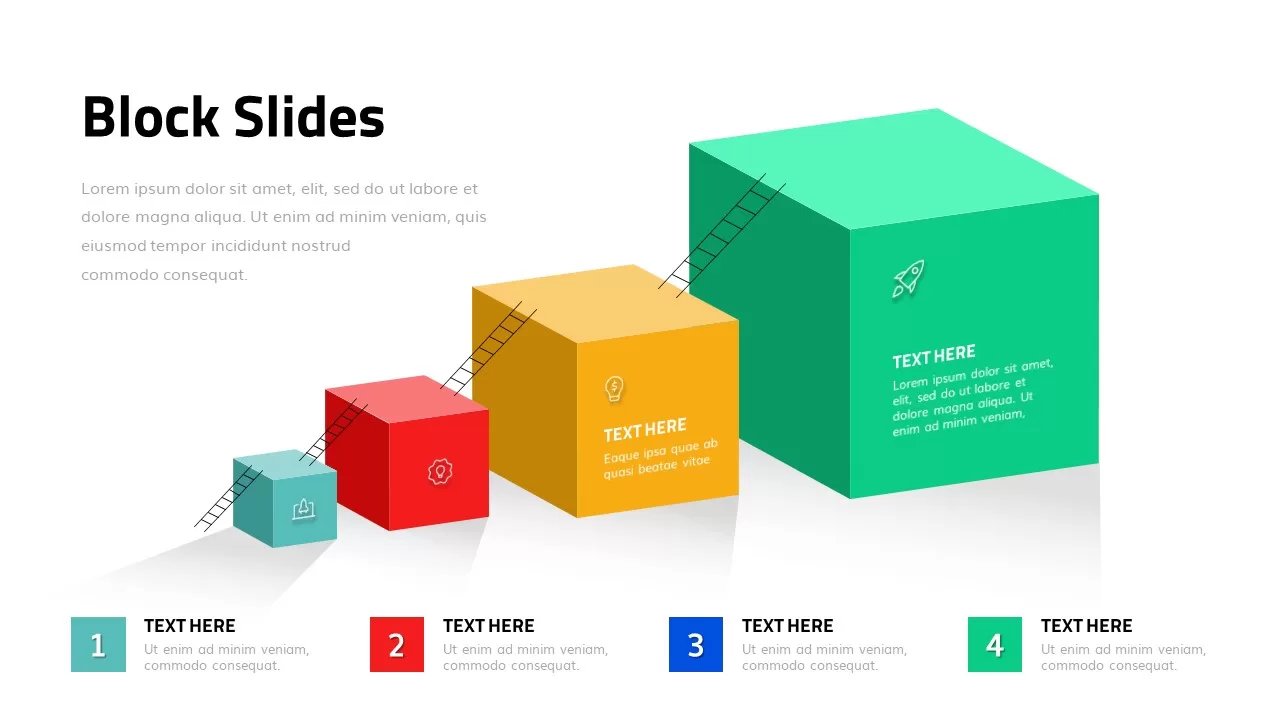
3D Growth Blocks Template for PowerPoint & Google Slides
Process
Growth Mindset Illustration Template for PowerPoint & Google Slides
Goals
Abraham Maslow Growth Quote Slide Template for PowerPoint & Google Slides
Vision and Mission
Growth Curve Line Chart Visualization Template for PowerPoint & Google Slides
Charts
Dynamic Investment & Finance Growth Template for PowerPoint & Google Slides
Finance
Annual Growth Trend Analysis Chart template for PowerPoint & Google Slides
Business Report
Hub and Spoke Growth Framework Template for PowerPoint & Google Slides
Circular

Quarterly Net Interest Income Growth Template for PowerPoint & Google Slides
Bar/Column
Fixed vs Growth Mindset Matrix Template for PowerPoint & Google Slides
Comparison
Comprehensive Growth Strategy Cards Template for PowerPoint & Google Slides
Infographics
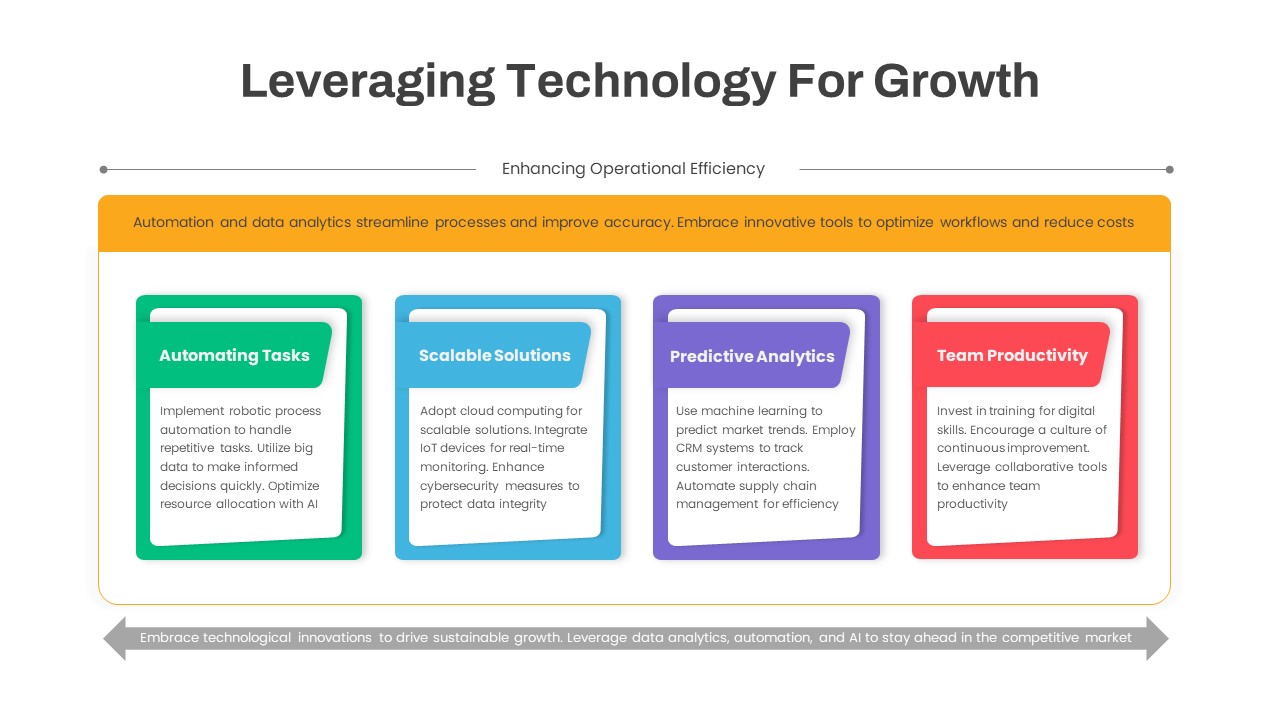
Leveraging Technology for Growth Slide Template for PowerPoint & Google Slides
Information Technology
Ansoff Growth Matrix Professional Template for PowerPoint & Google Slides
Comparison
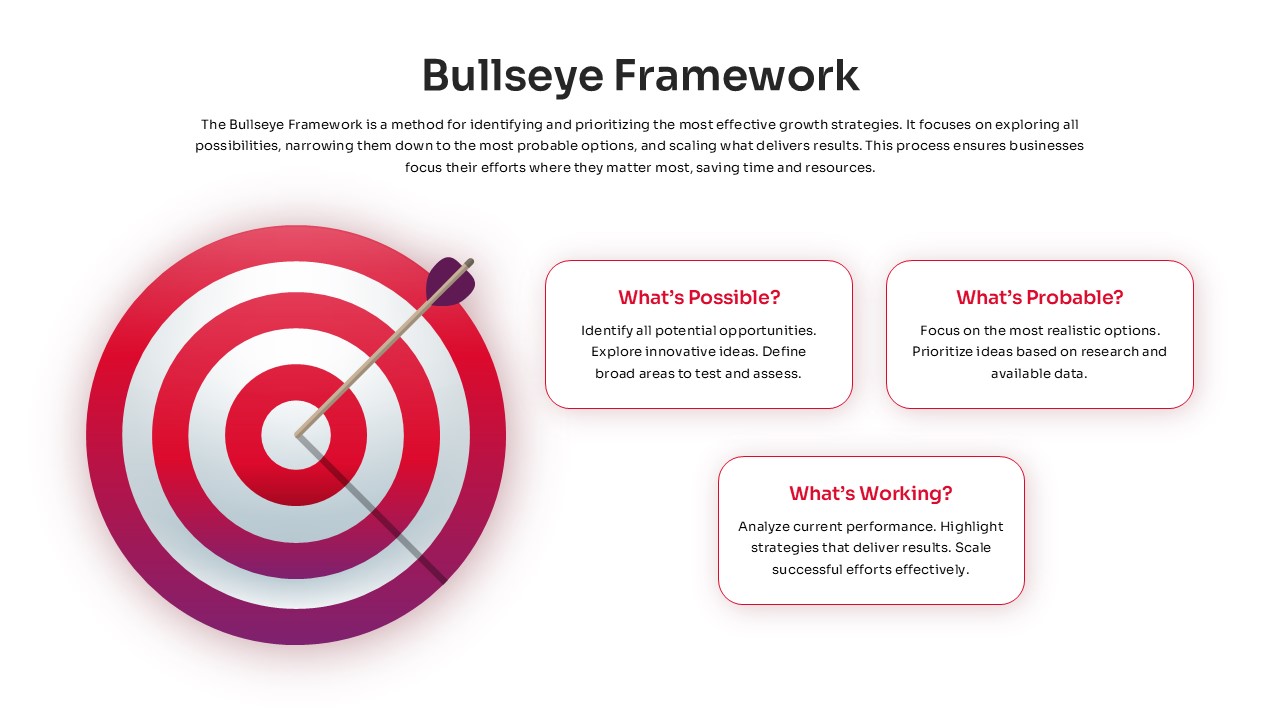
Bullseye Framework Growth Strategy Template for PowerPoint & Google Slides
Business Strategy
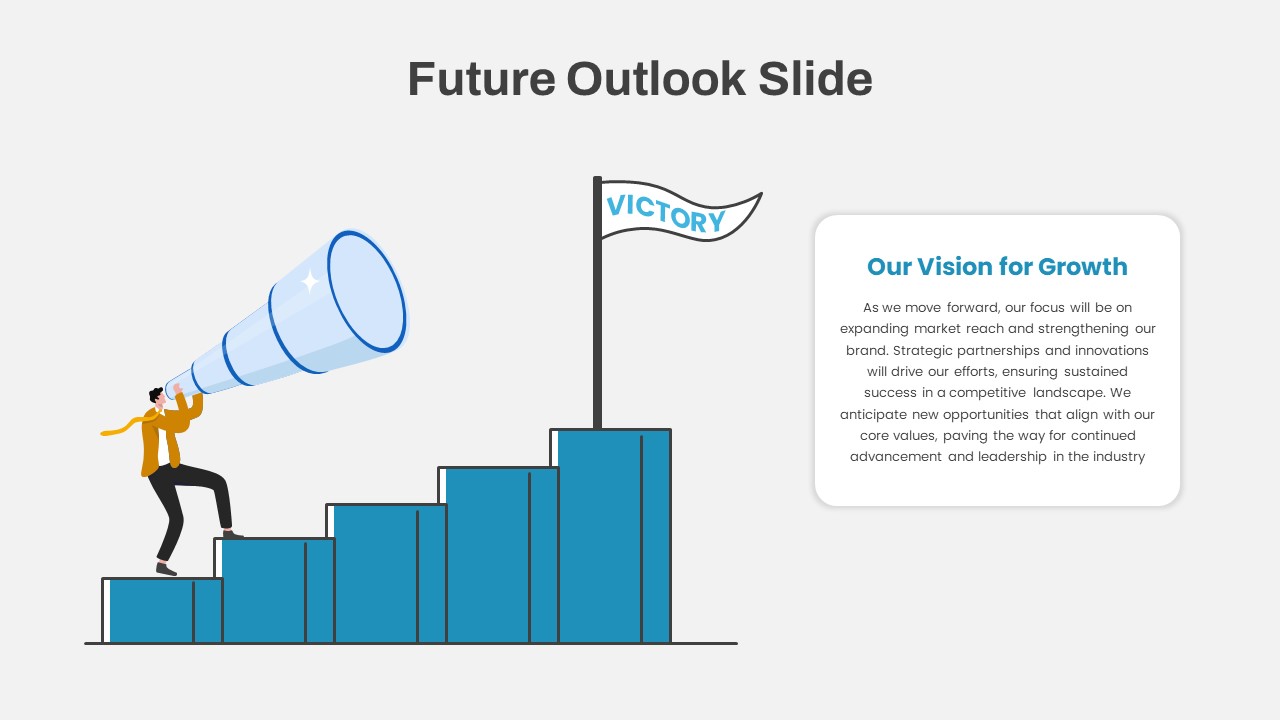
Future Outlook and Growth Strategy Slide Template for PowerPoint & Google Slides
Infographics
Sales Growth Comparison Chart & Table Template for PowerPoint & Google Slides
Bar/Column
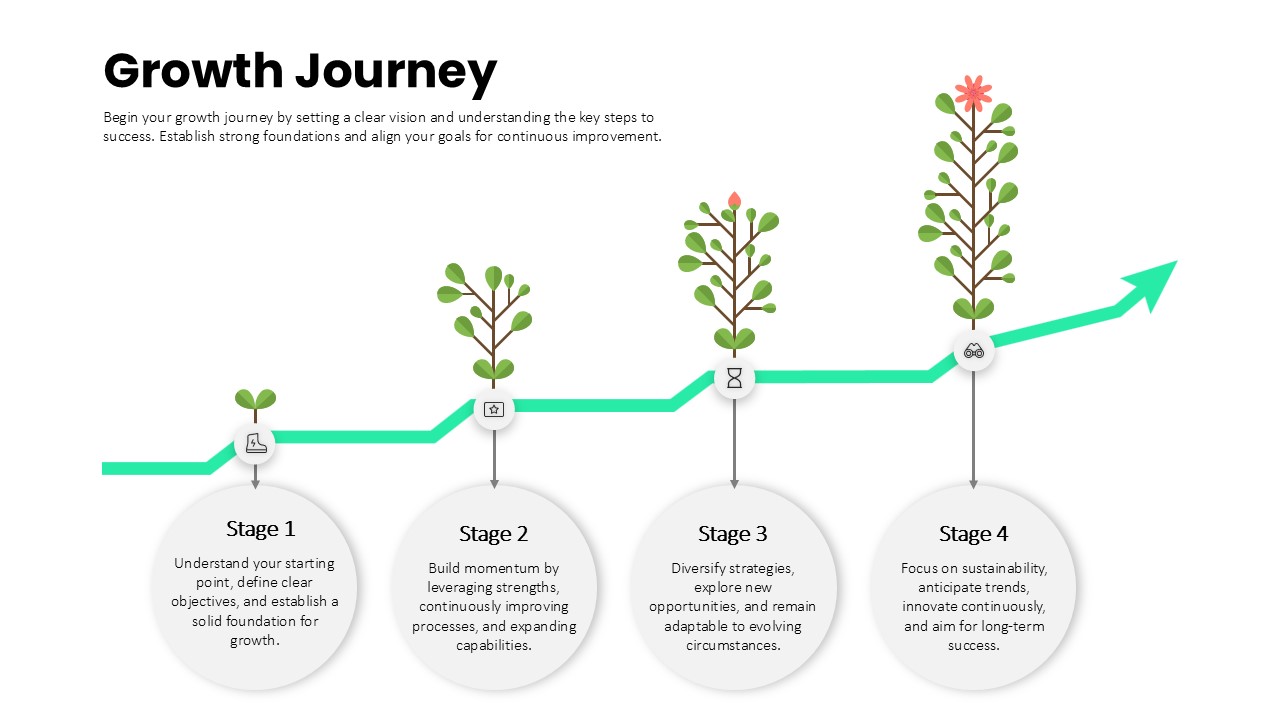
Growth Journey Stages Process template for PowerPoint & Google Slides
Business Strategy
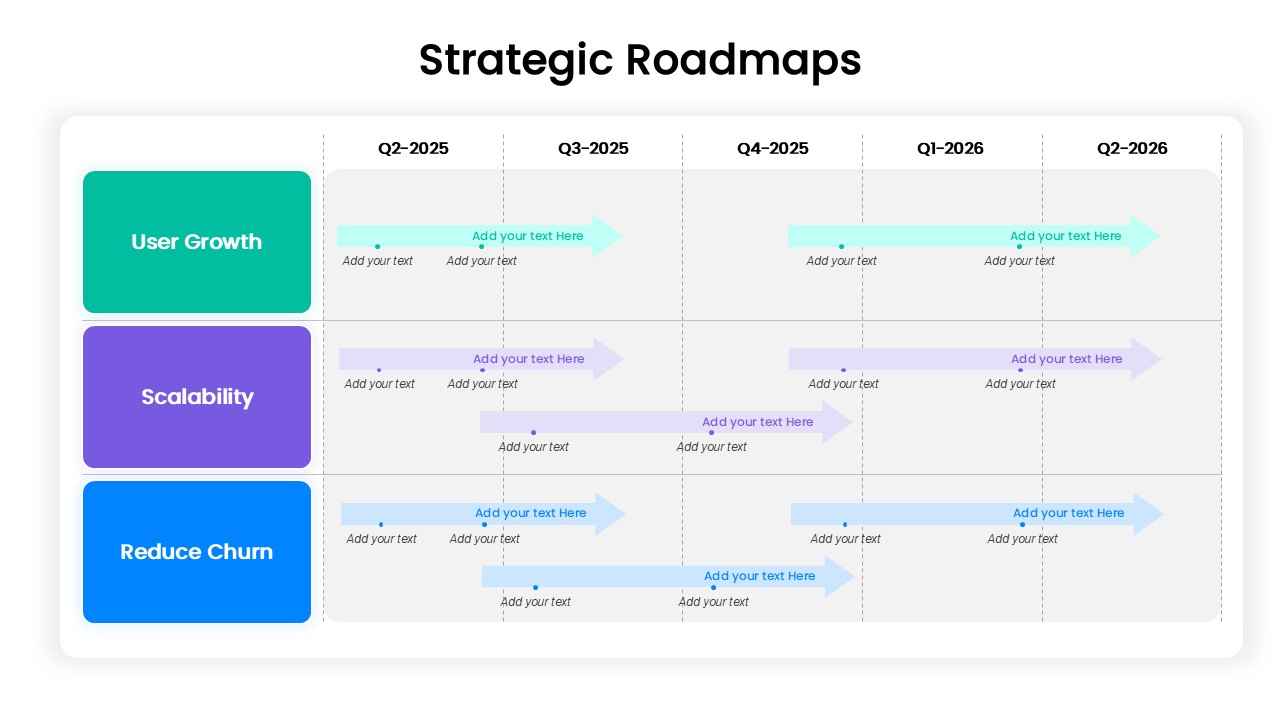
Strategic Roadmap for User Growth, Scalability, and Reducing Churn template for PowerPoint & Google Slides
Business
Personal Growth Overview Template for PowerPoint & Google Slides
Business
Ansoff Growth Matrix Template for PowerPoint & Google Slides
Business Strategy
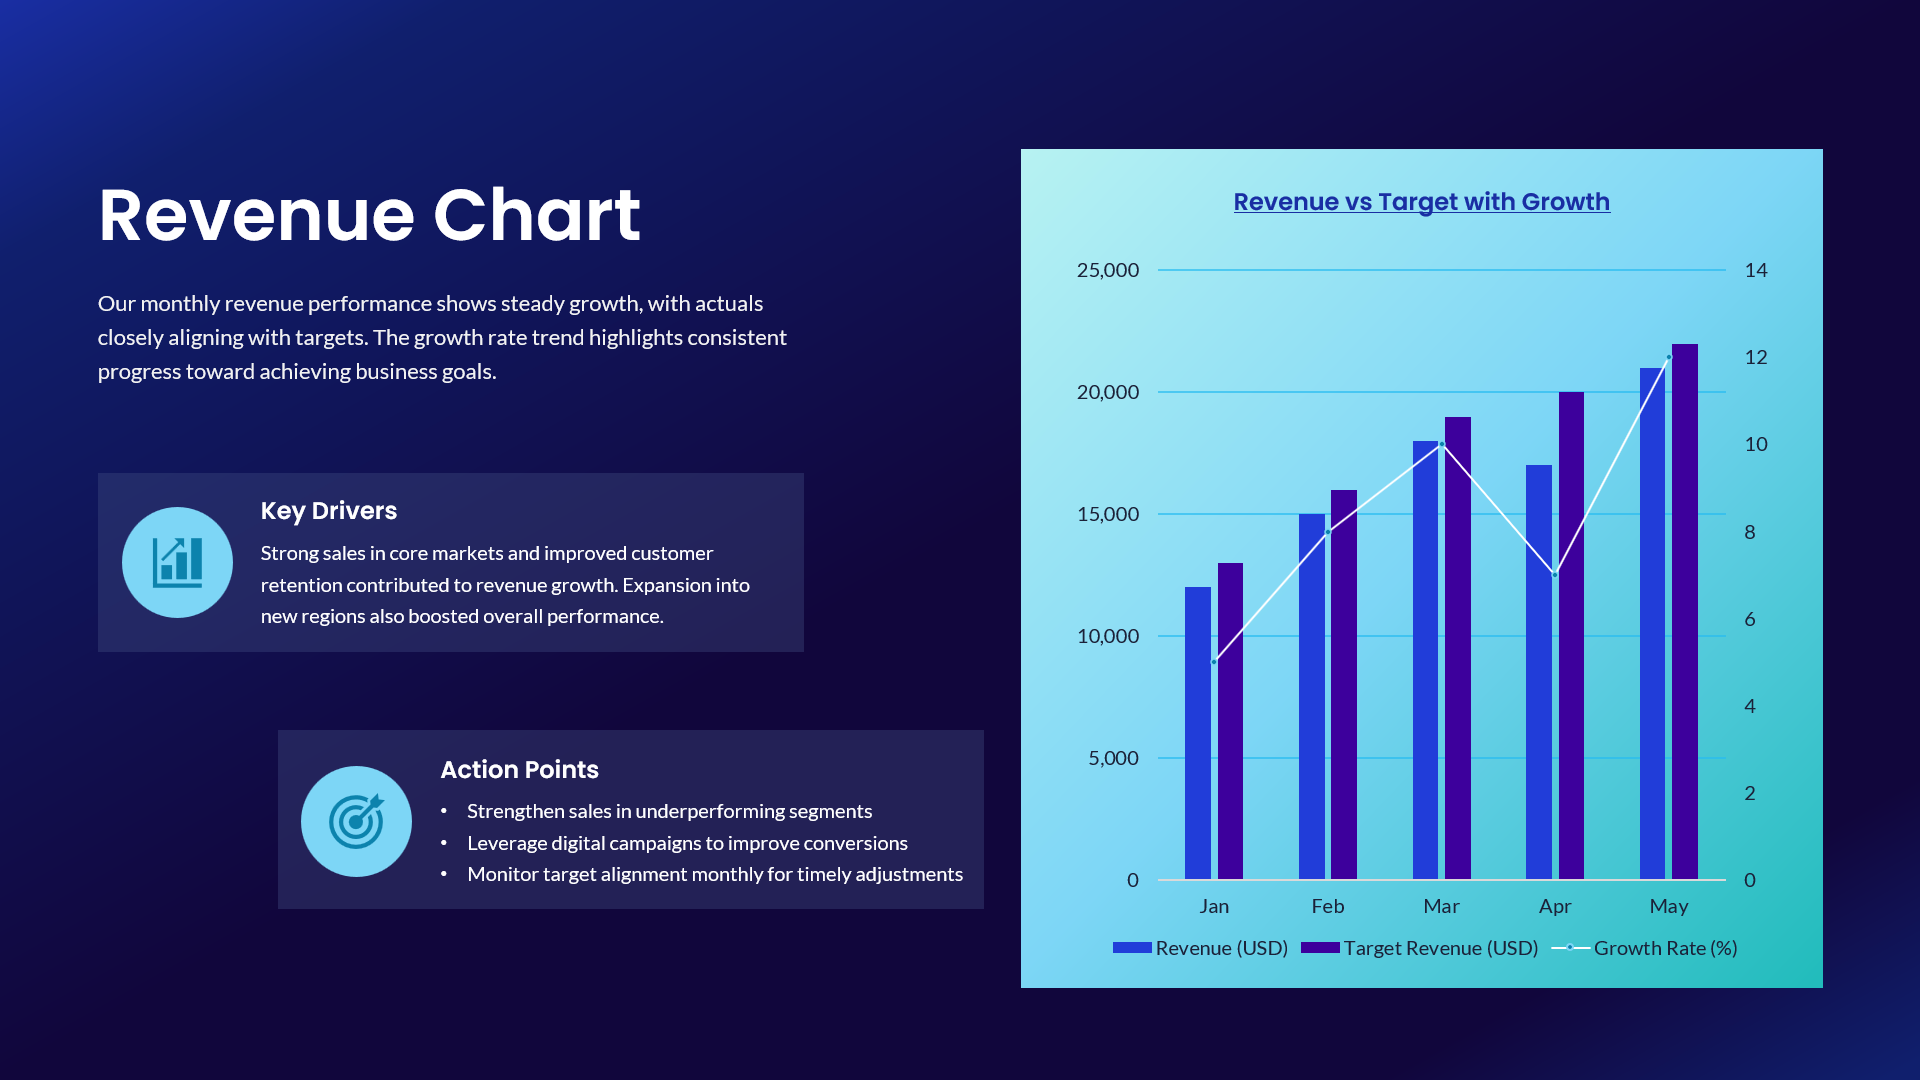
Revenue vs Target Growth Chart Template for PowerPoint & Google Slides
Revenue
Four-Step Business Staircase Diagram template for PowerPoint & Google Slides
Process
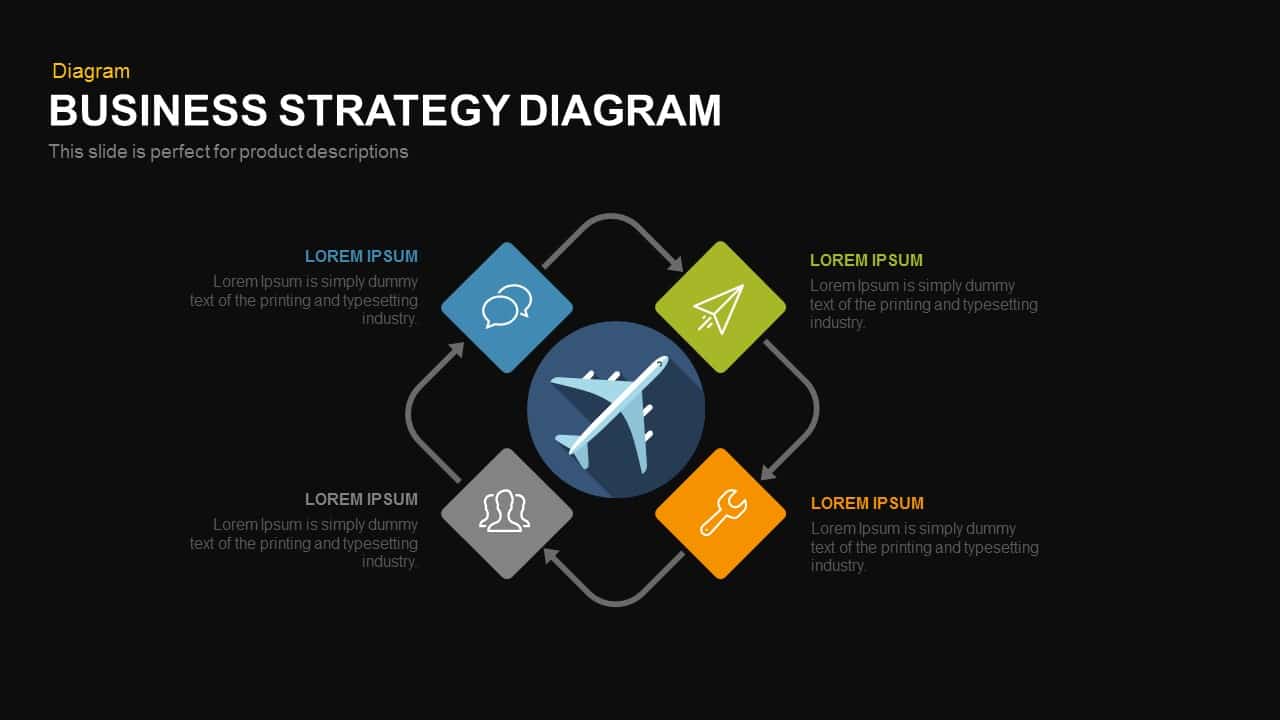
Strategic Business Diamond Diagram Template for PowerPoint & Google Slides
Business Strategy
Vertical Business Process Flow Diagram Template for PowerPoint & Google Slides
Process
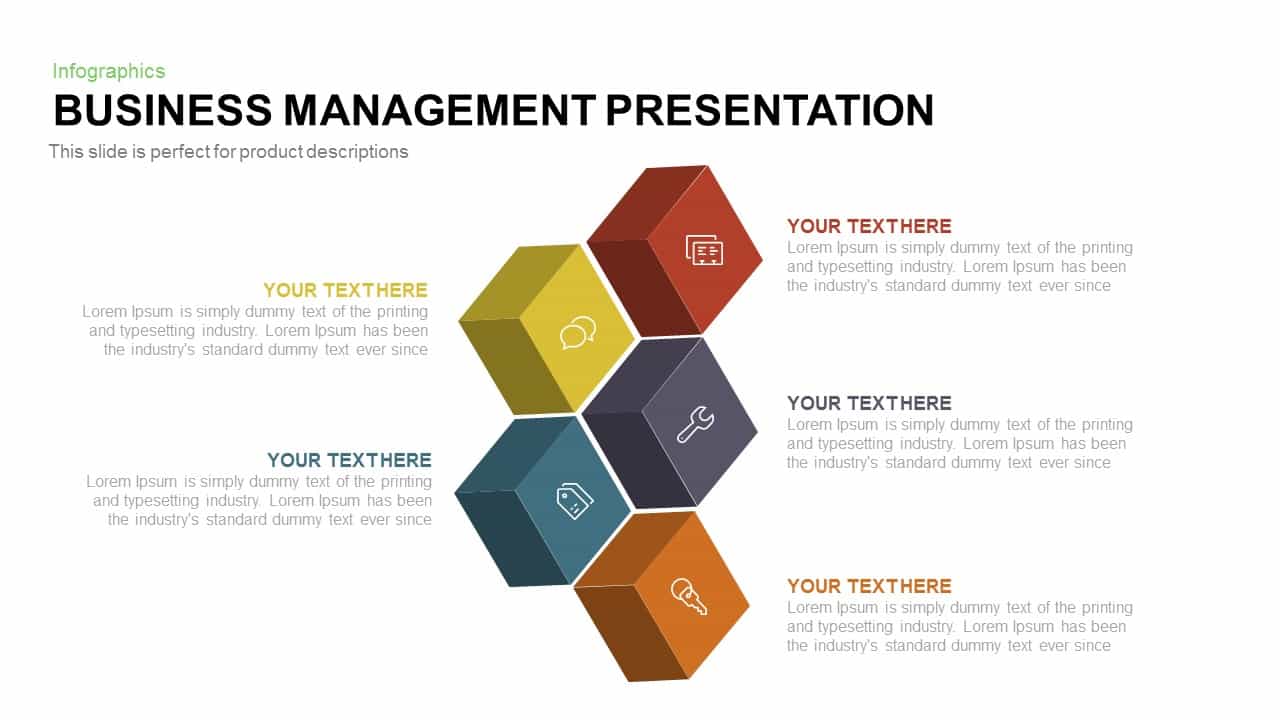
Business Management Hexagon Diagram Template for PowerPoint & Google Slides
Comparison

Four-Staged Business Arrow Diagram Template for PowerPoint & Google Slides
Process
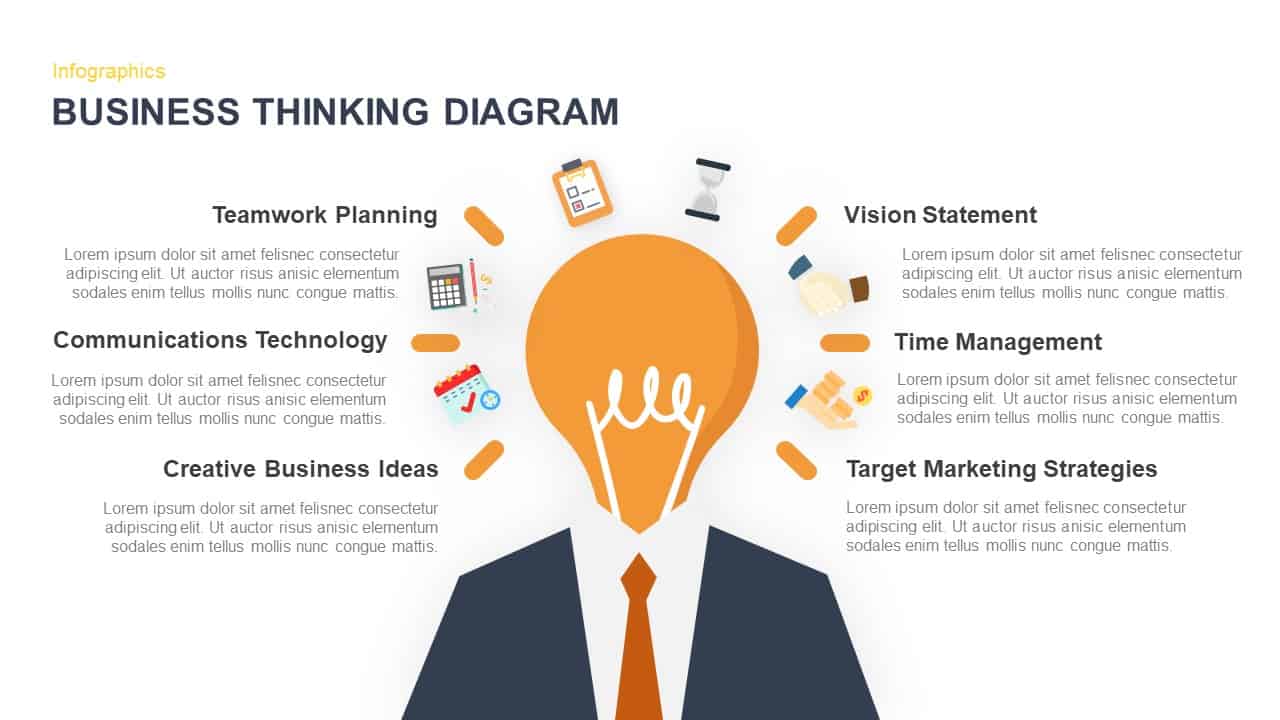
Business Thinking Concept Diagram Template for PowerPoint & Google Slides
Business Strategy
Business Services Infographic Diagram Template for PowerPoint & Google Slides
Infographics
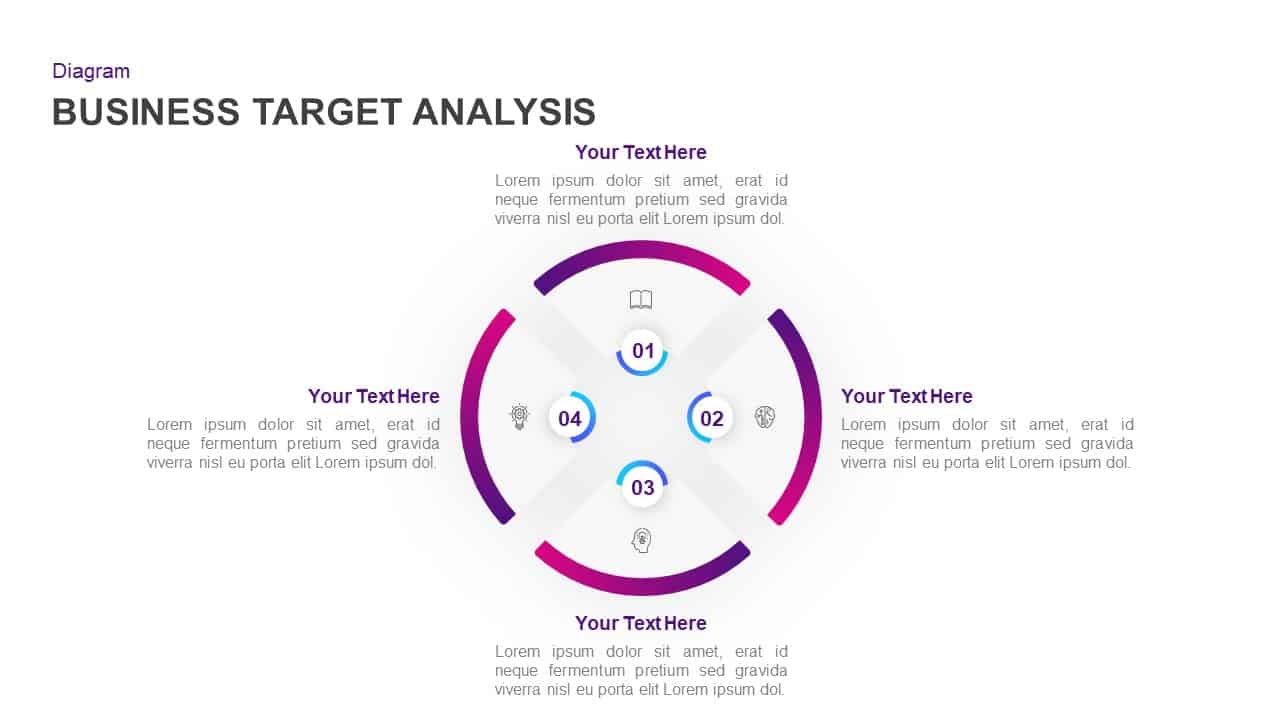
Business Target Analysis Diagram Template for PowerPoint & Google Slides
Circular
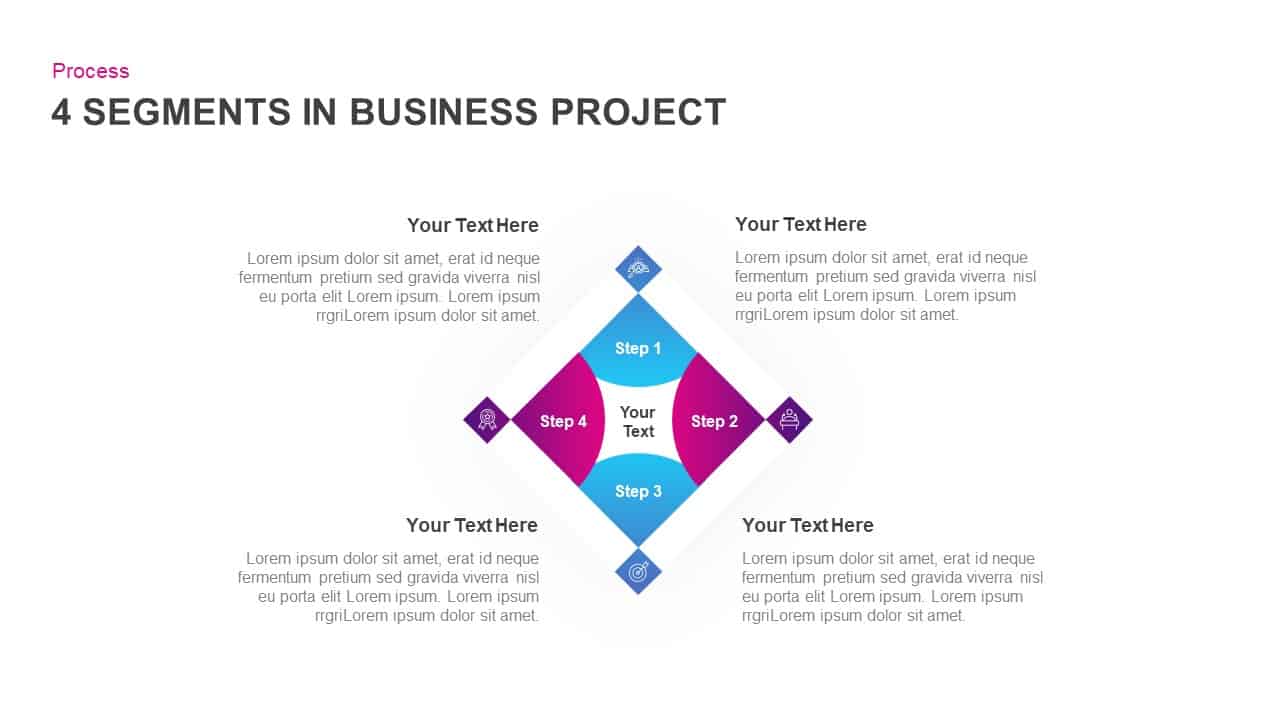
4-Segment Business Project Diamond Diagram Template for PowerPoint & Google Slides
Process
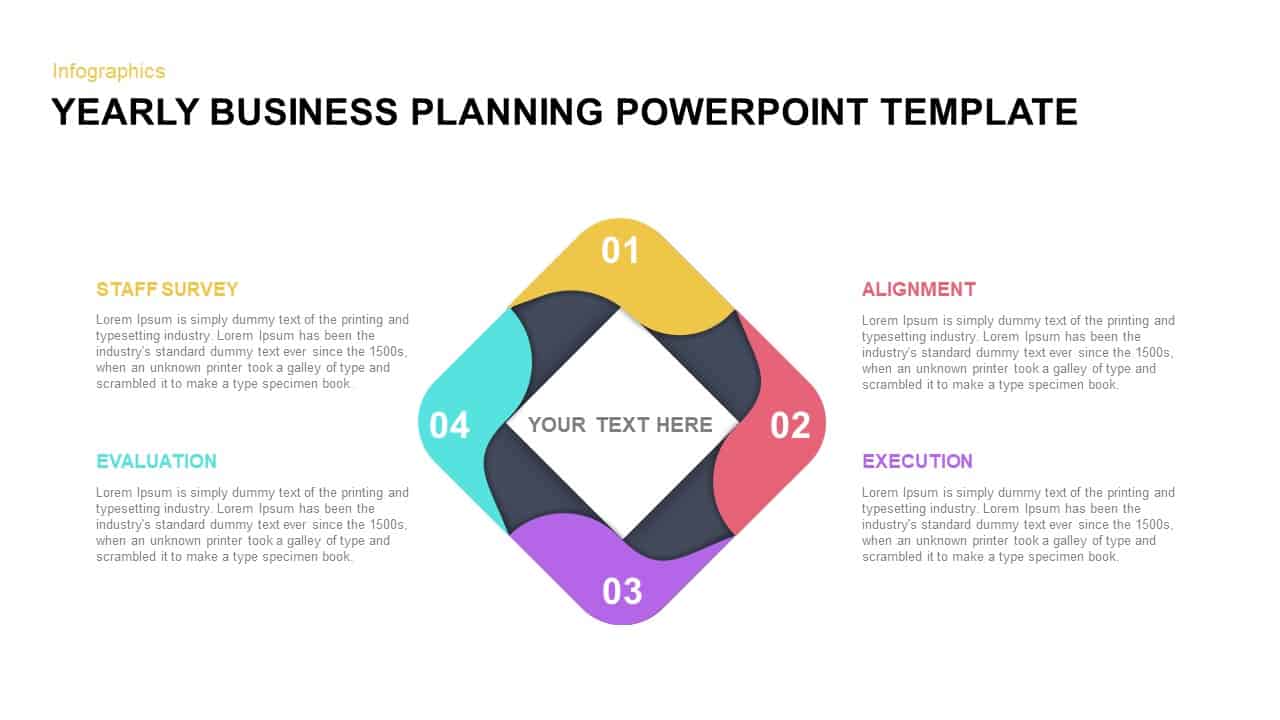
Yearly Business Planning Diamond Diagram Template for PowerPoint & Google Slides
Process
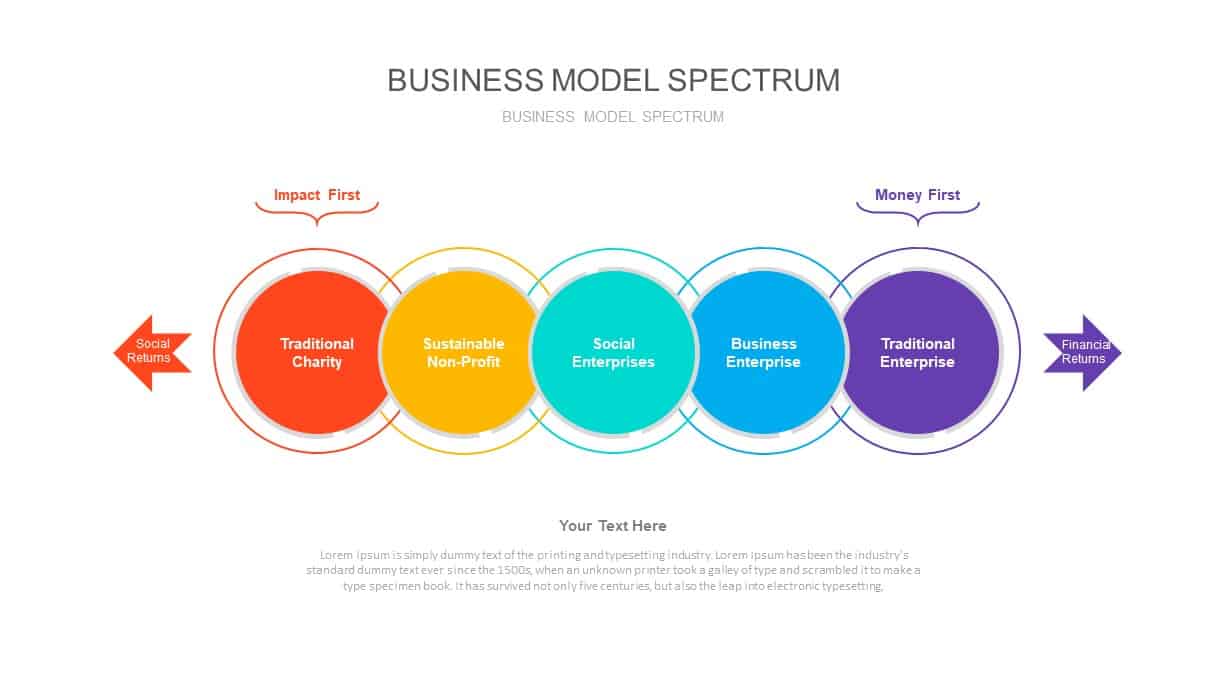
Business Model Spectrum Diagram Pack for PowerPoint & Google Slides
Business Models
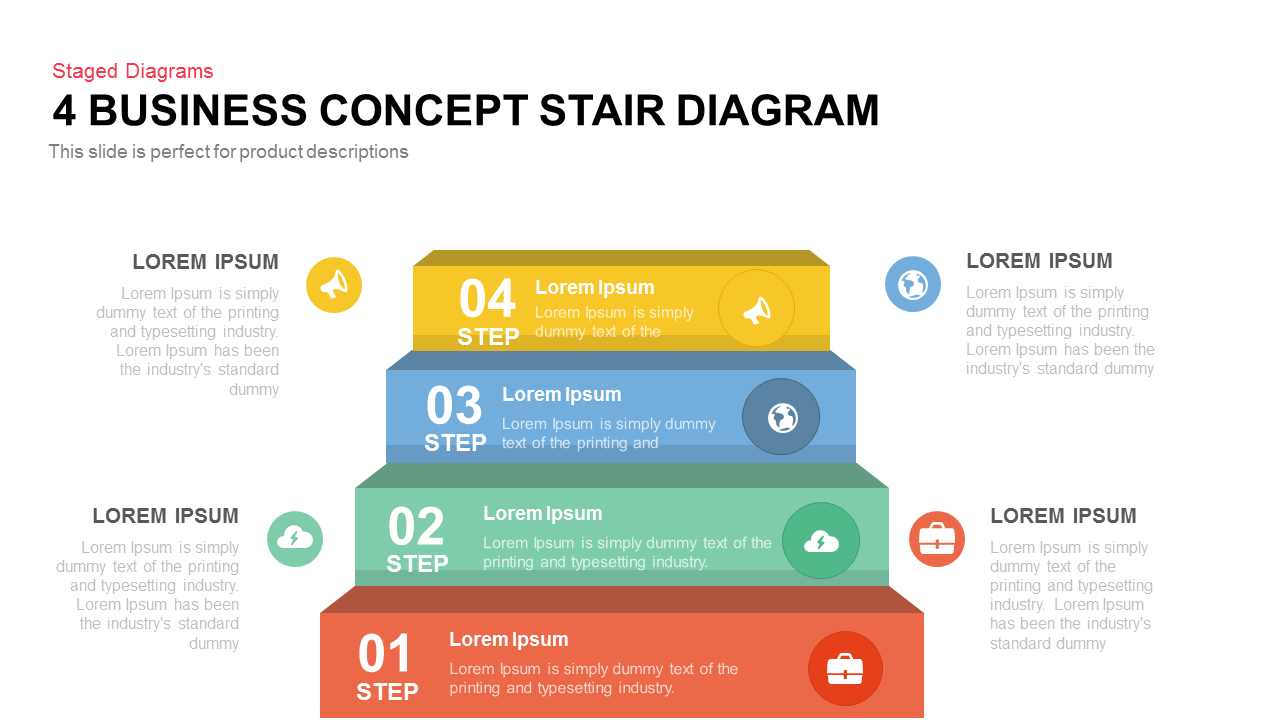
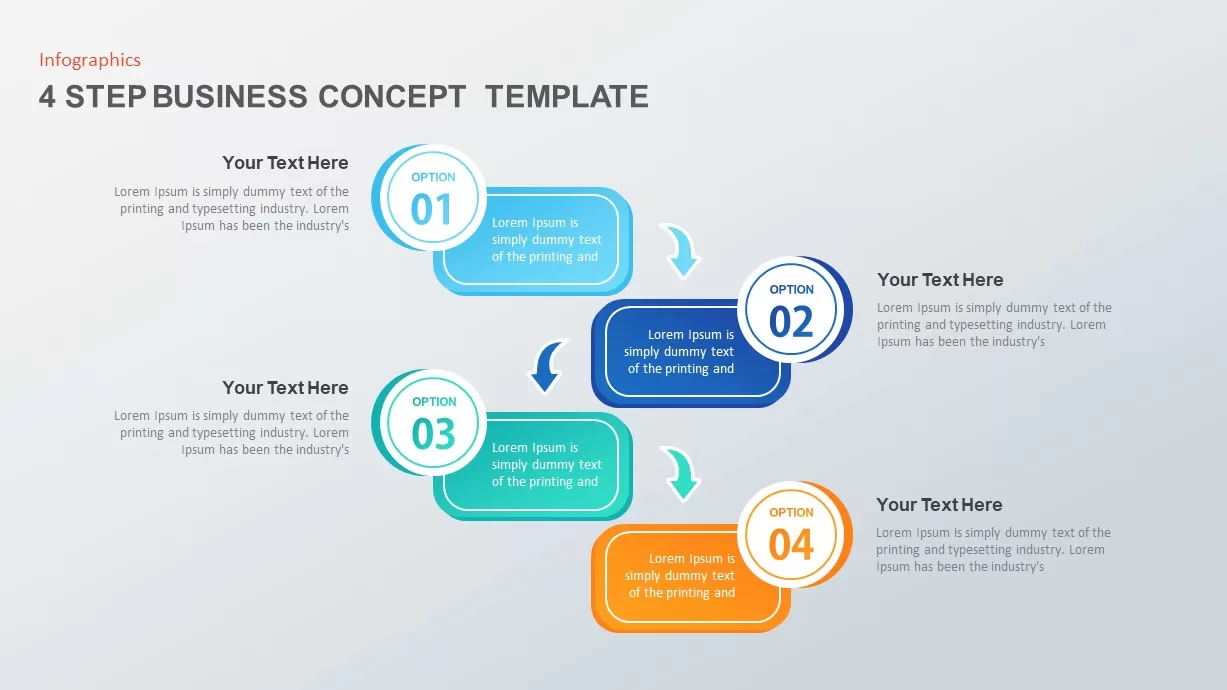
4 Step Business Concept Diagram Template for PowerPoint & Google Slides
Business
4 Business Data Infographics Diagram for PowerPoint & Google Slides
Process
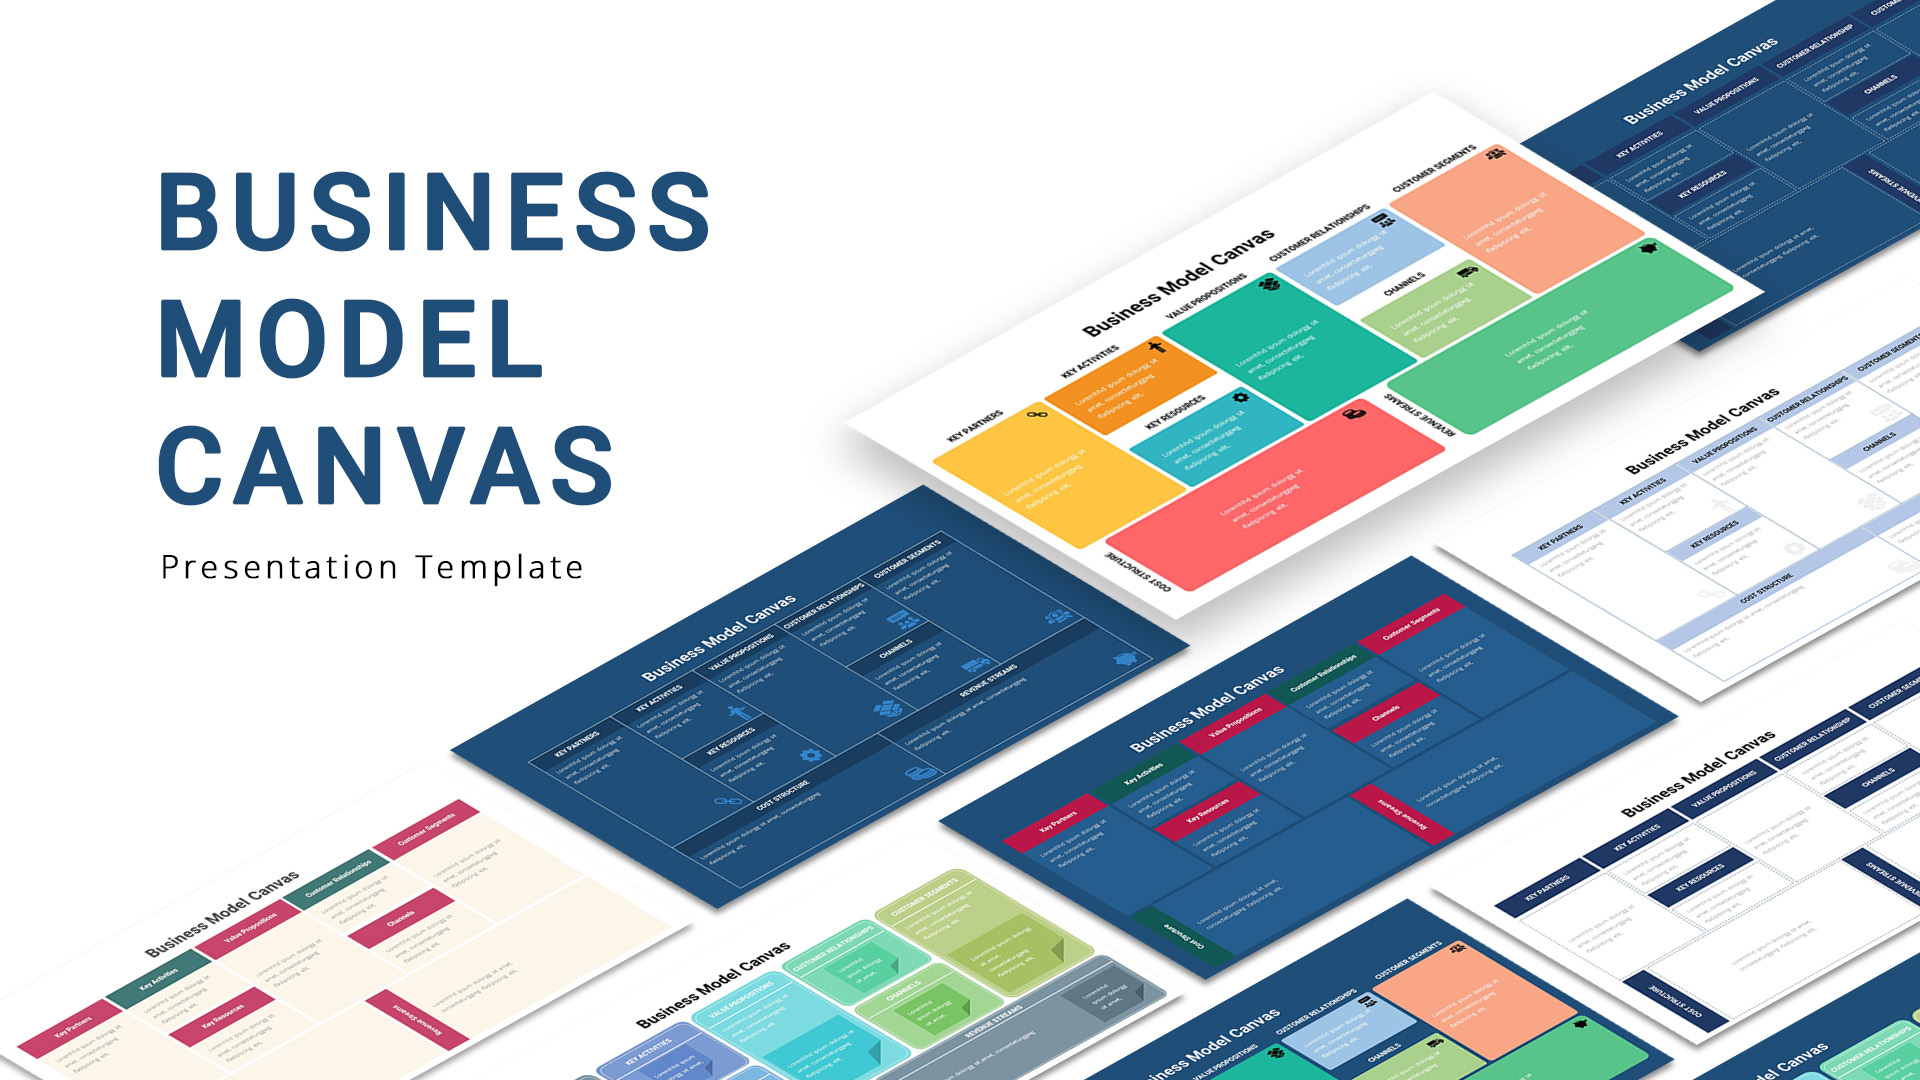
Business Model Canvas Diagram Template for PowerPoint & Google Slides
Business Models
Business Strategy House Model Diagram Template for PowerPoint & Google Slides
Business Strategy
Six-Step Business Analysis Diagram template for PowerPoint & Google Slides
Circular
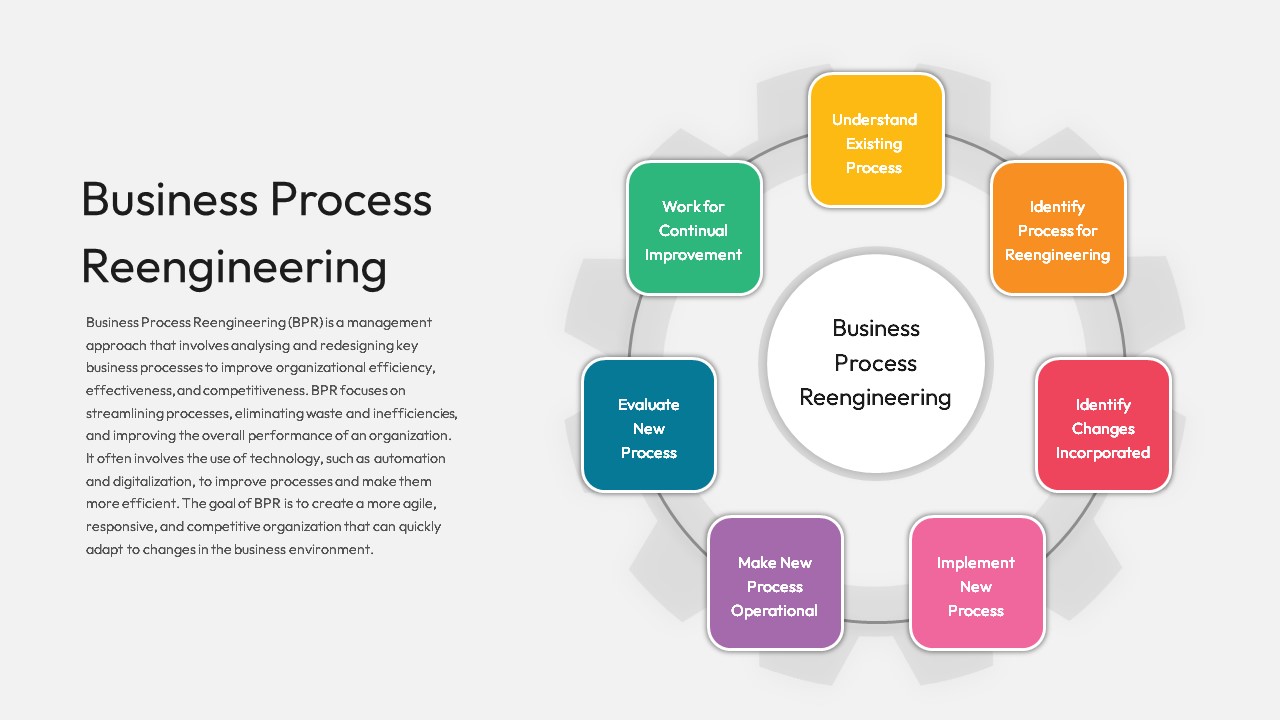
Business Process Reengineering Diagram Template for PowerPoint & Google Slides
Circular
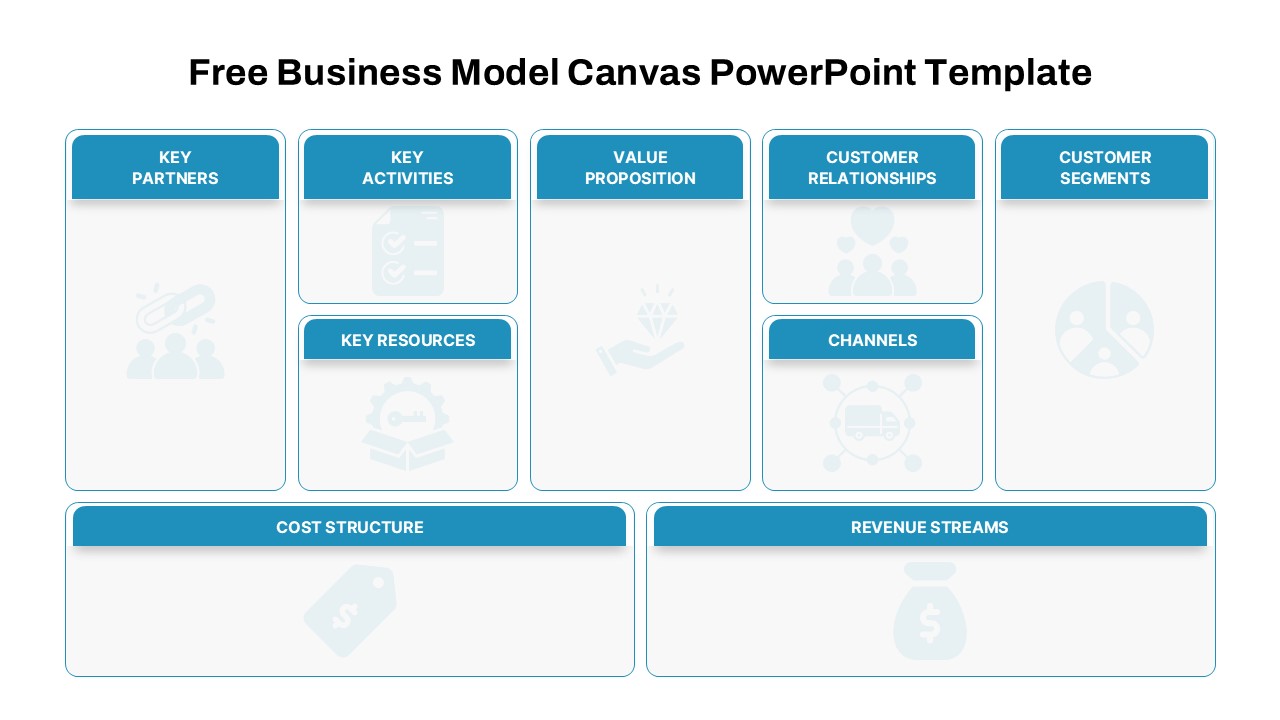
Free Business Model Canvas Diagram Slide Template for PowerPoint & Google Slides
Business Models
Free
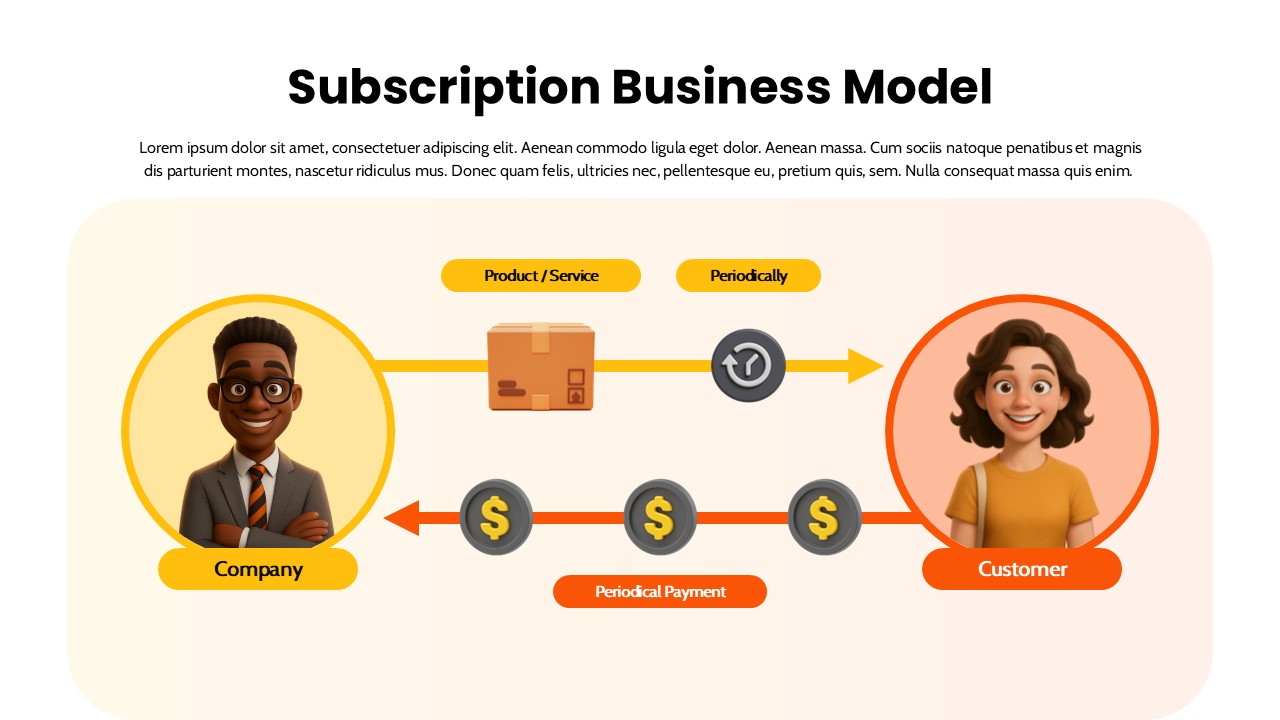
Subscription Business Model Flow Diagram Template for PowerPoint & Google Slides
Business Models