


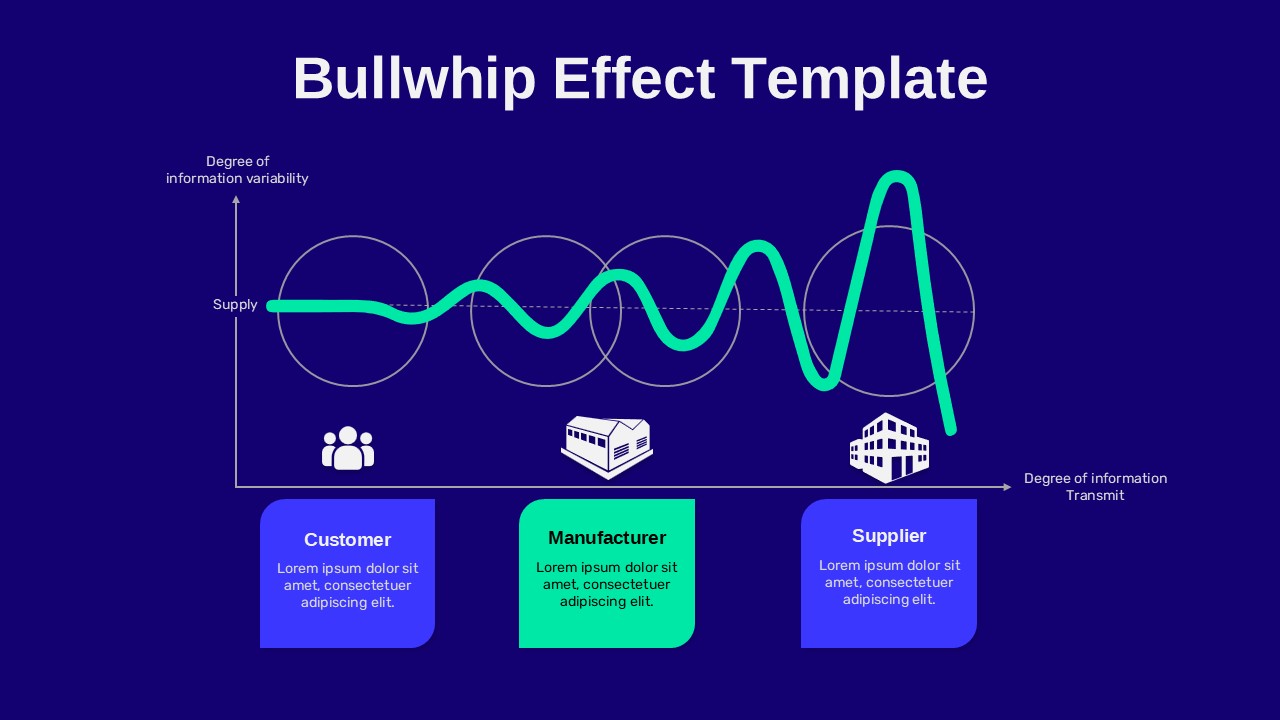
Bullwhip Effect Supply Chain Variability Diagram Google Slides Template
This template is part of a deck featuring multiple slides. To check out all slides, click on See All.
See All

Login to download this file
Item ID
SB05737Designed By
Naseeba