search

Essentials

Must-have decks for quick wins

By Industry

Professionally tailored slides for every sector

By Style

Minimal, modern and creative designs

By Topic

Explore slides curated by purpose and theme

TimelineTimelineRoadmapRoadmapStrategyStrategyGoalsGoalsTableTableComparisonComparisonSWOTSWOTAgendaAgendaArrowArrowWorld MapWorld MapMapsMapsProcessProcessFunnelFunnelTeamTeamOrg ChartOrg ChartPyramidPyramidCircularCircular

Business PlanBusiness PlanBusiness StrategyBusiness StrategyBusiness ProposalBusiness ProposalBusiness ModelsBusiness ModelsDigital MarketingDigital MarketingMarketing FunnelMarketing FunnelCustomer ExperienceCustomer ExperienceProject StatusProject StatusGantt ChartGantt ChartRecruitmentRecruitmentEmployee PerformanceEmployee PerformanceLeadershipLeadershipAIAIMachine LearningMachine Learning

AI Presentation Maker

Install the Windows plugin for quick access to templates and design tools.

AI Infographics Maker

Use our Office 365 add - in to access templates directly from the cloud.

Exe Version

Install the Windows plugin for quick access to templates and design tools.

Office 365

Use our Office 365 add - in to access templates directly from the cloud.

Mac Version

Get the Mac plugin to easily browse, insert, and customize templates and visuals within PowerPoint.

Bottleneck PowerPoint Template
This template is part of a deck featuring multiple slides. To check out all slides, click on See All. See All round right arrow

Description

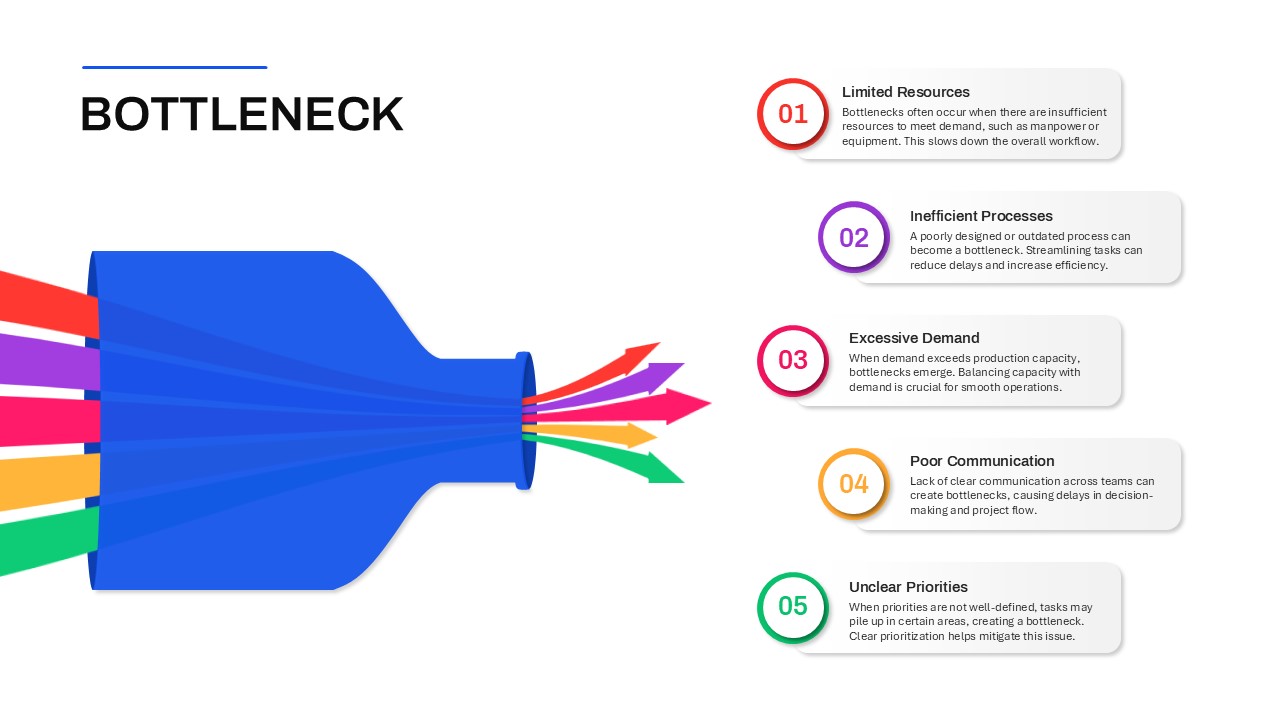
Leverage this Bottleneck Process Analysis slide to pinpoint workflow constraints using a visually compelling funnel diagram. Featuring a large bottle-shaped funnel on the left, the design channels multicolored input streams through a narrow neck, symbolizing capacity limitations and process pinch points. Five numbered callouts on the right—Limited Resources, Inefficient Processes, Excessive Demand, Poor Communication, and Unclear Priorities—provide space for descriptions, performance metrics, or corrective actions, enabling teams to diagnose root causes effectively.

Crafted with a modern flat aesthetic, crisp typography, and a vibrant color palette, this template delivers a polished, professional appearance that adapts seamlessly to corporate branding. Built on editable master slides, it empowers users to adjust funnel dimensions, swap icons, modify callout content, or refine color schemes in seconds. Optimized for both PowerPoint and Google Slides, the slide preserves full-resolution clarity across devices and eliminates formatting headaches. Integrated color guides and typography presets promote brand consistency and accessibility compliance, while real-time collaboration features and version control support cross-functional alignment.

Beyond bottleneck analysis, repurpose this versatile funnel infographic to illustrate sales pipelines, resource allocation workflows, demand forecasting models, or project phase gates. Simply relabel callouts, recolor streams, or adjust funnel geometry to suit objectives ranging from operational reviews and Lean Six Sigma workshops to executive risk briefings and capacity planning sessions. The balanced layout guides audiences through a clear narrative, fostering engagement, clarity, and data-driven decision making. Use the prebuilt callout boxes to highlight key insights, case studies, or milestone targets, accelerating alignment and driving continuous process improvement. The intuitive visualization fosters discussion and facilitates data-driven workshops with stakeholders. This design minimizes cognitive load, ensuring audiences grasp complex constraints at a glance.

Who is it for

Operational managers, process engineers, project leads, Lean Six Sigma practitioners, and executive teams can leverage this slide to uncover and communicate process bottlenecks, align on solutions, and drive throughput improvements.

Other Uses

Repurpose this diagram to map sales funnels, illustrate resource allocation models, visualize capacity planning workflows, track project phase gates, or support performance review dashboards by updating labels, icons, and color schemes.

Login to download this file

Add to favorites

Add to collection