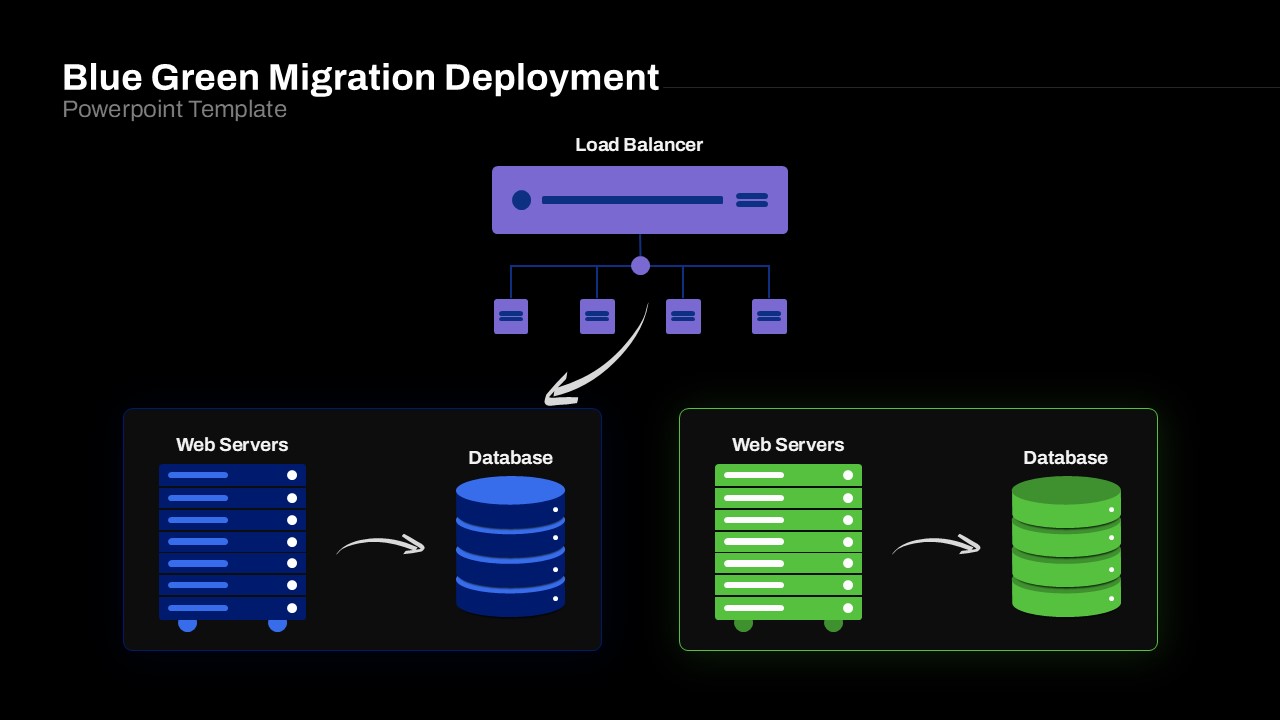
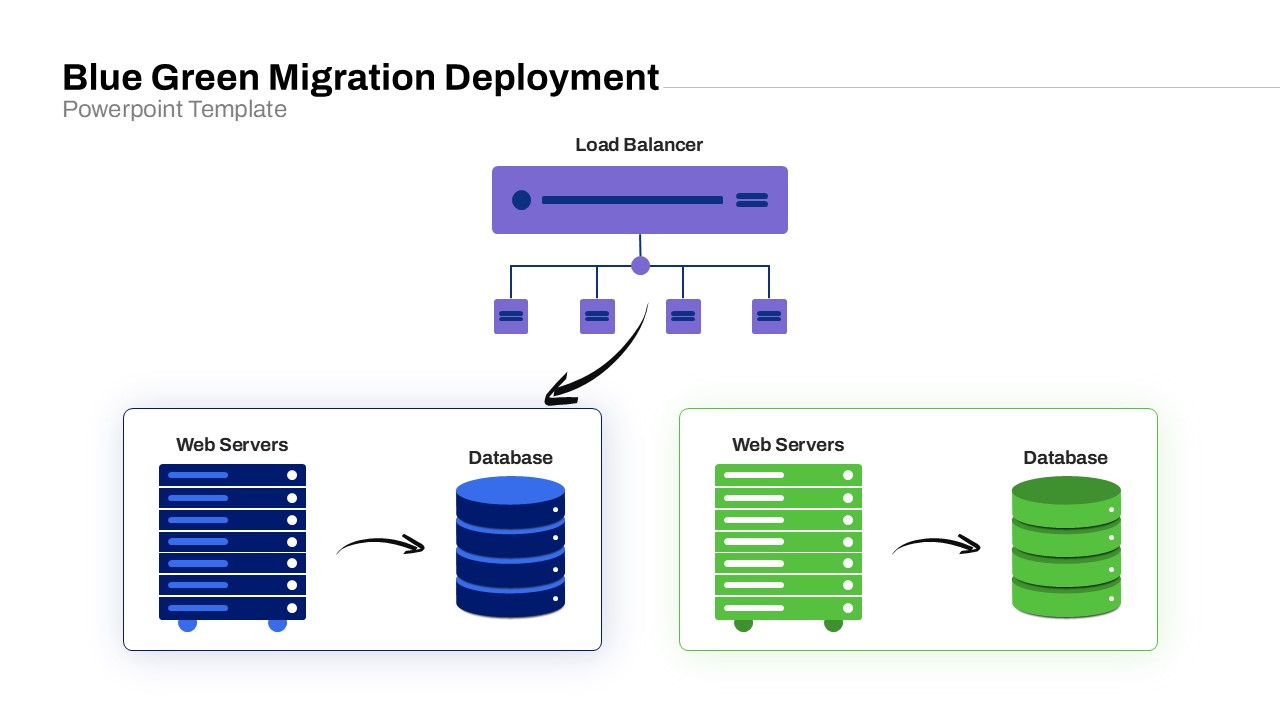
Blue Green Migration Deployment Presentation Slide


Description
This diagram slide features a central load balancer icon at the top—represented by a flat, purple rectangular server graphic—feeding traffic via an arrow to two bordered containers: the blue “Production (Blue)” environment on the left and the green “Staging (Green)” environment on the right. Within each container, stacked server rack icons illustrate Web Servers, and cylindrical database icons denote the persistent data layer. Labeled arrows clearly indicate request flows from web tier to database tier for each color-coded environment. The dual-panel design highlights the blue–green migration process and enables audiences to quickly grasp environment swapping.
All components are fully editable PowerPoint vector shapes linked to master slides. Theme color swatches govern the primary blue and green palettes, while arrow connectors use adjustable stroke weights and marker end styles for refined visual hierarchy. Text placeholders support custom headings, annotations, and environment labels; icons and infrastructure visuals can be replaced via drag-and-drop. Clean sans-serif typography and generous white space ensure readability and focus on the deployment workflow.
The slide grid uses consistent alignment and snap-to guides, facilitating precise element placement. Users can rename environment headings, adjust container borders, or recolor arrows to match brand guidelines in seconds. Duplicate or extend the panel layout to illustrate canary deployments, rollbacks, or multi-stage release pipelines. Prebuilt aspect ratio settings, animation transitions, and export-ready layouts ensure perfect fidelity across PowerPoint and Google Slides.
Optimized for both platforms, this template supports retina displays and printed handouts. The vector icons maintain crisp resolution when scaling to large-screen or print formats. The built-in slide notes section provides space for presenter cues and detailed technical commentary. All elements inherit theme fonts and formatting, ensuring seamless integration into existing corporate templates and compliance with brand standards.
Who is it for
Cloud architects, DevOps engineers, and IT operations teams will rely on this diagram to illustrate environment migration strategies and release workflows. Software development managers, infrastructure consultants, and technical trainers can use it to teach deployment best practices.
Other Uses
Repurpose this slide to visualize canary releases, A/B testing environments, rollback procedures, or multi-stage CI/CD pipelines. It’s also ideal for network topology overviews, server farm comparisons, and high-level system architecture diagrams.
Login to download this file