Block Slide

Description
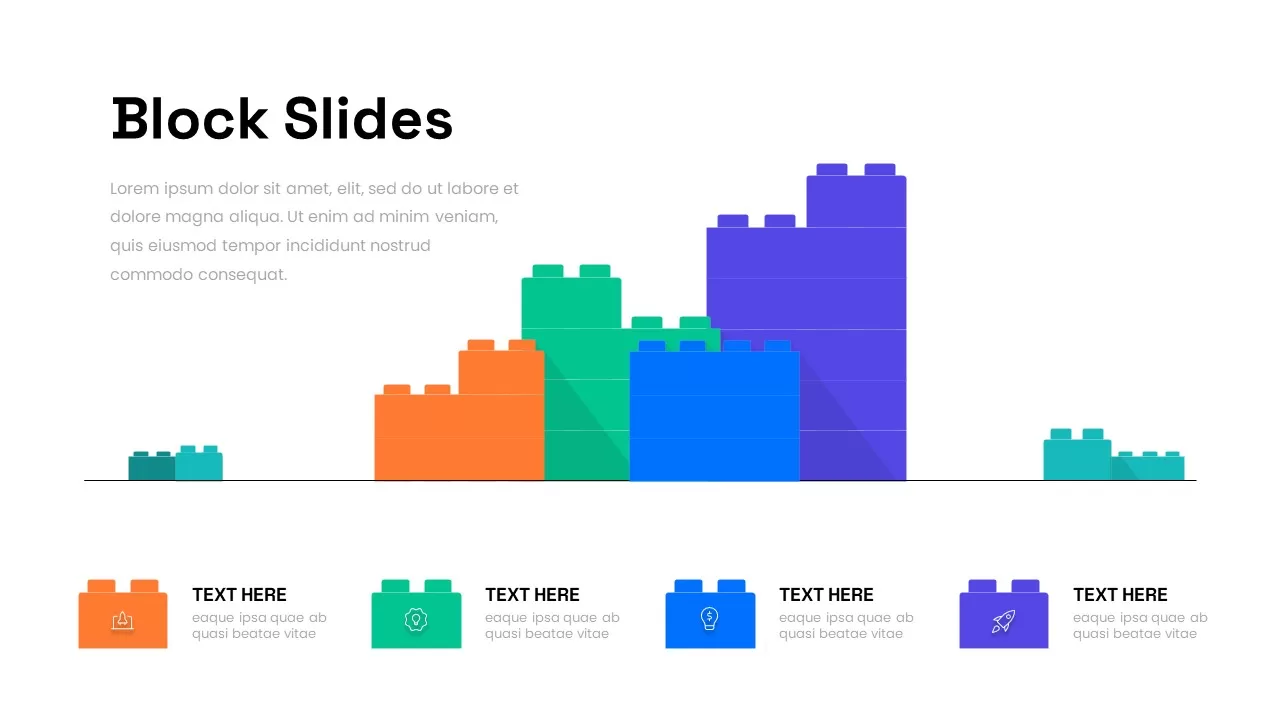
The Modular Block Infographic Slide leverages a series of colorful, LEGO-style block shapes arranged along a horizontal axis to illustrate comparative data or sequential stages with visual impact. Each block stack is composed of rectangular modules in vibrant teal, orange, green, blue, and purple, with subtle drop shadows and minimal outlines to create a modern flat design aesthetic. Beneath the main chart, a row of four distinct block icons—each housing a clear white line icon (e.g., a gear for processes, a dollar sign for finance, a rocket for launch, and an upload icon for deployment)—provides labeled placeholders for feature highlights, key metrics, or step descriptions. The clean white background and thin baseline divider ensure full focus on the content, while master slide compatibility and editable vector shapes allow effortless color swapping, resizing, and icon replacement.
Engineered for flexibility and brand consistency, this asset integrates seamlessly with theme fonts, alignment guides, and smart placeholders for text, enabling you to update layouts in seconds. The structured block grid supports multiple orientations—horizontal bar-style comparisons, stacked value modules for growth tracking, or sequential process flows—so you can tailor the visual narrative to your specific needs. High-contrast color coding combined with intuitive iconography ensures rapid comprehension, helping stakeholders scan data points and align on priorities at a glance.
Fully compatible with both PowerPoint and Google Slides, this slide maintains full resolution clarity across devices and eliminates common formatting pitfalls when collaborating across platforms. Designed for both strategic presentations and detailed analytical reports, this slide can accommodate data labels, percentage callouts, and dynamic animations. Use the modular blocks to represent quarterly performance trends, market share breakdowns, budget allocations, or milestone timelines with clean precision. The vector-based elements scale without loss of quality and can be recolored via theme palettes to match corporate branding or event themes. A hidden legend layer and optional grid lines offer further customization for highly technical audiences, while the minimalist flat look keeps overall design streamlined for executive reviews. Whether your goal is to deliver a pitch deck, board presentation, or client workshop, this block-based template enhances storytelling by breaking down complex information into modular, visually distinct segments.
Who is it for
Marketing managers, data analysts, and business strategists will benefit from this block-based infographic slide when presenting comparative metrics, project roadmaps, or feature roadmaps. Consultants, startup founders, product managers, and educators can leverage its modular design to illustrate multi-stage processes.
Other Uses
Apart from financial reports and product roadmaps, use this slide to outline onboarding processes, training modules, talent pipelines, or resource plans. Customize block heights and icons to track performance dashboards, sprint backlogs, or stakeholder milestones across departments.
Login to download this file


